Let's go out to eat! Show me places I would like By learning my tastes.
Let's go out to eat! Show me places I would like By learning my tastes.
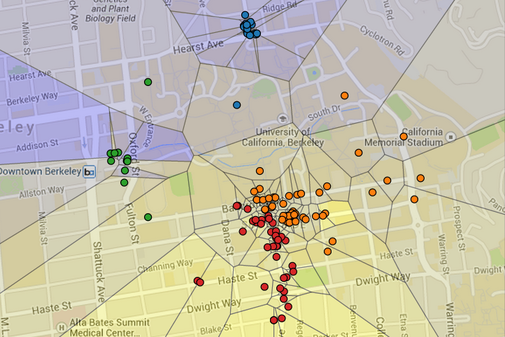
In this project, you will create a visualization of restaurant ratings using machine learning and the Yelp academic dataset. In this visualization, Berkeley is segmented into regions, where each region is shaded by the predicted rating of the closest restaurant (yellow is 5 stars, blue is 1 star). Specifically, the visualization you will be constructing is a Voronoi diagram.
In the map above, each dot represents a restaurant. The color of the dot is determined by the restaurant's location. For example, Northside restaurants are colored blue. The user that generated this map has a strong preference for Southside restaurants, so you can see that the predicted ratings for Southside restaurants are higher than restaurants anywhere else.
This project uses concepts from Sections 2.1, 2.2, and 2.3 of Composing Programs. It also introduces techniques and concepts from machine learning, a growing field at the intersection of computer science and statistics that analyzes data to find patterns and improve performance.
The maps.zip archive contains all the starter code and data sets.
The project uses several files, but all of your changes will be made to
utils.py, abstractions.py, and recommend.py.
abstractions.py: Data abstractions used in the projectrecommend.py: Machine learning algorithms and data processingutils.py: Utility functions for data processingucb.py: Utility functions for CS 61Adata: A directory of Yelp users, restaurants, and reviewsok: The autograderproj2.ok: The ok configuration filetests: A directory of tests used by okusers: A directory of user filesvisualize: A directory of tools for drawing the final visualizationThis is a 1-week project. You may work with one other partner. You should not share your code with students who are not your partner or copy from anyone else's solutions.
Start early! The amount of time it takes to complete a project (or any program) is unpredictable.
You are not alone! Ask for help early and often -- the TAs, readers, lab assistants, and your fellow students are here to help. Try attending office hours or posting on Piazza.
In the end, you will submit one project for both partners. The project is worth 20 points. 18 points are assigned for correctness, and 2 points for the overall composition of your program.
You will turn in the following files:
utils.pyabstractions.pyrecommend.pyYou do not need to modify or turn in any other files to complete the project. To submit the project, run the following command. You will be able to view your submissions on the OK dashboard.
python3 ok --submit
For the functions that we ask you to complete, there may be some initial code that we provide. If you would rather not use that code, feel free to delete it and start from scratch. You may also add new function definitions as you see fit.
However, please do not modify any other functions. Doing so may result in your code failing our autograder tests. Also, please do not change any function signatures (names, argument order, or number of arguments).
Throughout this project, you should be testing the correctness of your code. It is good practice to test often, so that it is easy to isolate any problems.
We have provided an autograder called ok to help you with
testing your code and tracking your progress. The first time you run
the autograder, you will be asked to log in with your @berkeley.edu
account using your web browser. Please do so. Each time you run
ok, it will back up your work and progress on our
servers.
The primary purpose of ok is to test your implementations, but there
is a catch. At first, the test cases are locked. To unlock tests,
run the following command from your terminal:
python3 ok -uThis command will start an interactive prompt that looks like:
=====================================================================
Assignment: Project 2: Yelp Maps
OK, version ...
=====================================================================

~~~~~~~~~~~~~~~~~~~~~~~~~~~~~~~~~~~~~~~~~~~~~~~~~~~~~~~~~~~~~~~~~~~~~
Unlocking tests

At each "? ", type what you would expect the output to be.
Type exit() to quit

---------------------------------------------------------------------
Question 0 > Suite 1 > Case 1
(cases remaining: 1)

>>> Code here
?
At the ?, you can type what you expect the output to be.
If you are correct, then this test case will be available the next time
you run the autograder.
The idea is to understand conceptually what your program should do first, before you start writing any code.
Once you have unlocked some tests and written some code, you can check the correctness of your program using the tests that you have unlocked:
python3 ok
To help with debugging, ok can also be run in
interactive mode:
python3 ok -i
If an error occurs, the autograder will start an interactive Python session in the environment used for the test, so that you can explore the state of the environment.
Most of the time, you will want to focus on a particular question.
Use the -q option as directed in the problems below.
The tests folder is used to store autograder tests, so make sure
not to modify it. You may lose all your unlocking progress if you
do. If you need to get a fresh copy, you can download the
zip archive and copy it over, but you
will need to start unlocking from scratch.
Before starting the core project, familiarize yourself with some Python features
by completing utils.py. Each function described below can be implemented in
one line. As you work through this phase, you can unlock the test cases for these
exercises by running ok:
python3 ok -q 0 -uOnce you have successfully unlocked the tests, you can apply them:
python3 ok -q 0A list comprehension constructs a new list from an existing sequence by first filtering the given sequence, and then computing an element of the result for each remaining element that is not filtered out. A list comprehension has the following syntax:
[<map expression> for <name> in <sequence expression> if <filter expression>]For example, if we wanted to square every even integer from 0 to 9, we could write:
>>> [x * x for x in range(10) if x % 2 == 0]
[0, 4, 16, 36, 64]
In utils.py, implement map_and_filter. This function takes in a sequence
s, a one-argument function map_fn, and a one-argument function filter_fn.
It returns a new list containing the result of calling map_fn on each element
of s for which filter_fn returns a true value. Make sure your solution is
only one line and uses a list comprehension.
minThe built-in min function takes a sequence, such as a list, and returns the
sequence's smallest element. The min function can also take a keyword
argument called key, which must be a one-argument function. The key
function is called with each element of the list, and the return values are
used for comparison. For example:
>>> min([-1, 0, 1]) # no key argument; smallest input
-1
>>> min([-1, 0, 1], key=lambda x: x*x) # input with the smallest square
0
In utils.py, implement key_of_min_value, which takes in a dictionary
d and returns the key that corresponds to the minimum value in d. This
behavior differs from just calling min on a dictionary, which would return
the smallest key. Make sure your solution is only one line and uses the min
function.
zipThe zip function defined in utils.py takes multiple sequences as arguments
and returns a list of lists, where the i-th list contains the i-th element
of each original list. For example:
>>> zip([1, 2, 3], [4, 5, 6])
[[1, 4], [2, 5], [3, 6]]

>>> for triple in zip(['a', 'b', 'c'], [1, 2, 3], ['do', 're', 'mi']):
...     print(triple)
['a', 1, 'do']
['b', 2, 're']
['c', 3, 'mi']
In utils.py, use the zip function to implement enumerate, which takes a
sequence s and a starting index start. It returns a list of pairs, in which
the i-th element is i+start paired with the i-th element of s. Make sure
your solution is only one line and uses the zip function and a range.
Note: zip and enumerate are also built-in Python functions, but their
behavior is slightly different than the versions provided in utils.py. The
behavior of the built-in variants will be described later in the course.
Complete the data abstractions in abstractions.py. Two of the data
abstractions have already been completed for you: the review data abstraction
and the user data abstraction. Make sure that you understand how they work.
Complete the implementations of the constructor and selectors for the restaurant data abstraction. You can use any implementation you choose, but the constructor and selectors must be defined together to satisfy the following description. A starter implementation using a dictionary is provided.
make_restaurant: return a restaurant constructed from five arguments:
name (a string)location (a list containing latitude and longitude)categories (a list of strings)price (a number)reviews (a list of reviews created by make_review)restaurant_name: return the name of a restaurantrestaurant_location: return the location of a restaurantrestaurant_categories: return the categories of a restaurantrestaurant_price: return the price of a restaurantrestaurant_ratings: return a list of ratings (numbers)First unlock the tests for this problem:
python3 ok -q 1 -uAnd then check that the tests pass:
python3 ok -q 1You can start an interactive Python session if an error occurs, using -i:
python3 ok -q 1 -iImplement restaurant_num_ratings and restaurant_mean_rating functions,
without assuming any particular implementation of a restaurant.
Be sure not to violate abstraction barriers! Test your implementation before moving on:
python3 ok -q 2 -u
python3 ok -q 2
When you finish, you should be able to generate a visualization of all
restaurants rated by a user. Use -u to select a user from the users
directory. You can even create your own.
python3 recommend.py
python3 recommend.py -u one_clusterNote: You may have to refresh your browser to update the visualization.
All changes in this phase will be made to recommend.py.
Restaurants tend to appear in clusters. The k-means algorithm is a method for discovering the centers of those clusters. It is called an unsupervised learning method because the algorithm is not told what the correct clusters are; it must infer the clusters from the data alone. When you complete this phase, all restaurants that appear together (such as Southside restaurants) will share a dot color to indicate that they are part of the same cluster.
The k-means algorithm finds k centroids within a dataset that each
correspond to a cluster of inputs. To do so, k-means begins by choosing k
centroids at random, then alternates between the following two steps:
This visualization is a good way to understand how the algorithm works.
As you complete the remaining questions, you will encounter the following terminology. Be sure to refer back here if you're ever confused about what a question is asking.
abstractions.pyabstractions.pyImplement find_closest, which takes a location and a sequence of
centroids (which are also locations). It returns the element of centroids
closest to location. You can use the distance function from utils.py to
measure distance between locations. If two centroids are equally close, return
the first one.
Hint: Use the min function.
Test your implementation before moving on:
python3 ok -q 3 -u
python3 ok -q 3Implement group_by_centroid, which takes a sequence of restaurants and a
sequence of centroids (locations). It returns a list of lists of restaurants
(a list of clusters). The i-th list of the result contains all of the
restaurants closest to the i-th centroid.
Hint: Use the provided group_by_first function to group together all values
for the same key in a list of [key, value] pairs.
Be sure not violate abstraction barriers! Test your implementation before moving on:
python3 ok -q 4 -u
python3 ok -q 4Implement find_centroid, which finds the centroid of the locations of a
sequence of restaurants. The centroid latitude is computed by averaging the
latitudes of the restaurant locations. The centroid longitude is computed by
averaging the longitudes.
Hint: Use the mean function from utils.py to compute the average value of
a sequence of numbers.
Be sure not violate abstraction barriers! Test your implementation before moving on:
python3 ok -q 5 -u
python3 ok -q 5Complete the implementation of k_means. In each iteration of the while
statement,
restaurants into clusters, where each cluster contains all
restaurants closest to the same centroid. (Hint: Use group_by_centroid)centroids to a new list of the centroids of all non-empty clusters.
(Hint: Use find_centroid)Test your implementation before moving on:
python3 ok -q 6 -u
python3 ok -q 6
Congratulations! You've now implemented an unsupervised learning algorithm.
Once you complete this question, your visualization should use different
colors for the restaurant dots in different areas of the map. You can adjust
the number of clusters using -k.
python3 recommend.py -k 2
python3 recommend.py -u likes_everything -k 3All changes in this phase will be made to recommend.py.
This phase implements prediction of what rating a user would give for a restaurant. You will implement a supervised learning algorithm that attempts to generalize from examples for which the correct rating is known, which are all of the restaurants that the user has already rated. By analyzing a user's past ratings, we can then try to predict what rating the user might give to a new restaurant. When you complete this phase, your visualization will include all restaurants, not just the restaurants that were rated by a user.
To predict ratings, you will implement simple least-squares linear regression, a widely used statistical method that approximates a relationship between some input feature (such as price) and an output value (the rating) with a line. The algorithm takes a sequence of input-output pairs and computes the slope and intercept of the line that minimizes the mean of the squared difference between the line and the outputs.
Implement the find_predictor function, which takes in a user, a sequence of
restaurants, and a feature function called feature_fn. It returns two
values: a predictor function and an r_squared value.
Use least-squares linear regression to compute the predictor and r_squared.
This method, described below, computes the coefficients a and b for the
predictor line y = a + bx. The r_squared value measures how accurately
this line describes the original data.
One method of computing these values is by calculating the sums of squares,
S_xx, S_yy, and S_xy:
After calculating the sums of squares, the regression coefficients and
r_squared are defined as follows:
Hint: The mean, zip, and pow functions can all be helpful here.
Test your implementation before moving on:
python3 ok -q 7 -u
python3 ok -q 7Implement best_predictor, which takes a user, a dictionary of restaurants,
and a sequence of feature functions. It computes a predictor using each feature
function, then returns the one that has the highest r_squared value. All
predictors are learned from the subset of restaurants reviewed by the user
(called reviewed in the starter implementation).
Hint: The max function can also take a key argument, just like min.
Test your implementation before moving on:
python3 ok -q 8 -u
python3 ok -q 8Implement rate_all, which returns a dictionary from restaurant names to
ratings. Instead of simply providing average ratings, rate_all is specific to
a user. The rate_all function takes a user and dictionary from restaurant
names (strings) to restaurants. It returns a dictionary with same keys as
restaurants. Its values are ratings (numbers). If a restaurant was rated by
the user, its rating is the user's rating. Otherwise, its rating is computed by
the best predictor for the user. The predictor is chosen using a sequence of
feature_functions.
Hint: The user_reviewed_restaurants function from abstractions.py helps
determine which restaurants have been reviewed by the user.
Be sure not violate abstraction barriers! Test your implementation before moving on:
python3 ok -q 9 -u
python3 ok -q 9
You can now visualize all restaurants using -p, which predicts ratings based
on the preferences of a user:
python3 recommend.py -p -u likes_southside -k 5To focus the visualization on a particular category of restaurant, implement
search. The search function takes a category query and a sequence of
restaurants. It returns all restaurants that have query as a category.
Be sure not violate abstraction barriers! Test your implementation:
python3 ok -q 10 -u
python3 ok -q 10
Congratulations, you have completed the project! The -q option provides a
category. For example, the following command visualizes all sandwich
restaurants and their predicted ratings for the likes_expensive user:
python3 recommend.py -p -q Sandwiches -u likes_expensive -k 2