Instructions
Phase III
In this phase, we wish to see the effect of random link losses and link layer retransmissions on the end to end behavior of TCP. We will study the effect of link unreliability by introducing random packet losses into the link and observe their effect on the throughputs of flows. A good example of such an unreliable link is a wireless link. Note that now packets can get dropped in two ways: due to congestion losses and due to random losses caused by the link being unreliable. Note that in all the simulations you need to use TCP Reno. So, all references to TCP mean TCP Reno.
- Baseline: In case 1, we consider A-B-C with source A and destination C. Link A-B has propagation delay 10 ms and bandwidth 2 Mbps. Link B-C has propagation delay 40 ms and bandwidth 1 Mbps. Consider an FTP-TCP flow from A to C. You may assume that the packets are of size 1250 bytes.
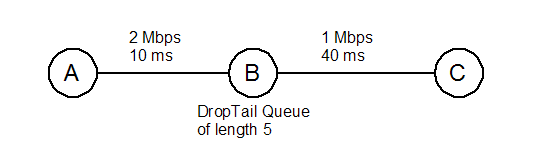
- Find the long-term throughput of this TCP flow.
- Now, introduce a random packet loss rate of 5% on
the link B-C and find the long-term throughput. How does this throughput
compare to case (a)? Is it simply related to the loss rate directly (i.e.
is it 95% of the throughput in part (a)?) or is the effect more
pronounced? Why or why not?
Note: You will need to associate an ErrorModel object to the link B-C after the queue. The summary on page 127-128 of the ns documentation is particularly helpful. - Keeping the loss rate on the link B-C at 5%, repeat part (b) with the propagation delays on the link A-B as 60ms, 110ms and 160ms. Use this data (and part (b)) to plot the long-term throughput against the round trip time. What can you infer about the dependence of long-term throughput on the round trip time? You answer should indicate roughly what function approximates this dependence. Explain why this is so.
- Keeping the propagation delay on the link B-C at 40ms, repeat part (b) with the loss rates on the link B-C as 25%, 1%, and 0.2%. Use this data (and part (b)) to plot the long-term throughput against the packet loss rate. What can you infer about the dependence of long-term throughput on the packet loss rate? You answer should indicate roughly what function approximates this dependence. Explain why this is so.
- Link Retransmission: Now, we will
simulate link level retransmission for problem 1. If we assume that the
link retransmits the packets if there are losses and assuming that the
losses are independent and identically distributed Bernoulli random
variables across packets, we may model the number of transmissions per
packet as a geometric random variable with mean (1 / 0.95).
Effectively, we may replace the link delay for link B-C with the value
40/0.95 ms (Why is it greater than 40 ms?). Note that now we are assuming
that the link B-C incurs no losses. Hence, use this new value for the link
delay to
- Find the long term throughput of this TCP flow. How does it compare to part (b) of problem 1? Does it improve the throughput of the flow? Why or why not?
- Two flows: Consider the situation in the
following figure.
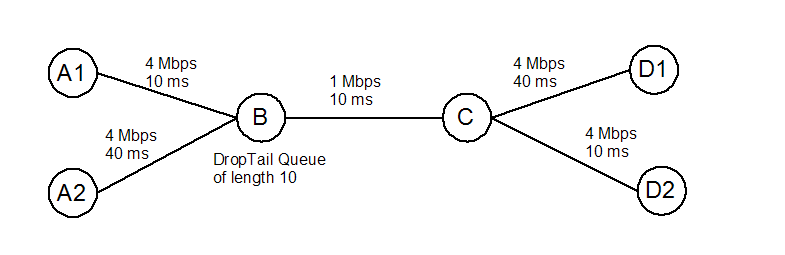
The link C-D1 is lossy with a packet loss rate of 5%. There is an FTP-TCP flow from A1 to D1 and another from A2 to D2. Assume that all the packets are of size 1250 bytes.
- What are the long-term throughputs for the two flows? Is the bandwidth fairly shared by the two flows? Why or why not?
- Similar to problem 2, we now model link layer
reliability by making the link C-D1 lossless and increasing the delay to
40ms/0.95. What are the long-term throughputs for the two flows now? Is
the bandwidth fairly shared by the two flows? Why or why not?
Tips
- Avoid using the trace-all/namtrace-all feature for long simulations -- it will fill up your disk quota.
- For all simulations, set window_ variable for all TCP agents to 100000 to ensure that the receiver window size does not become a bottleneck.
- Sections on “Error Model” (Chapter 13) in the NS Documentation should be useful for this project.
Project Submission
Phase III
Submit a report along with the
ns-2 scripts used together in a single tar file. Email the tar file to ee122-ta@imail.eecs.berkeley.edu,
ee122-tb@imail.eecs.berkeley.edu
with the subject line as "EE122 Project Phase III" by
Resources
- ns-2 is installed on the instructional machines under /share/instsww/pkg/ns-allinone-2.27-fasttcp. To run it from your account make sure to add /share/instsww/ns-allinone-2.27-fasttcp/bin to the PATH environment variable and /usr/sww/lib to the LD_LIBRARY_PATH variable.
- ns-2 online documentation is here.
- gnuplot is a good tool for generating plots. You will find useful links here.