| Allegro CL version 6.2 Unrevised from 6.1 | |||||||||
The Debug window displays debugging information when an error (more
precisely, any unhandled condition that calls break) occurs in the
IDE. Debugging in general is described in debugging.htm. Please look at that
document for detailed discussion of the information displayed by the
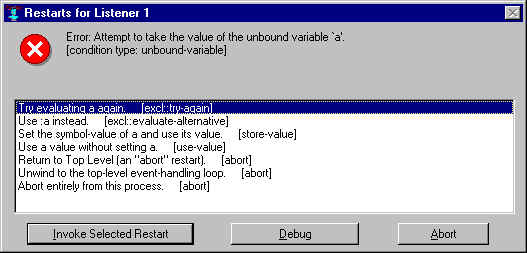
debugger and debugging features. To produce the illustration, the
unbound symbol a was entered to the Debug window
prompt. Since a had no value, this Restarts dialog
was displayed:
Clicking on Abort will cause the error to be unwound. Clicking on Debug changed the display of the Debug window to look like this, with the listener below and the debugging pane above: (click here to see the description of the listener in the Debug window):
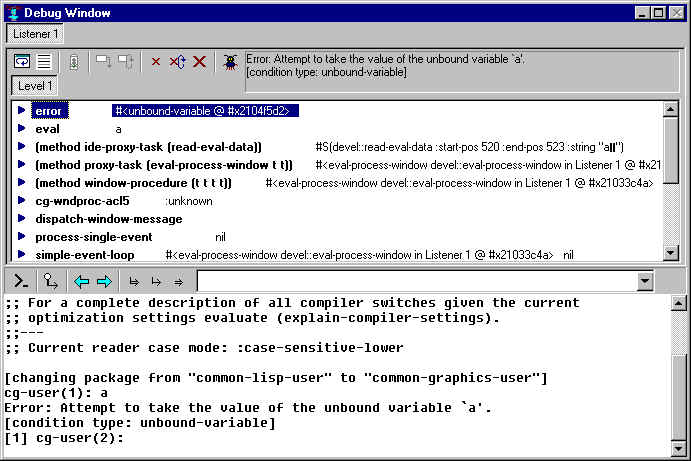
The debugging section at the top shows the error message in the text control to the right. (The message also appears in the listener portion but that is in part because that is where the error occurred). Below the toolbar, an outline control shows a stack backtrace (similar but not identical to what is printed in a listener in response to the :zoom command -- see the note The Debug Window after an error and the :zoom top-level command below). The buttons on the toolbar, identified by their tooltips, are as follows. Note that if a button is inappropriate for a situation, it is inactive and its tooltip will not be displayed.
There are two ways to see the arguments and local variables of any function call (also called a frame) in the backtrace outline. One way is to "open" the outline item to see the arguments in place in the outline widget. Do this either by clicking the small blue arrow at the left of the outline item, or by selecting it and pressing the right arrow key (as usual with an outline control). It may be most handy to use the up and down arrow keys to peruse the stack, then pressing the right arrow key to see the arguments of a function call, and then pressing the left arrow key to close that item before proceeding to another one (to get the previous list of arguments out of the way).
The other way to view the arguments and local variables is to show them in the inspector. This can be done either by double-clicking the outline item for the desired function call (to the right of the blue arrow), by selecting the "Inspect Arguments and Variables" command from the right-button menu of the outline-item, or by invoking the Tools | Inspect Selected Object command while the desired outline-item is selected.
A combination of these two techniques may be used by opening an outline-item and then double-clicking one of the arguments (or using Tools | Inspect Selected Object) to inspect an individual argument value.
When viewing arguments and local variables directly in the outline control, the icon at the left of each value indicates what type of argument or value it is. Each icon is actually three letters, where "Req" indicates a required argument, "Key" a keyword argument, "Opt" an optional argument, "Res" a rest argument, "Aux" an aux argument, and "Loc" indicates a local variable value. The icons are in different colors to help distinguish them.
The "Inspect Function Object" (or "Inspect Method Object") command on the right-button menu of a backtrace outline-item will inspect the function or method itself, rather than its arguments and local variables. Unlike the other commands on this right-button menu, this one is not a shortcut for any IDE menu-bar command, and so this particular action may be invoked only from the right-button menu.
Though the IDE implements this specialized graphical interface for
browsing a backtrace and proceeding from an error, the corresponding
top-level commands such as :zoom
are still always available in the listener pane. If both techniques
are used simultaneously, note that the two views of the stack are
independent, with each one maintaining its own currently selected
stack frame, and each one independently either currently showing
hidden frames or not. (The IDE display depends on the Include
Hidden Frames/Hide Hidden frames button, the :zoom display depends on whether :zoom is called with :all
t or :all nil.) In addition, the IDE
backtrace outline always shows the whole stack (adding new clumps of
frames as you scroll to the bottom), while the :zoom command shows a certain number of
frames according to its (sticky) count argument.
Copyright (c) 1998-2002, Franz Inc. Oakland, CA., USA. All rights reserved.
Documentation for Allegro CL version 6.2. This page was not revised from the 6.1 page.
Created 2002.2.26.
| Allegro CL version 6.2 Unrevised from 6.1 | |||||||||