| Allegro CL version 6.2 Unrevised from 6.1 | |||||||||
The Trace dialog, displayed by Run
| Trace dialog,
provides a graphical display (using an outline
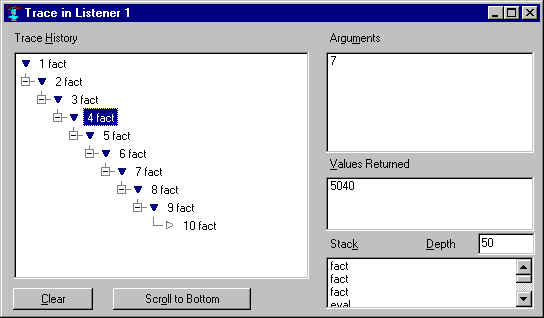
control) of traced functions and how they are called. If any function
in the display is selected (4 fact is selected in
the illustration), the arguments to that function are displayed in the
Arguments field, the values returned in the Values Returned field. The
Stack field shows a stack backtrace (function names only) to the depth
indicated in the Depth field. Click on Clear to clear the
display. Scroll bars appear in the Trace History field if necessary
(the illustration does not show scroll bars). Clicking on Scroll to
Bottom displays the bottom of the Trace History.
The numbers next to the function names are just labels.
Note: when the Trace dialog is open, even if it is iconized or buried
under other windows, all trace output goes to it and not to the debug
window. That is, when the state of the Trace dialog is
:normal, :maximized, or
:icon, trace output goes to it. If the state is
:shrunk, trace output does not go to it. (Nor,
obviously, when the dialog does not exist at all.)
Traced calls that occur in multiple threads are combined into the single outline widget of the Trace Dialog, but hierarchies of traced calls in multiple threads are never interleaved in the outline. Specifically, the tree of calls that appear under a single top-level item in the trace outline are always calls that occurred in the same thread as that top-level item; any traced calls that occurred in other threads during the call represented by that top-level item will appear under further distinct top-level items of the trace outline. The numbers at the left of each outline item, on the other hand, indicate the global order in which the individual calls occurred; so the numbers will not be in numerical order from top to bottom if hierarchies of traced calls in multiple threads overlap in time. The title of the Trace Dialog indicates the thread in which the currently selected call occurred.
See trace-format for a way to write arbitrary debugging output to the Trace Dialog. See process-trace-color and with-trace-color for information on modifying the background color on a per-process basis. The configuration option scroll-while-tracing allows you to view new trace output as it is being collected.
The File | Save command is implemented for the trace dialog to save all the trace info (except the stack for each call) as an indented text file.
Copyright (c) 1998-2002, Franz Inc. Oakland, CA., USA. All rights reserved.
Documentation for Allegro CL version 6.2. This page was not revised from the 6.1 page.
Created 2002.2.26.
| Allegro CL version 6.2 Unrevised from 6.1 | |||||||||