CS 194-26 Project 1: Images of the Russian Empire, or Colorizing the Prokudin-Gorskii Photo Collection
Premise
Sergei Mikhailovich Prokudin-Gorskii, a Russian photographer born in 1863, began taking pseudo-color images in 1907 before color photography was invented. This was done by taking black-and-white photos of a single scene through red, green, and blue filters individually. Later, the Library of Congress purchase these photos, scanned them, and made them available online. The goal of this project is to take these black-and-white images and reconstruct them into colorized images. We do this by aligning images and then merging them, taking each individual image as an R, G, or B value when merging.
The Process
Basic Implementation
We begin with an image downloaded from the Library of Congress:
This image contains the blue-filtered, green-filtered, and red-filtered images (which will eventually become the blue, red, and green channels of a single image).
Then we split the image into even thirds.
Notice that during the scanning process, extra whitespace and borders are added
to the images. These aren't inherent parts of the images, so we crop them out. I
cropped a hard-coded 10% of the image from each side, which seemed to remove
borders successfully without taking too much out of the original images. Here is
the red image cropped:
Next, we need to align the images such that when we layer them on top of each other, the red, green, and blue images match up pixel-by-pixel. We do this by selecting one image to be the reference (in my case, the blue image was always the reference), and trying different translations of another image (i.e. the green or red images) in the x and y direction such that we find the minimum Sum of Squared Differences between the reference image and the image to align. We calculate the Sum of Squared Differences (SSD) by comparing A' (the translated image to adjust) to B (the reference) and calculating the summation of (B[y][x] - A'[y][x])^2 for each valid [x][y] where both images had values. Now, some translations allowed more overlap with the reference image which would lead the SSD to be larger, so we normalized the SSD by dividing by the total number of pixels summed over.
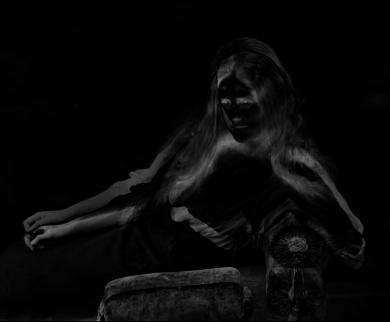
Here is an example image of the pixel-wise squared difference values when comparing the red image to the blue image with no translation:
Here is the same image, but shifted to the right by 11 pixels and down 115 pixels, which we found as the minimizer of SSDs by this method:
Now, how did we find the actual best translation to minimize the SSD? Instead of doing an exhaustive search, we used an image pyramid where we:
- Repeatedly shrunk the image by half until we hit a small-enough size, which we defined as having a width of < 400 pixels.
- Found the (x, y) that minimized the SSD betwen the image to adjust translated by that vector and the reference image. We fixed x, y to be only in [-25, 25] to limit the search space.
- After finding the optimal (x, y) for the most shrunk image, we returned to the second-most shrunk image (i.e. the onle double its size), and found the new minimum SSD from the range x' in [2x-delta, 2x+delta] and y' in [2y-delta, 2y+delta]. We set delta as 4. Essentially, we find the new optimal (x', y') translation for the larger image.
- Repeat step (3) with the image double its size, and find x'' from [2x'-4, 2x'+4] and y'' from [2y'-4, 2y'+4].
- Keep repeating until we have found the optimal (x, y) vector for the original-sized image. This essentially does a binary search over two dimensions for the optimal vector and reduces computing time.
After we have found the optimal alignments for the red and green images, we merge them with the blue image by setting the red image's brightnesses to be the red channel of the new image, and so on. We also crop the input images to ensure the outputted image is an intersection of the aligned images rather than the union to prevent odd-looking colored borders.
The final product of the basic approach:
Bells and Whistles
Better Features
Computing the SSD does not always work because different color channels have different brightness levels that may not always be correlated. In this case, we instead want to calculate the SSD on something other than the raw brightness levels of each image: we calculate the SSD based on the the edges present in each image. Before we calculate the SSD, we put the image in question through a Sobel filter which and maps the each pixel in the image to the differences between its surrounding pixels. This means pixels along edges would have larger values. We then find the vector that minimizes the SSD of the Sobel-ized reference image and the Sobel-ized image to align.
This is what the Sobel filter looks like on the red channel of the image:
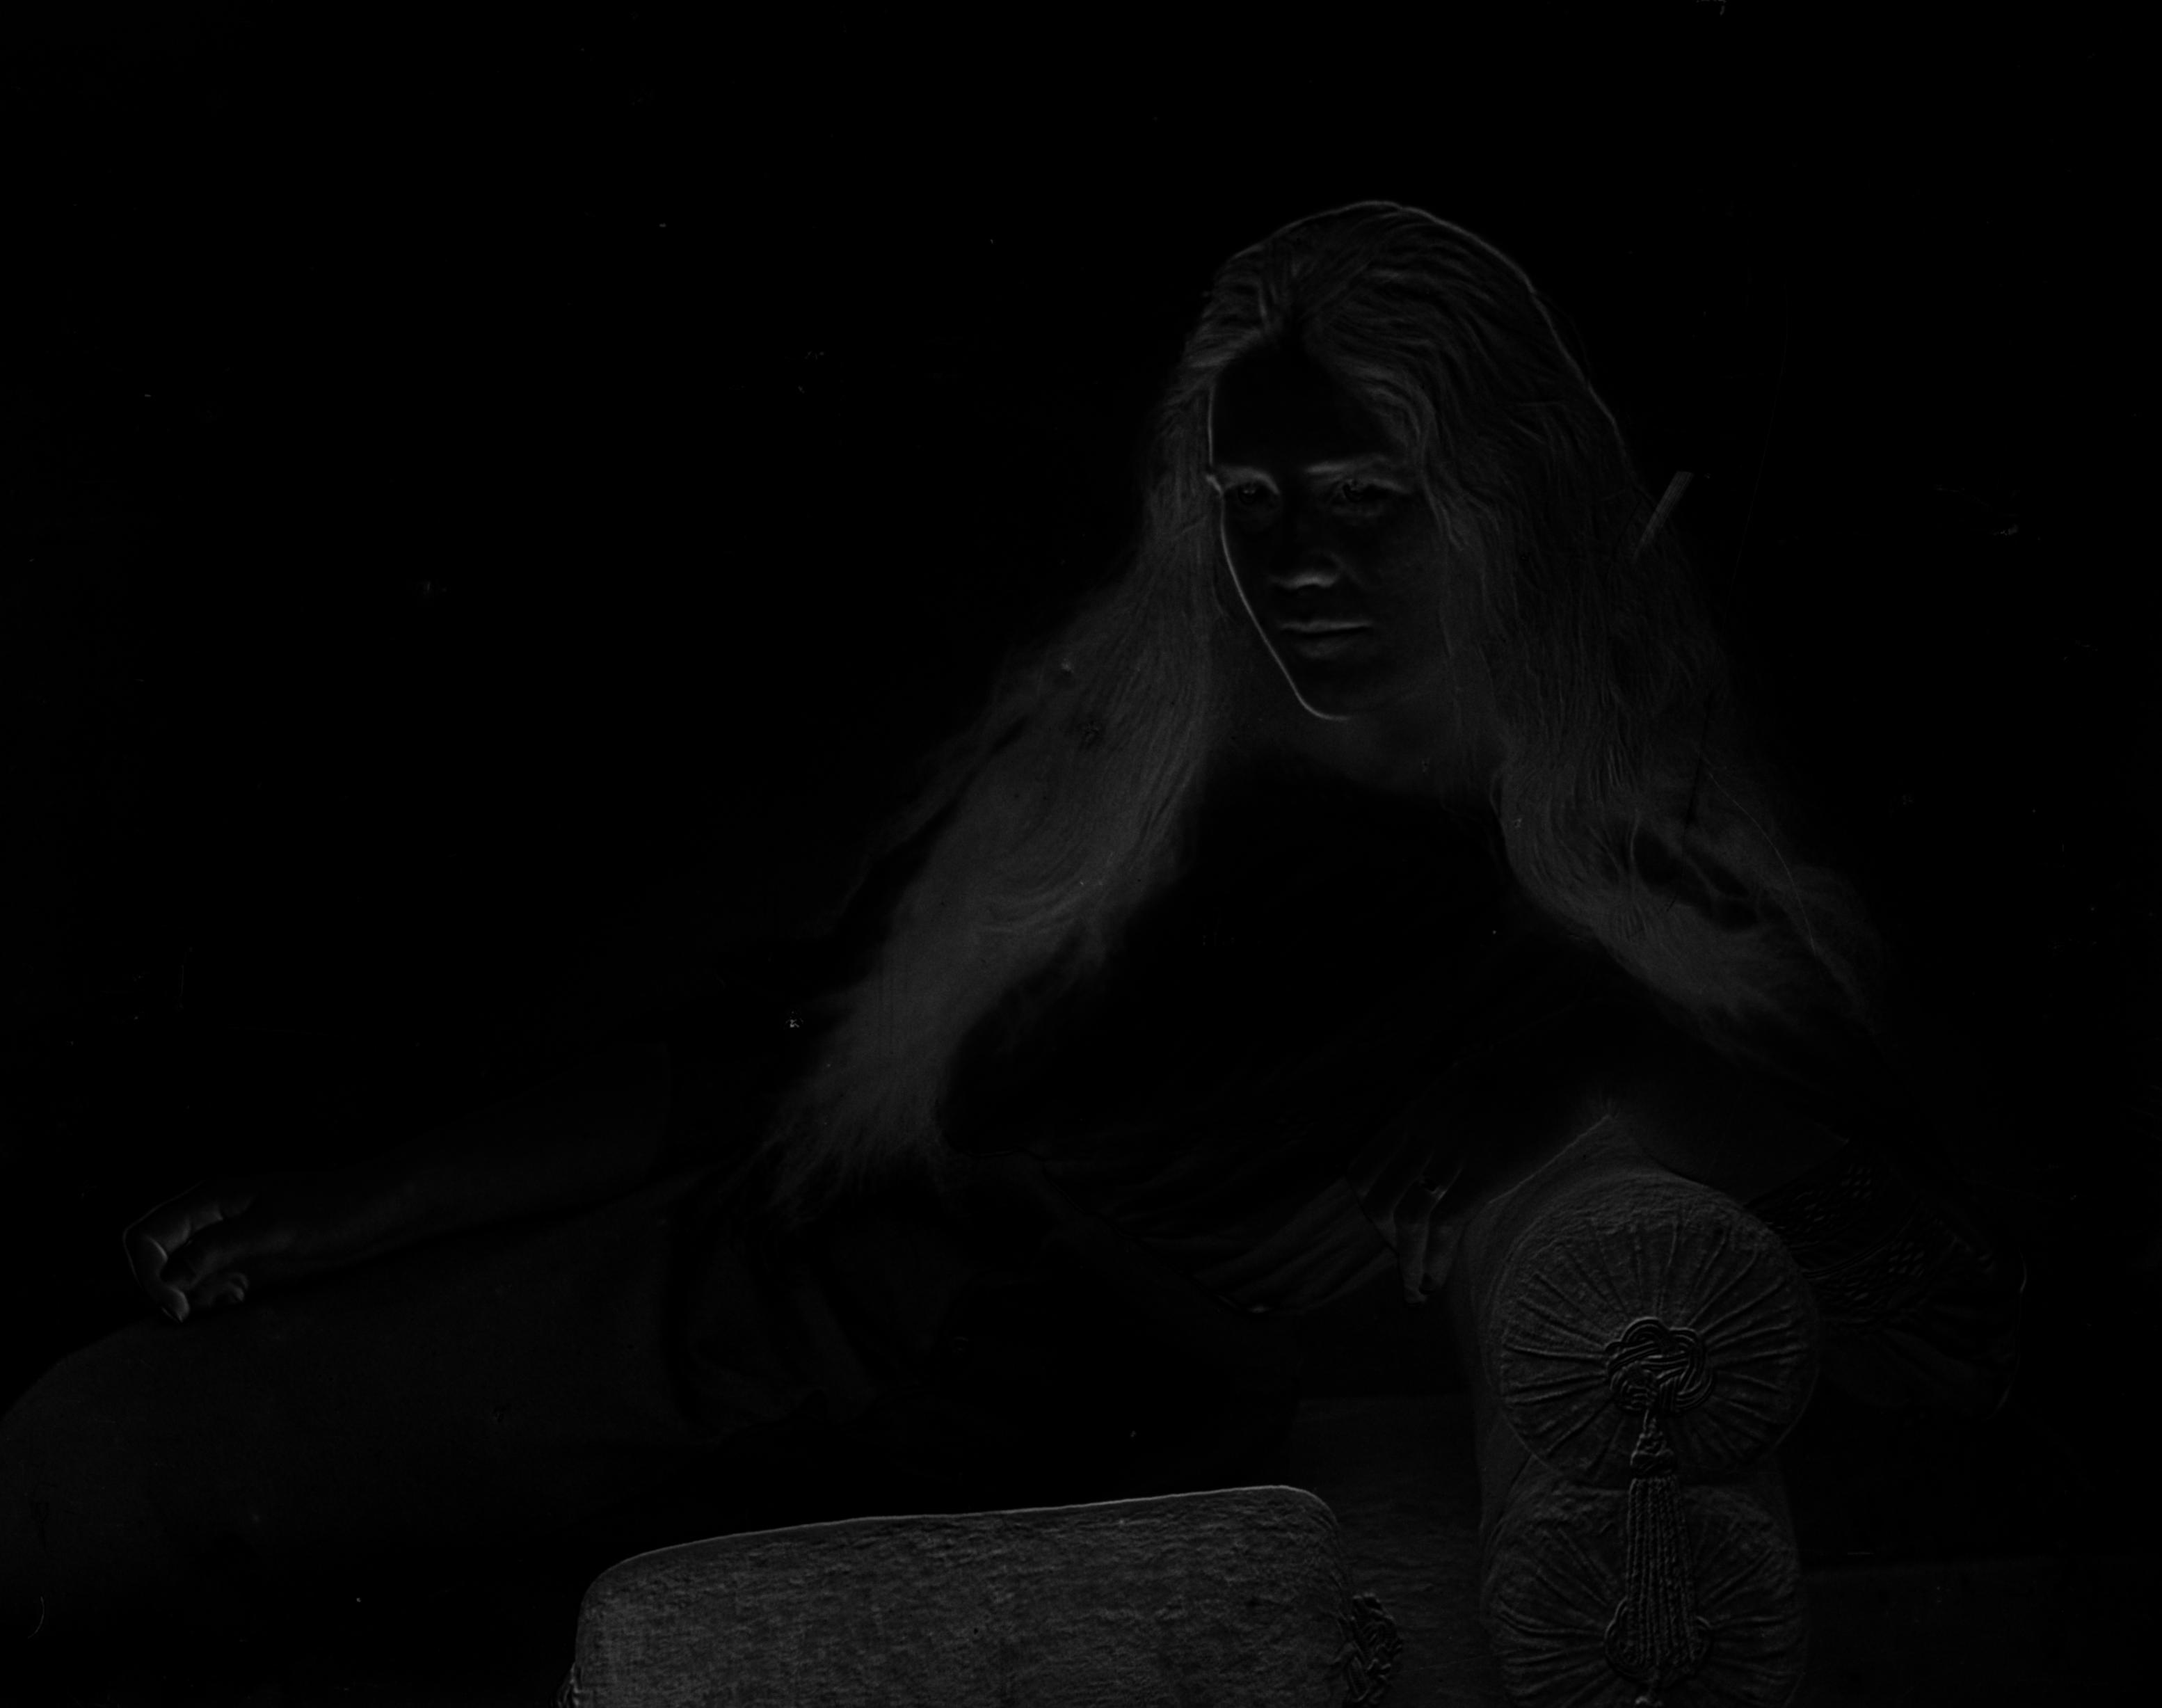
And this is what the squared-difference looks like when the red image is optimally aligned to the blue image (at x = 15 and y = 115):

Note that this image is essentially just black (in fact the unnormalized SSD of this 3106 x 2450 is just 825, compared to the basic method's 136584).
The output of our colorization with improved features is here:
For reference, the original colorization:
It's not a huge improvement on our original method in this case.
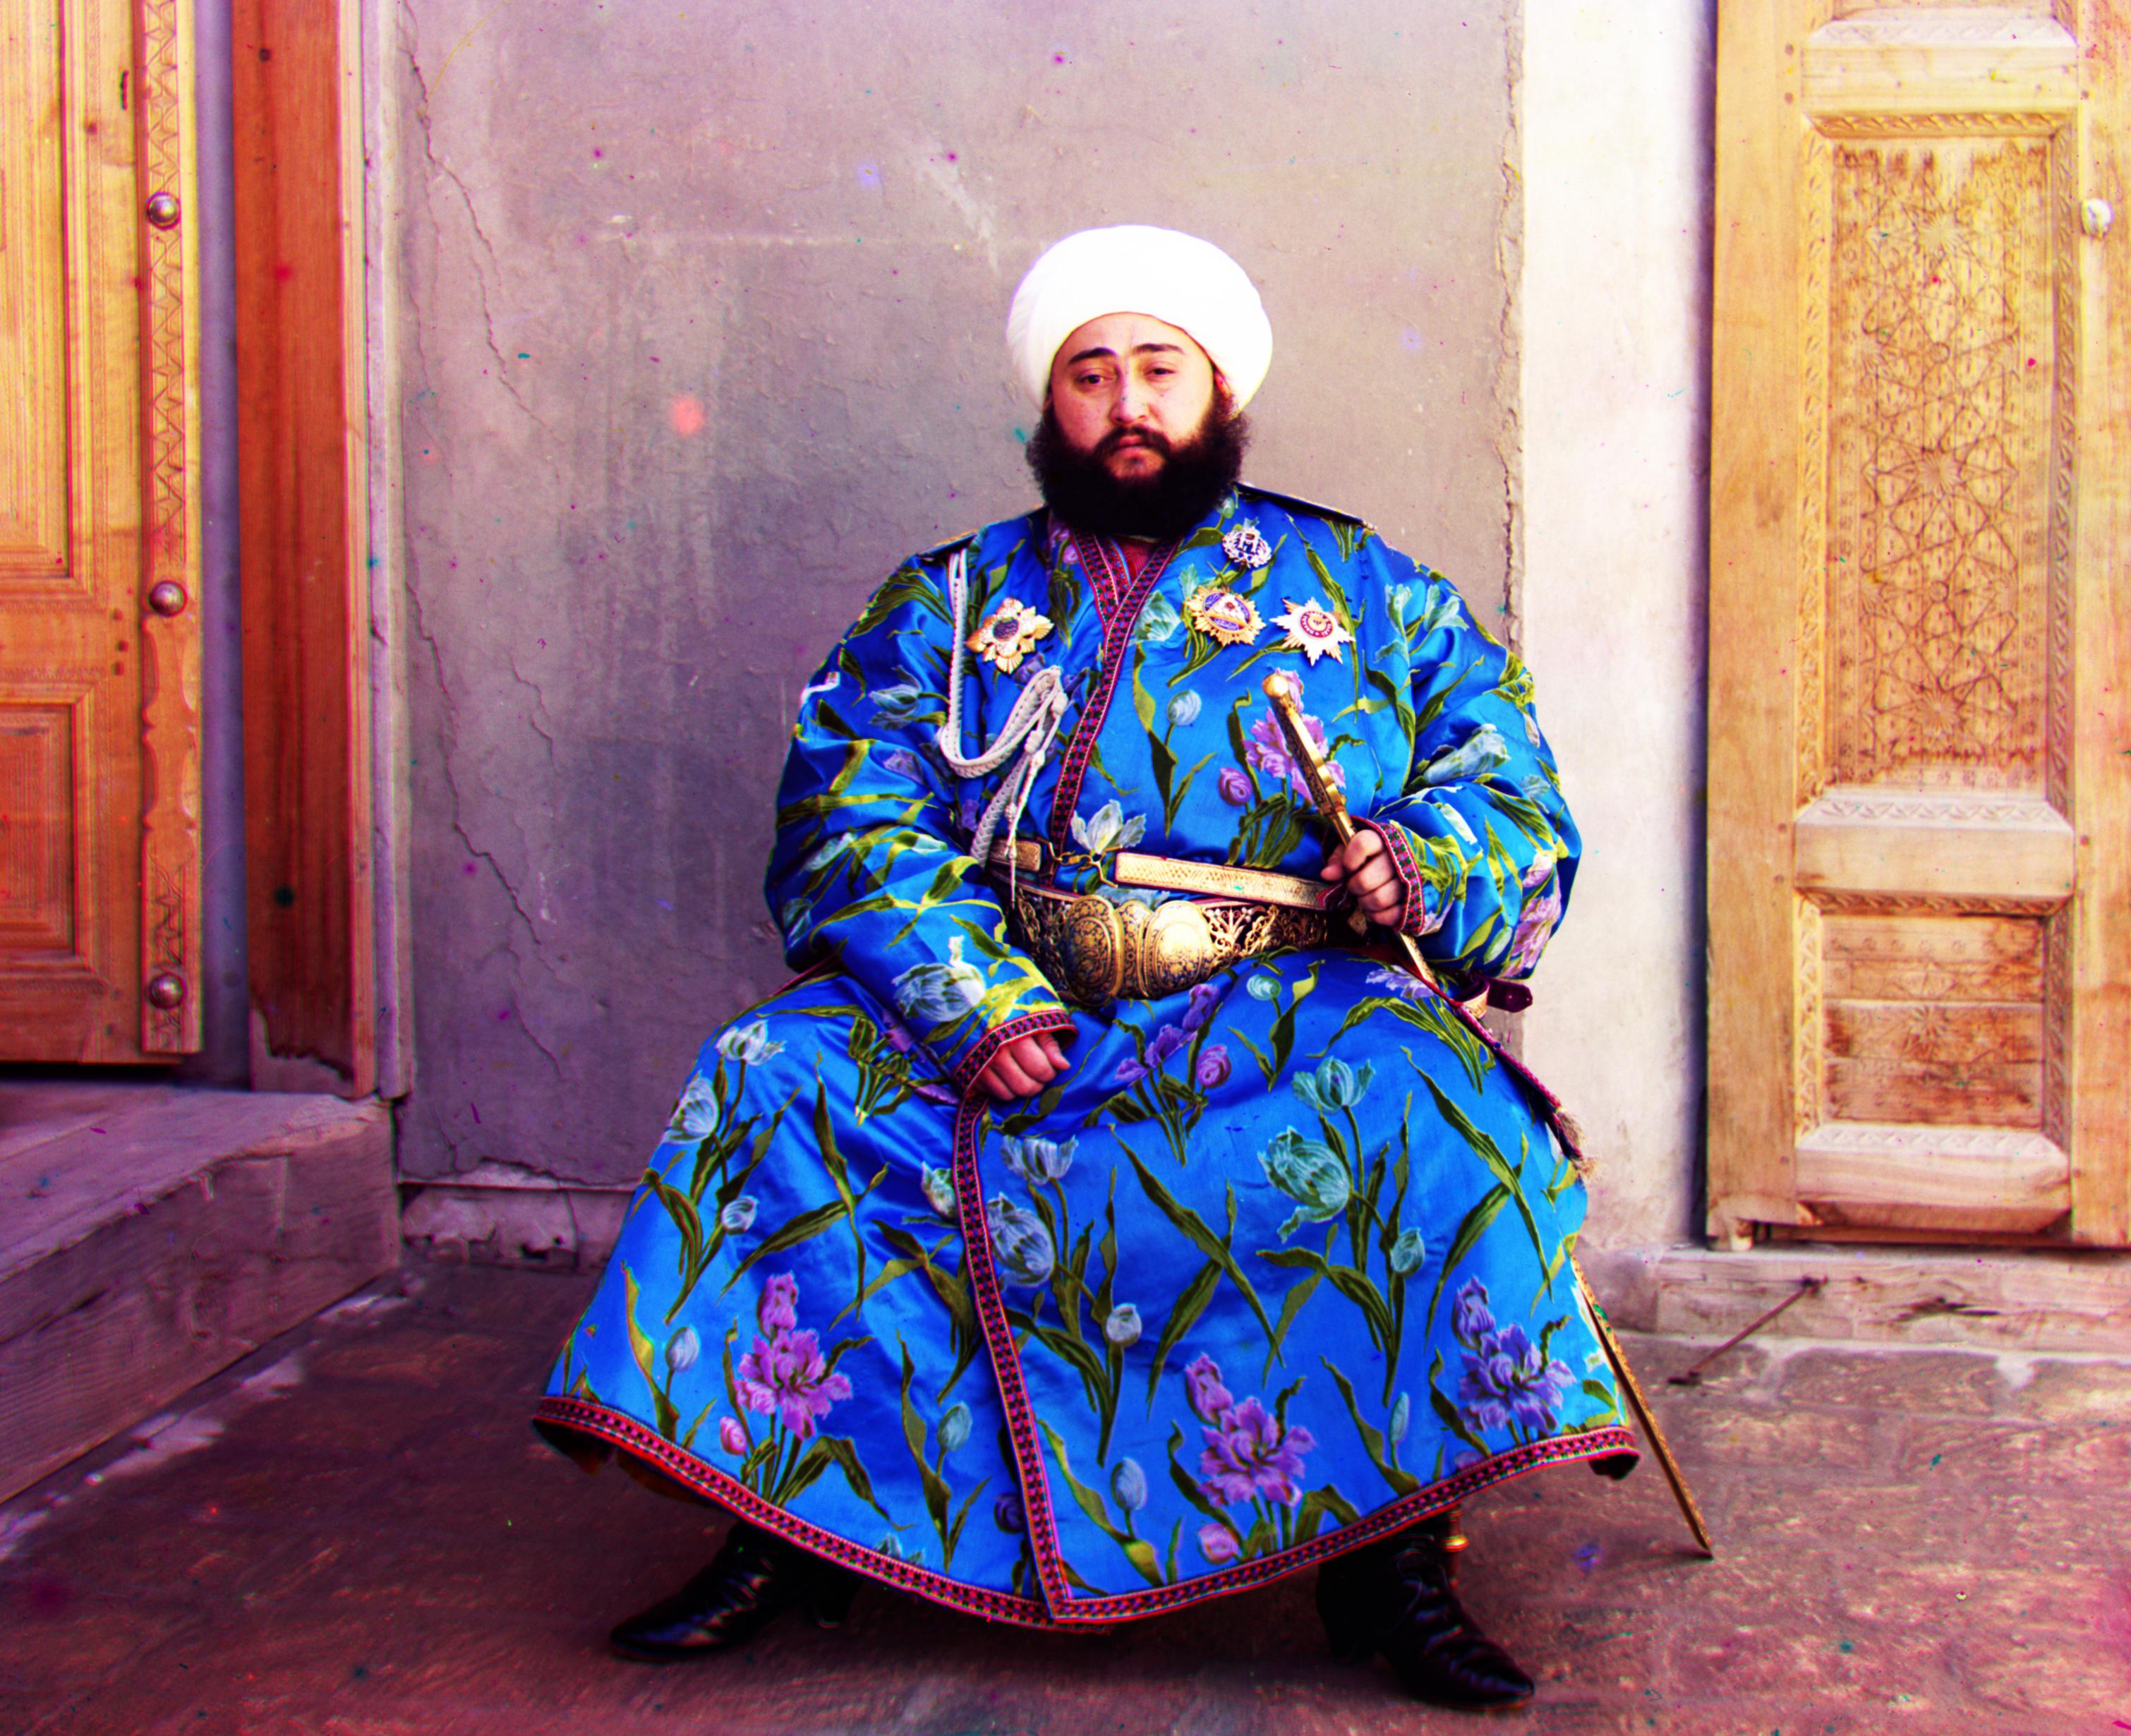
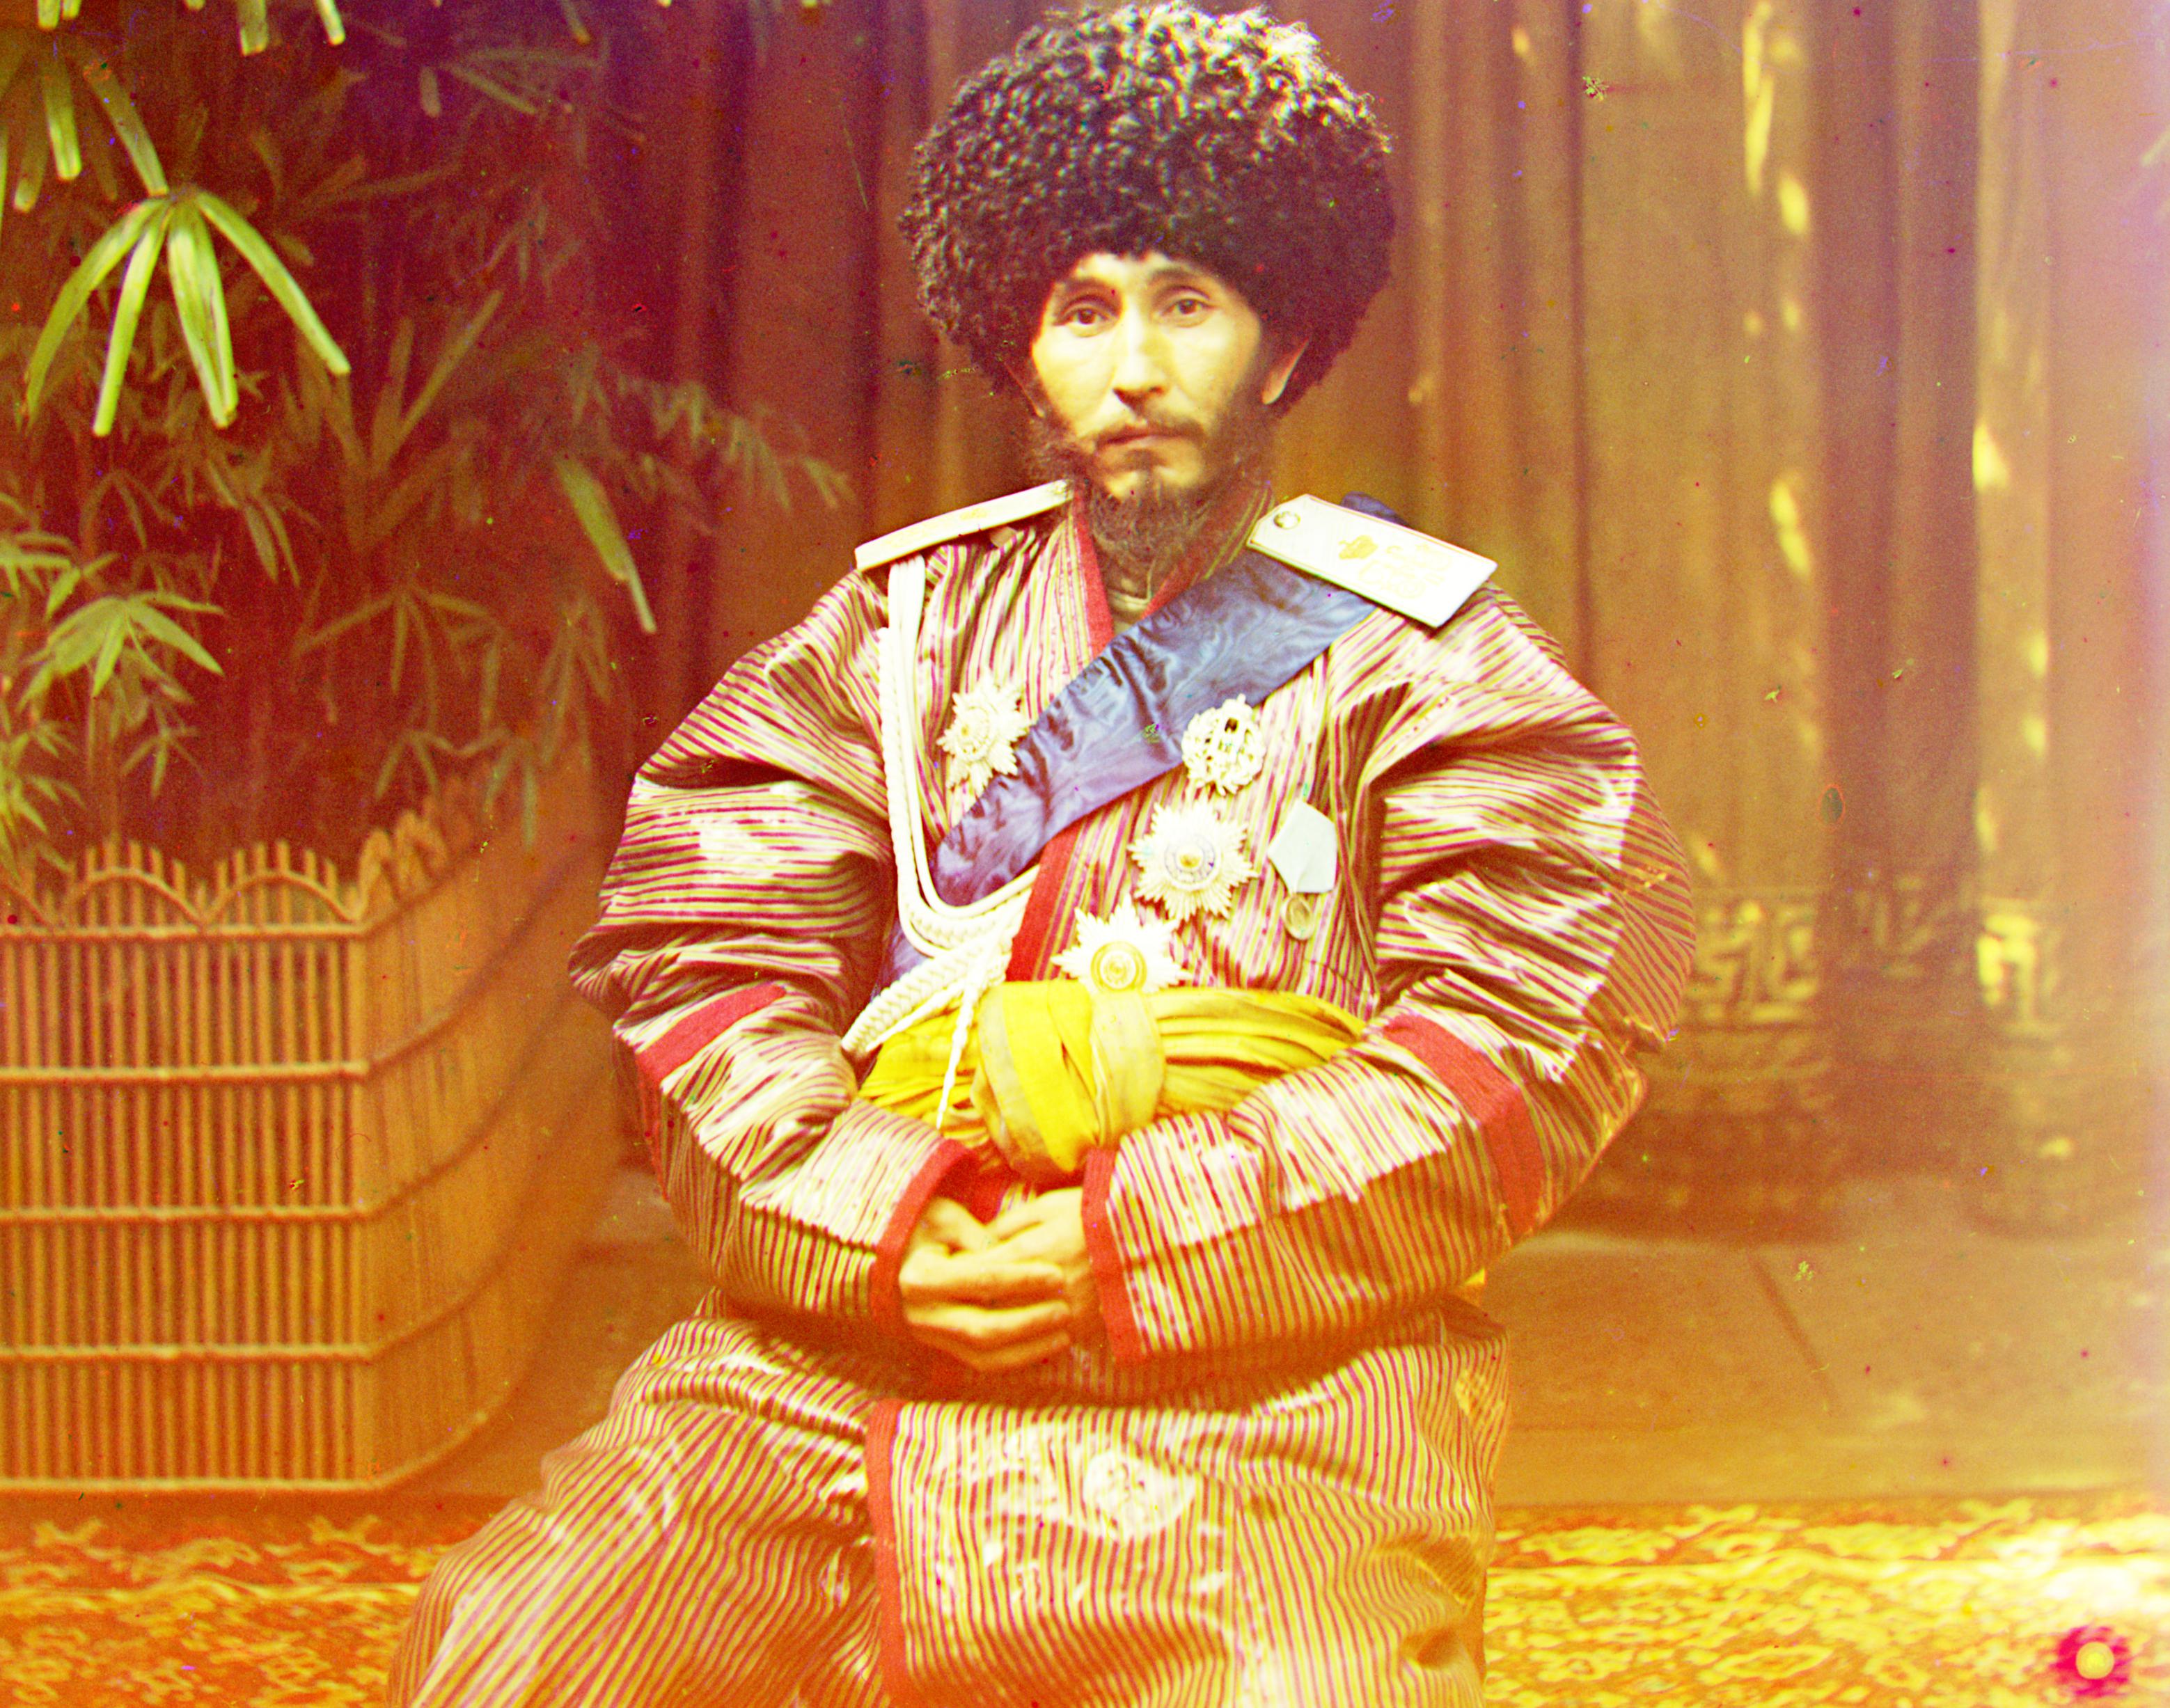
However, in the case of Emir, the improved feature detection helps us a lot. Here is the result of our basic colorization:

Here is the result of our basic colorization with improved edge detection:
The improvement is quite large. This is likely due to the lack of similarity between brightness across the three channels in Emir's original photos which would lead to a large SSD even if the image is properly aligned.
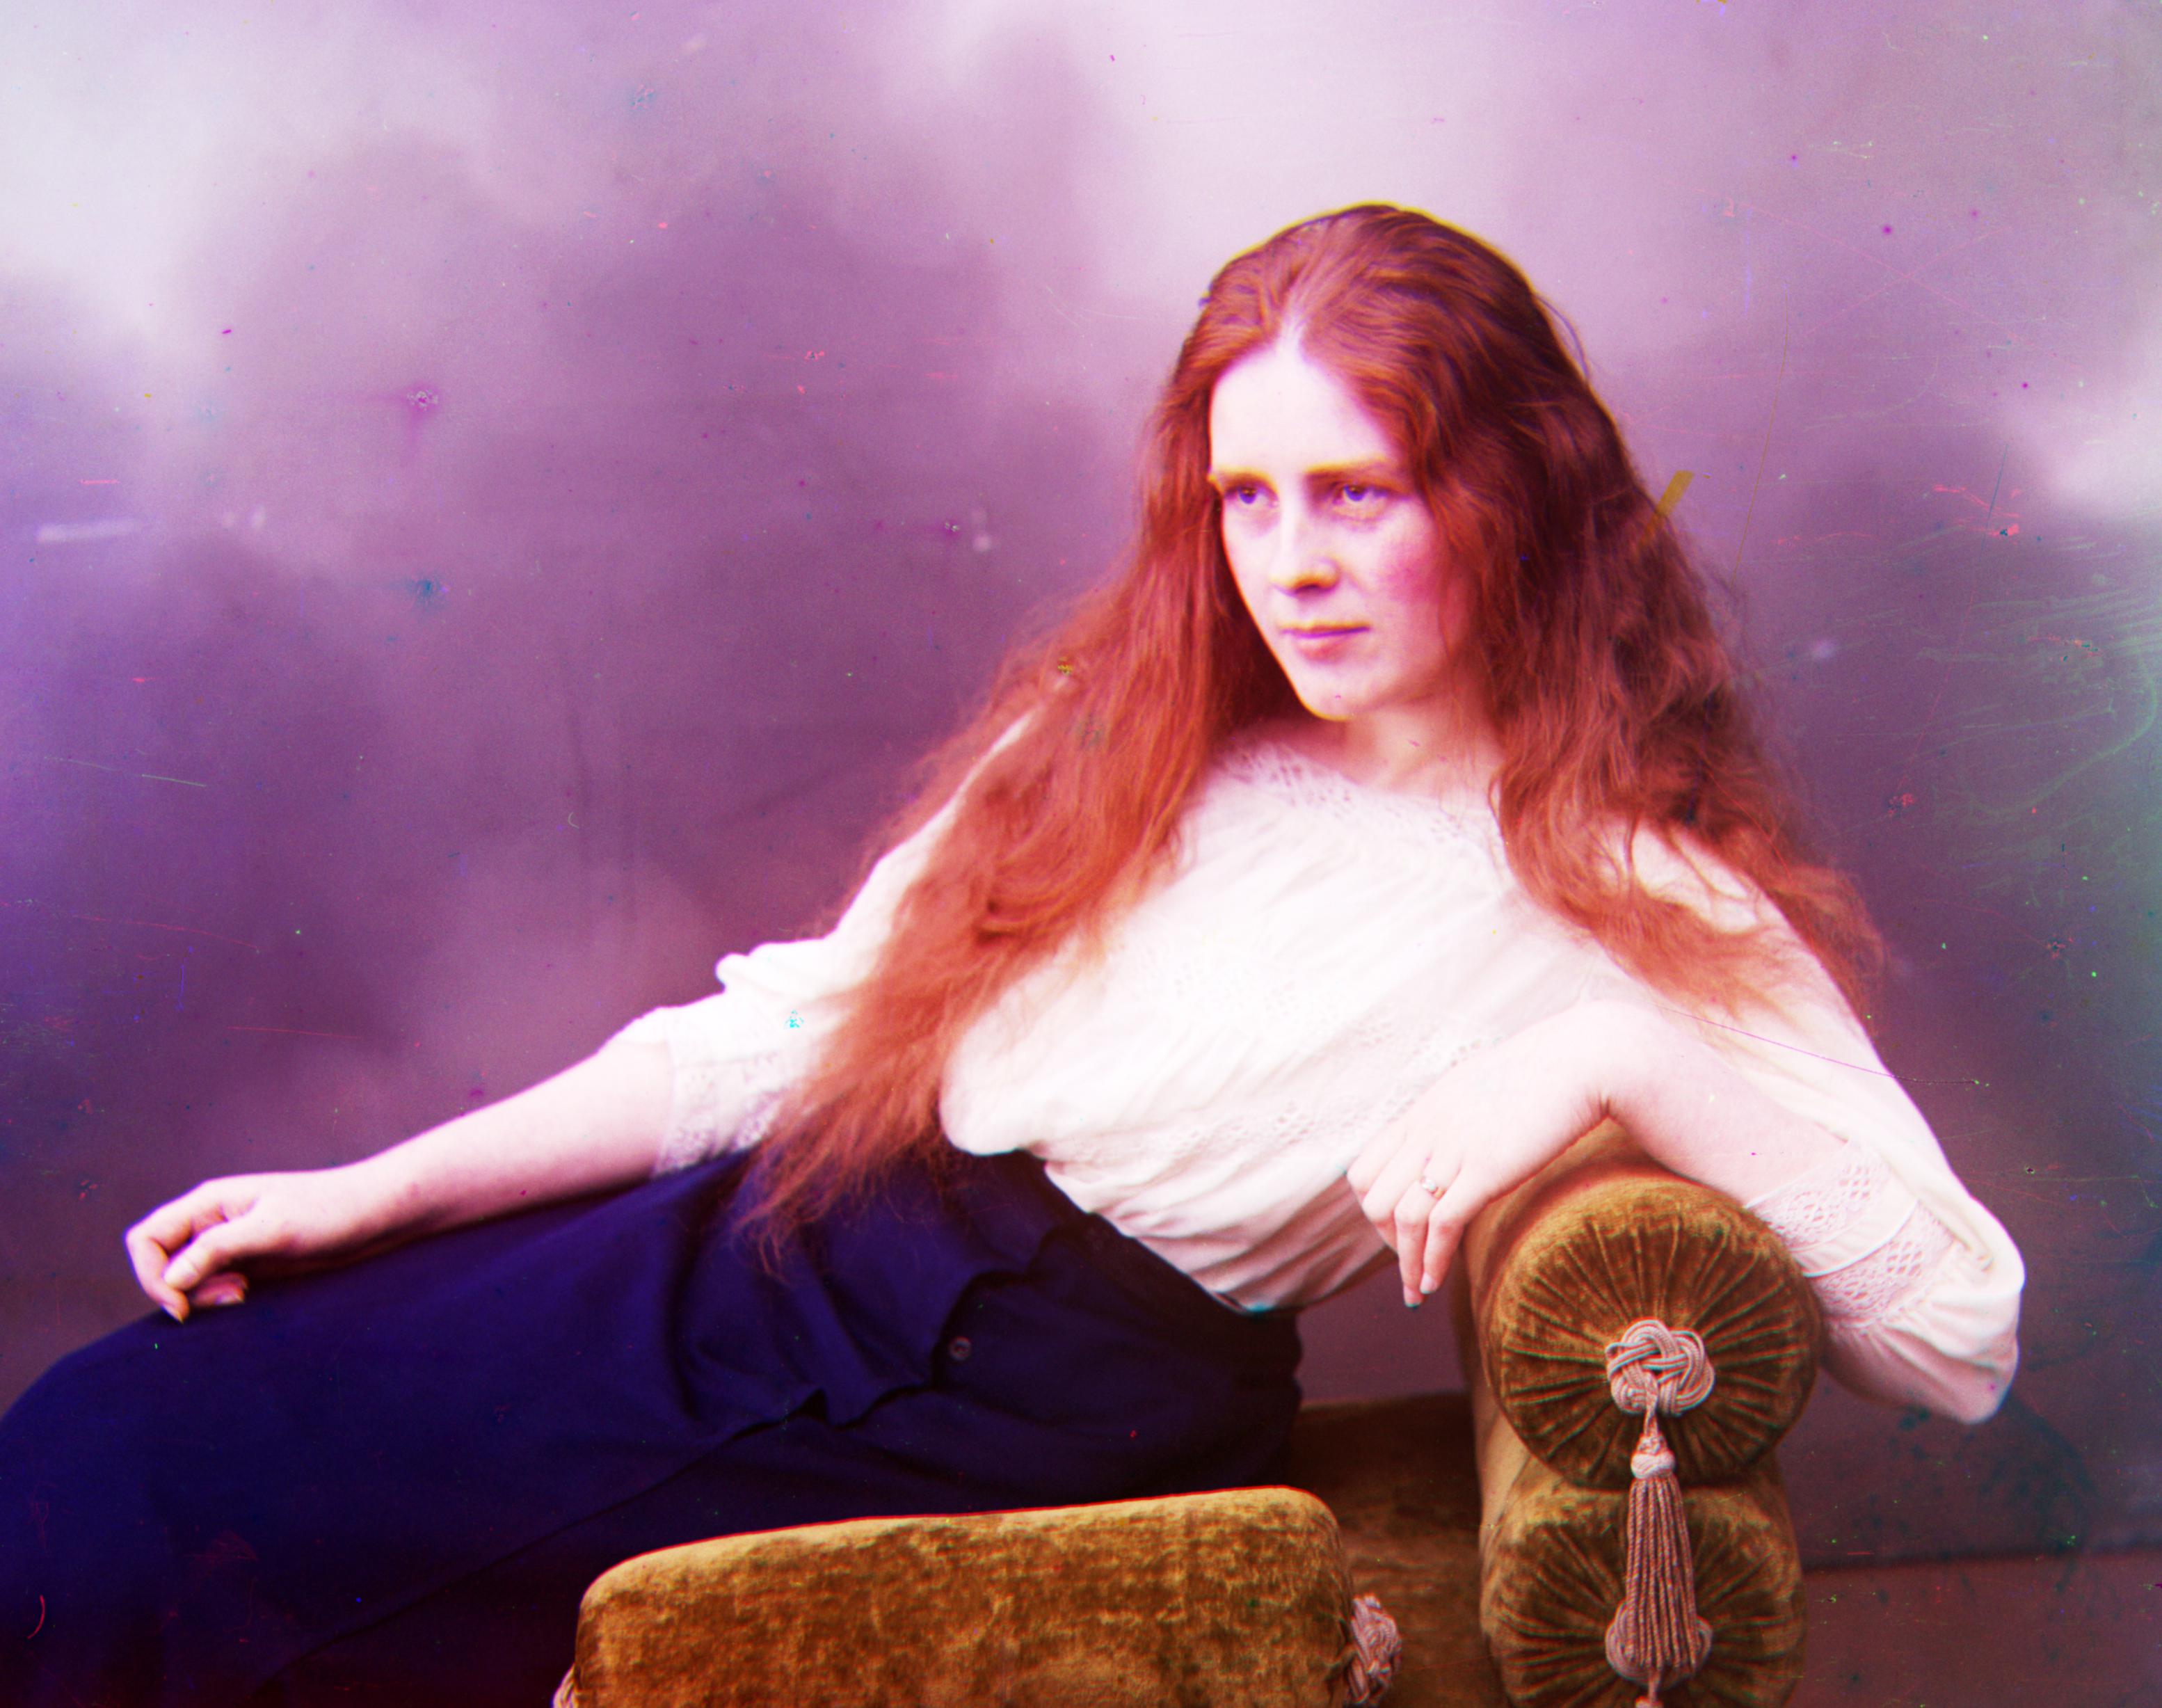
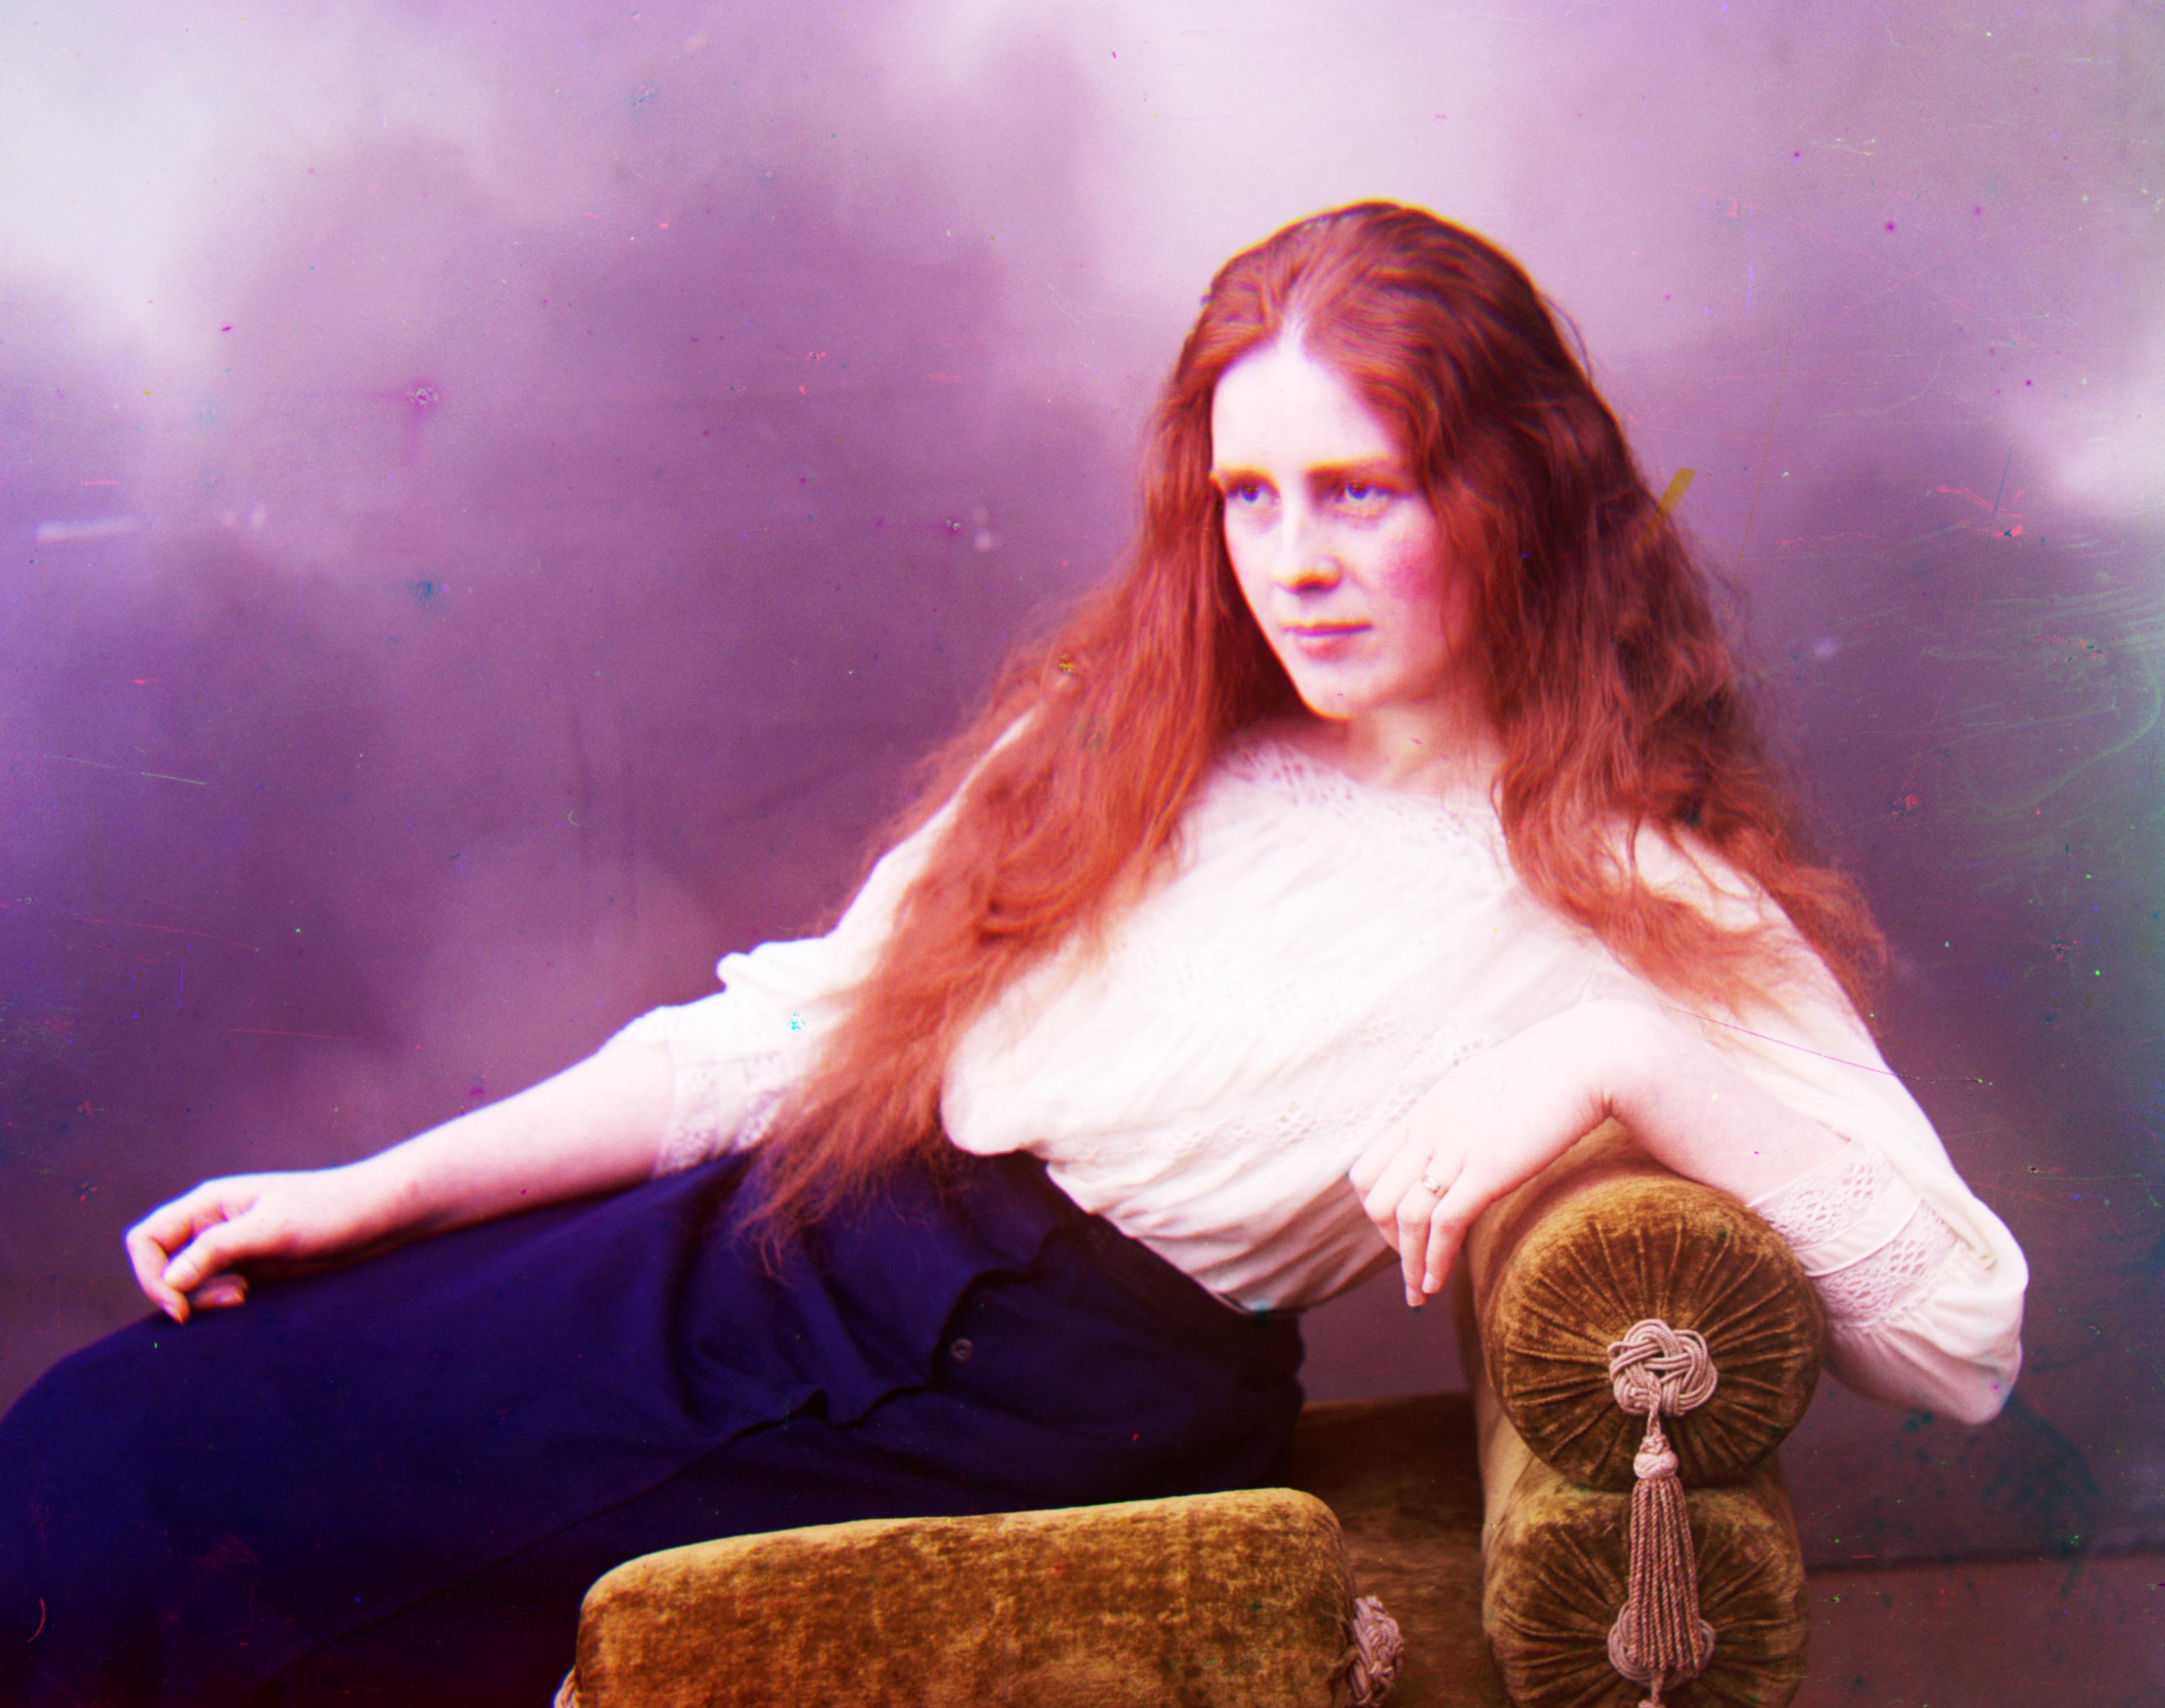
Here, Emir's clothes have completely different brightnesses across the three images, so edge detection vastly improves the result, while the Lady's clothes (and most everything else) look about the same across each image in terms of brightness, so edge detection does not improve the output as much.
Improved Contrast
We also want to improve the contrast of the images. We do this by normalizing the image histrograms, i.e. we create a histogram of pixels' brightness levels, create a cumulative histogram from this, and normalize it so that each pixel is mapped to a new brightness according the the CDF of the cumulative histogram. Through this, the darkest pixel should have near-0 brightness while the brightest pixel should have near-1 brightness (where brightness scales fom 0 to 1).
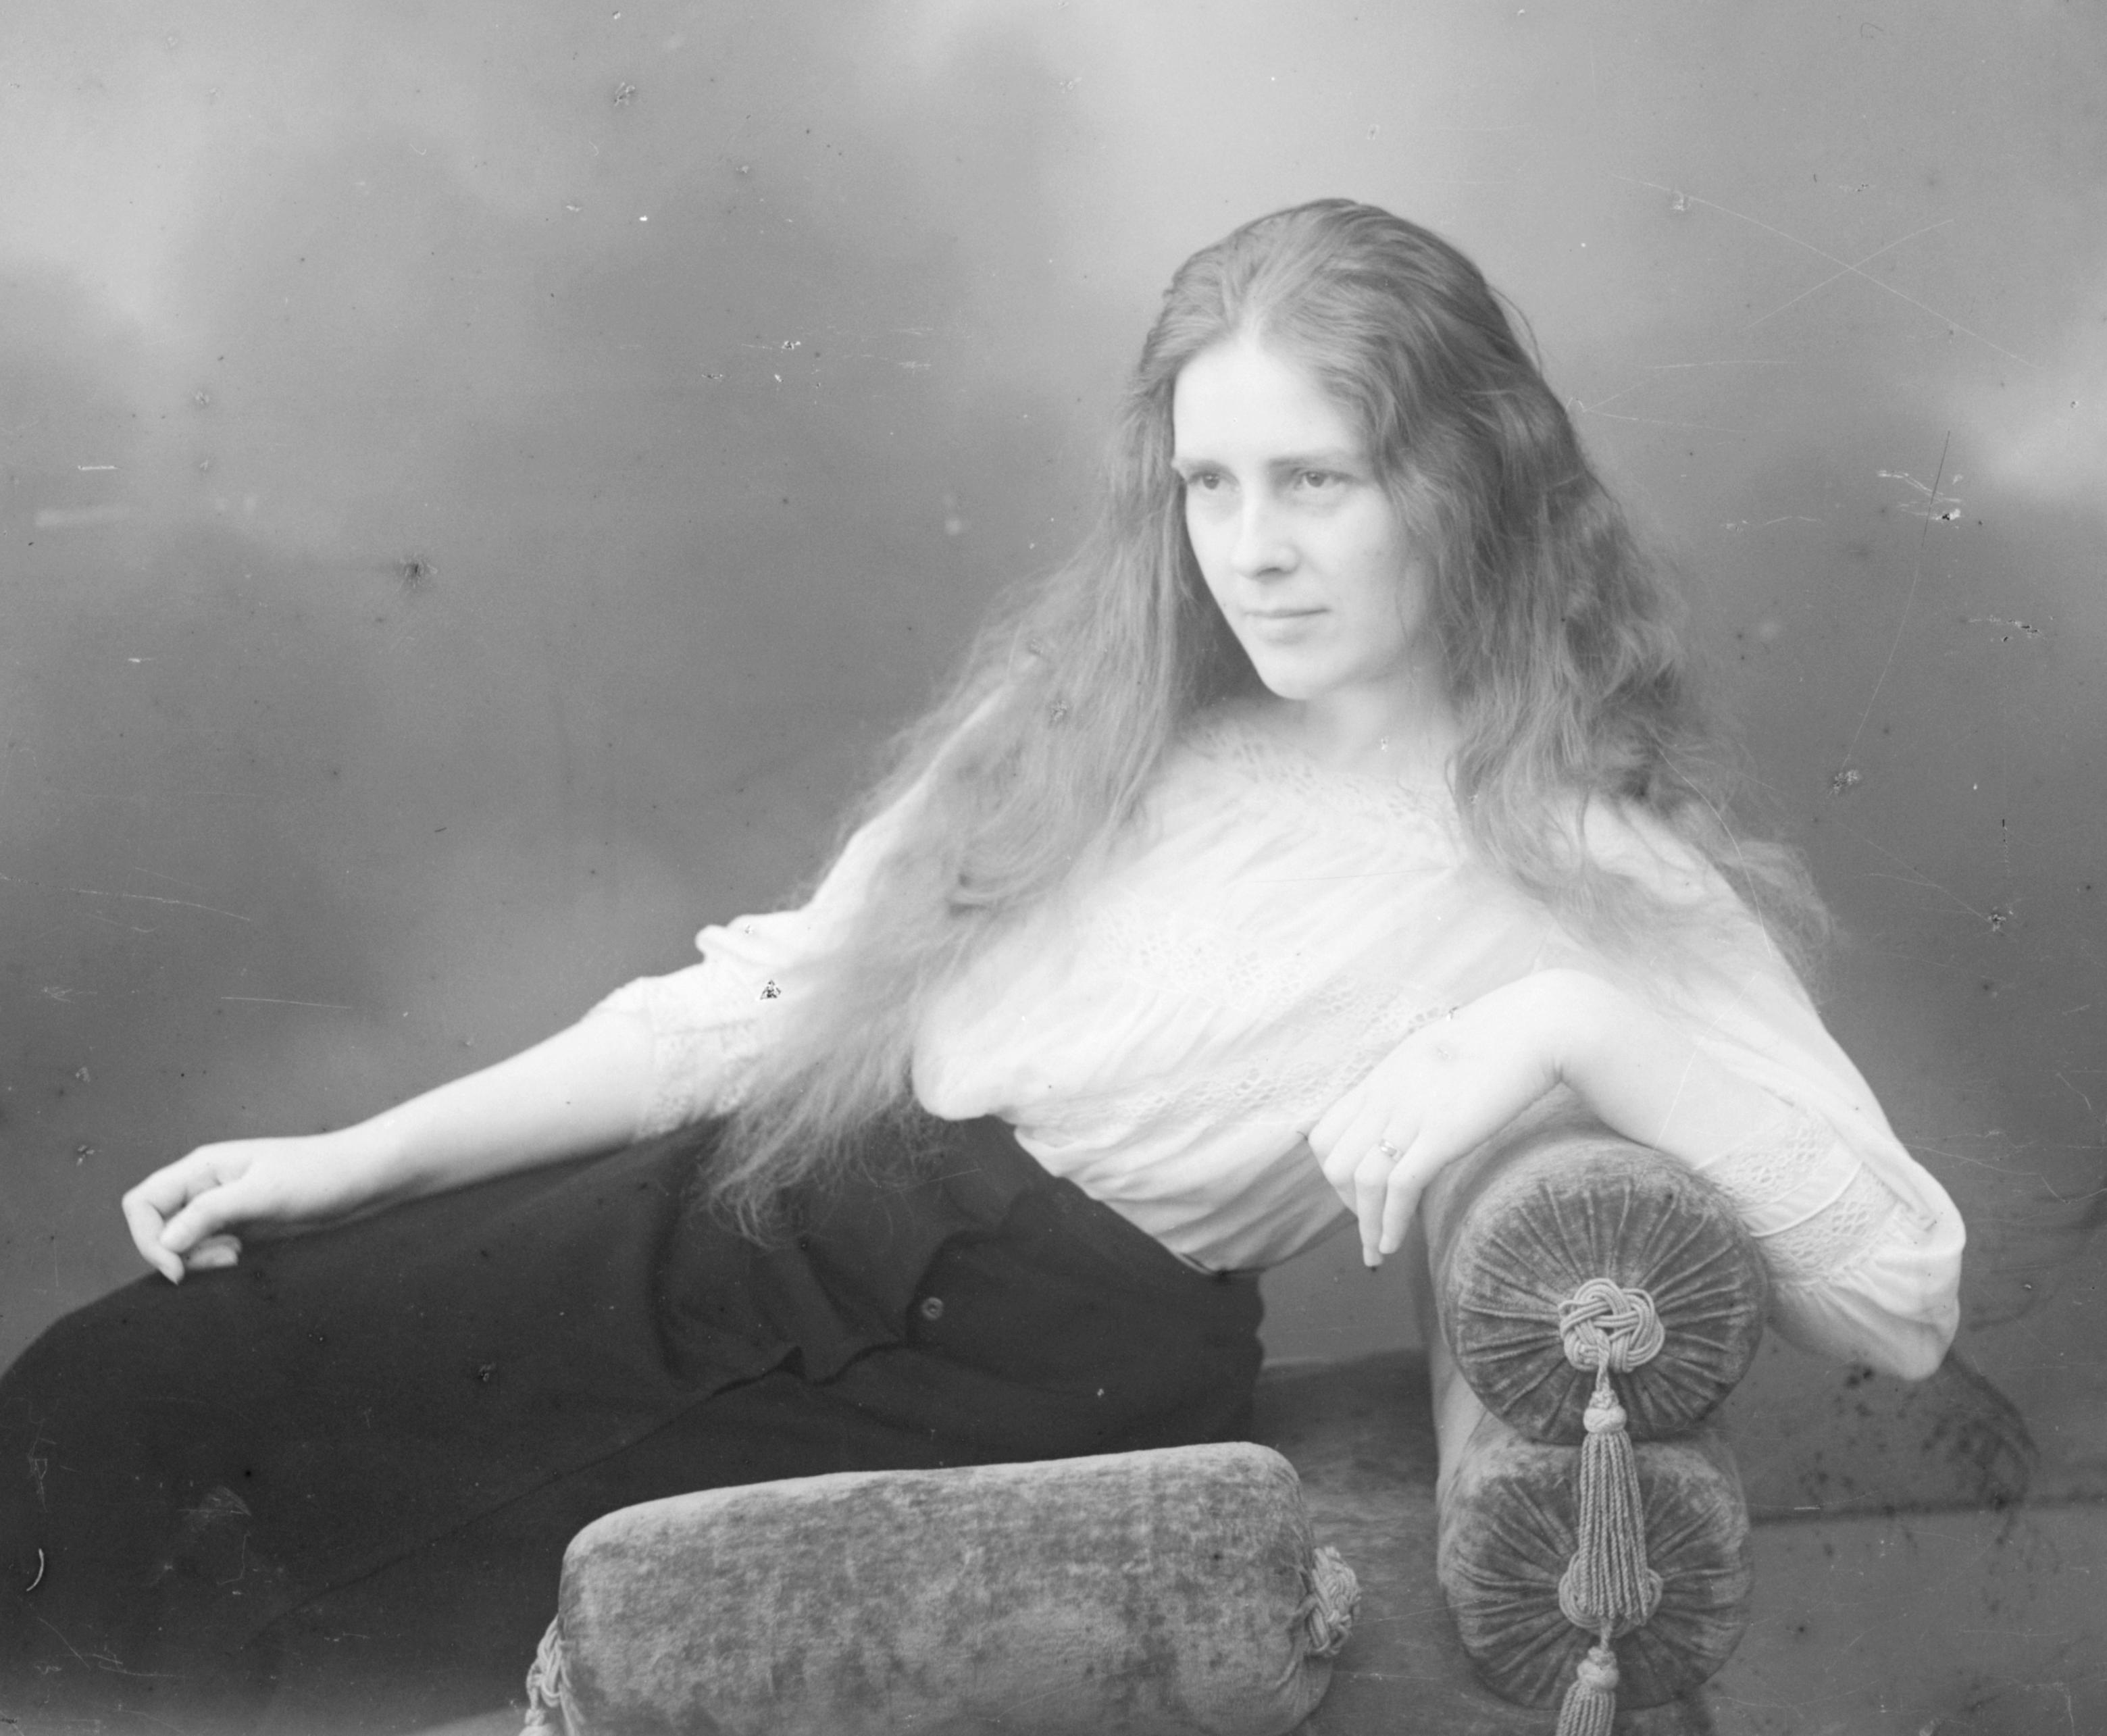
Lady, with the basic colorization:
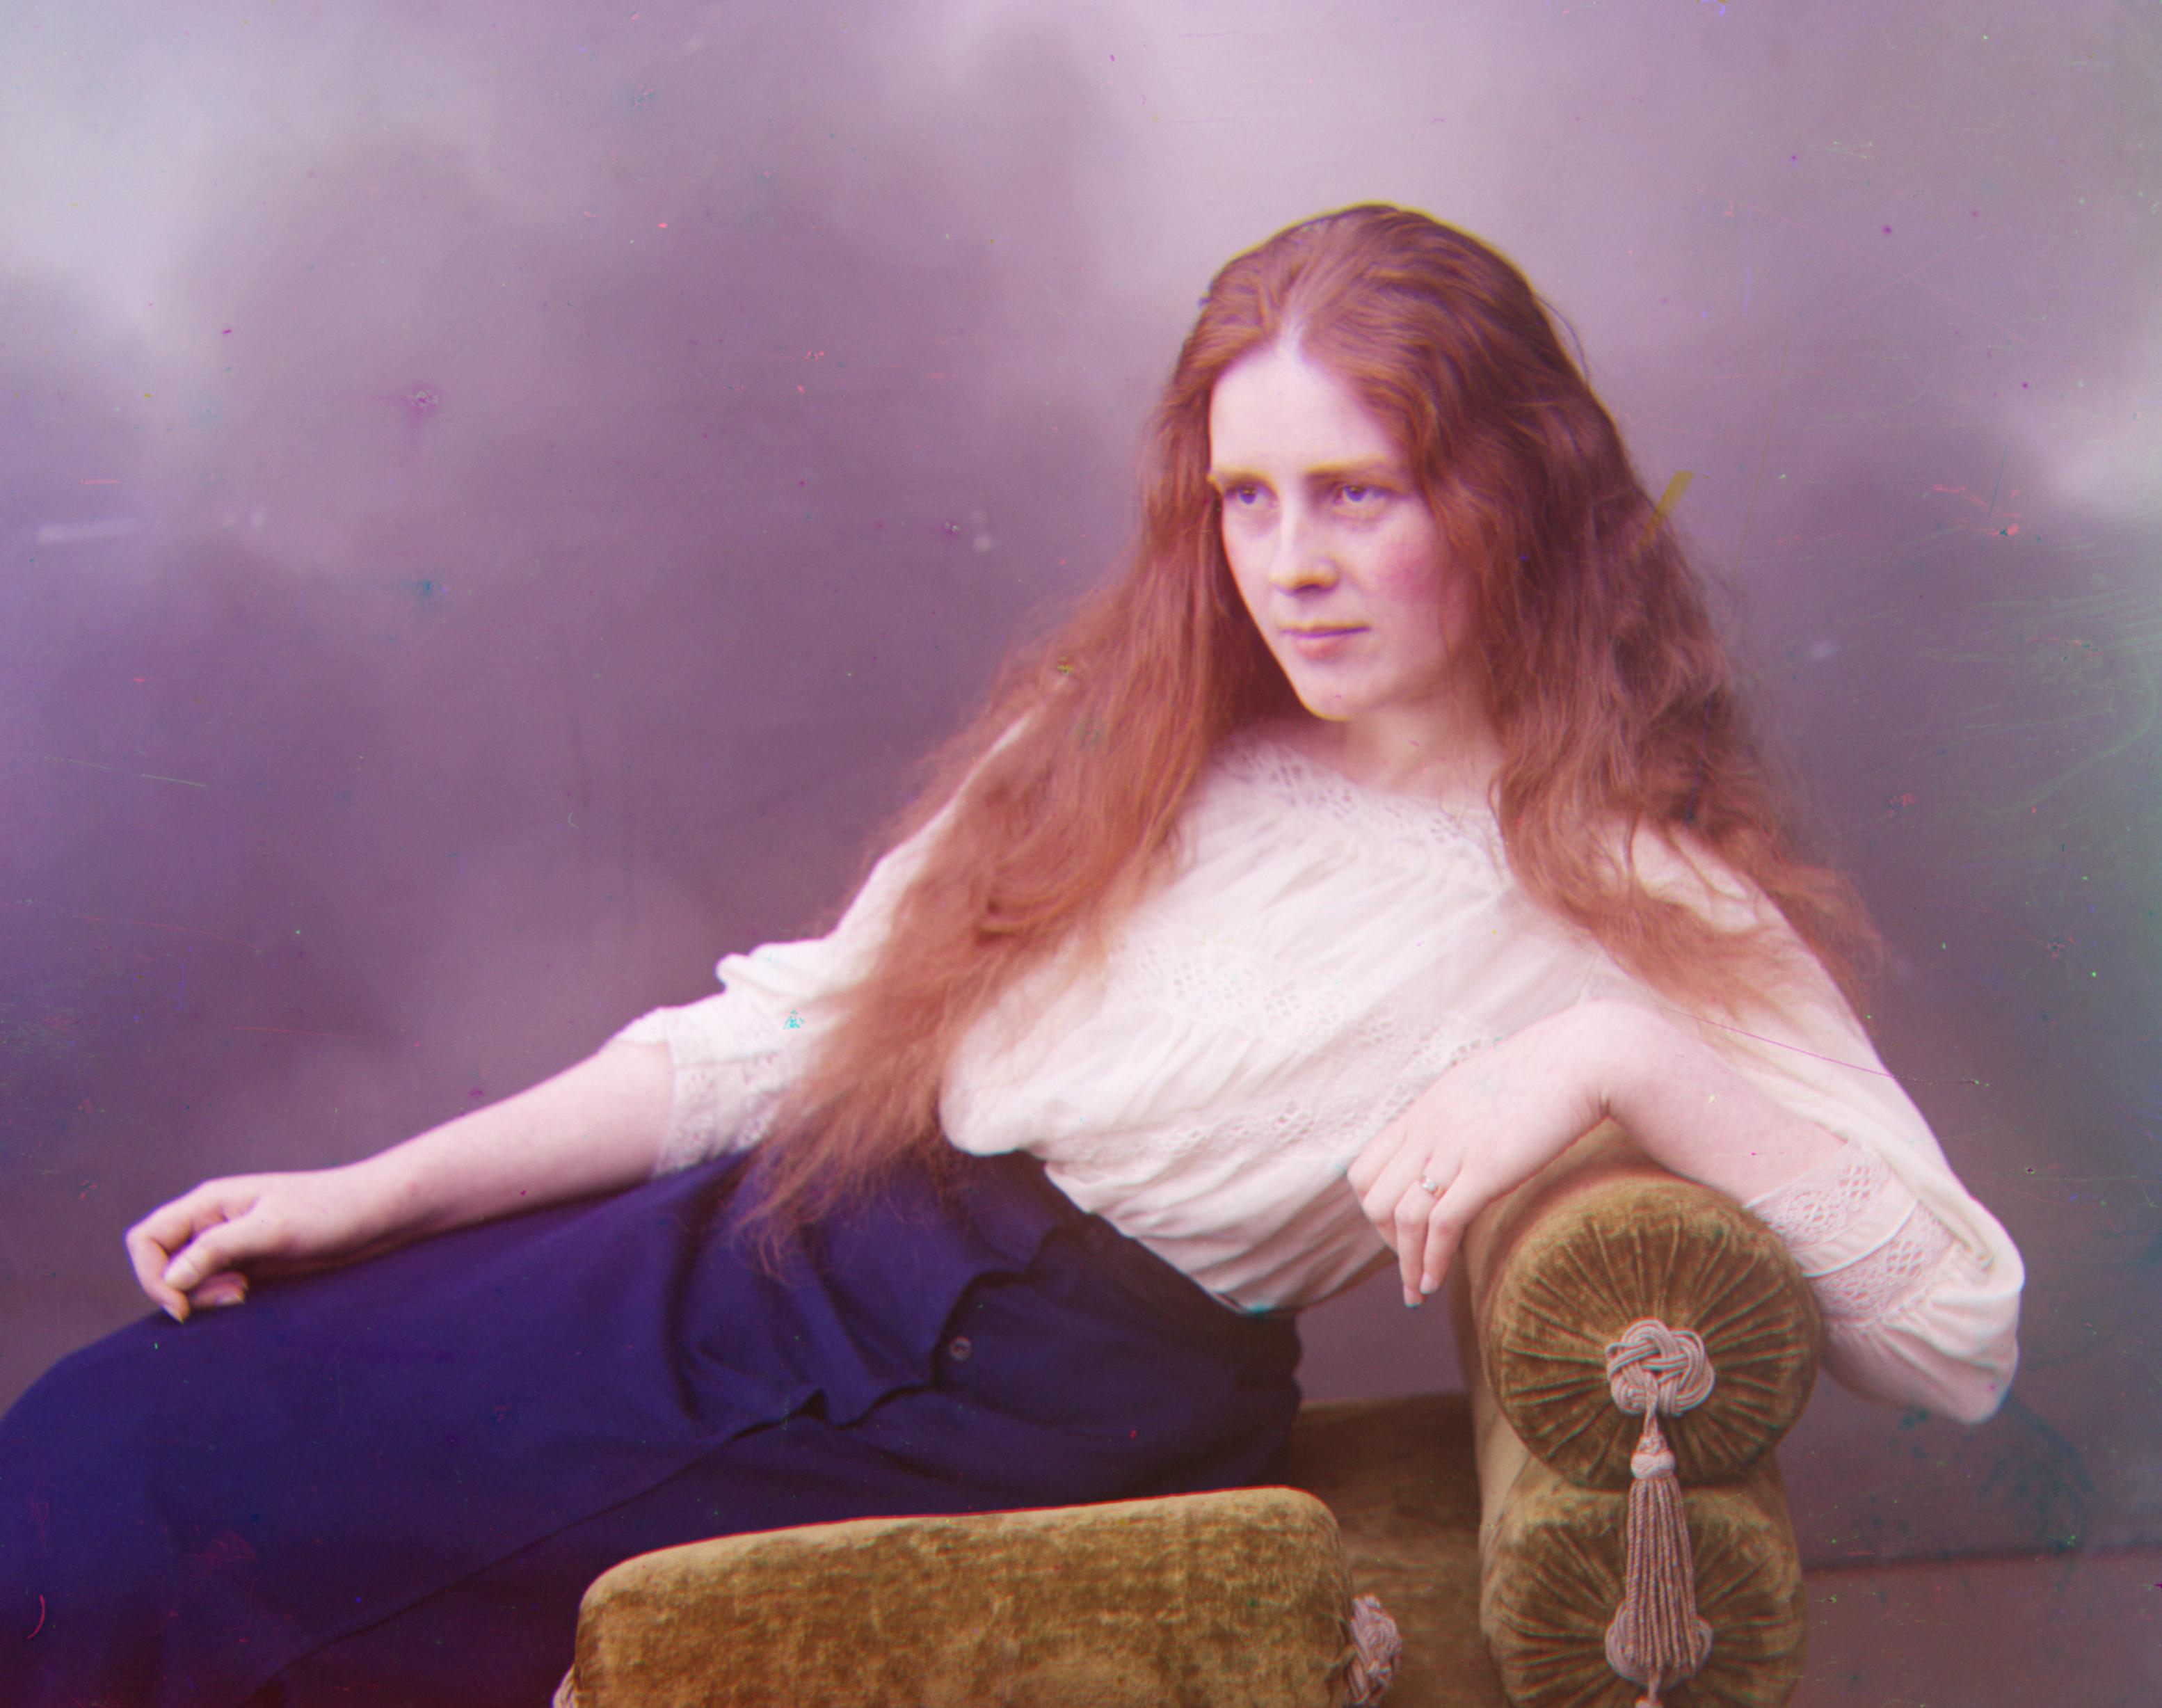
Lady, with improved contrast:
Emir, with only improved feature detection:
Emir, with improved feature detection and improved contrast:
Final Results
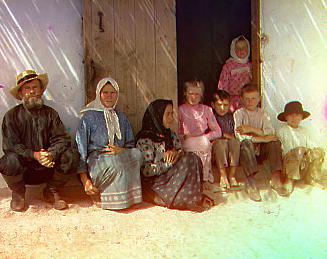
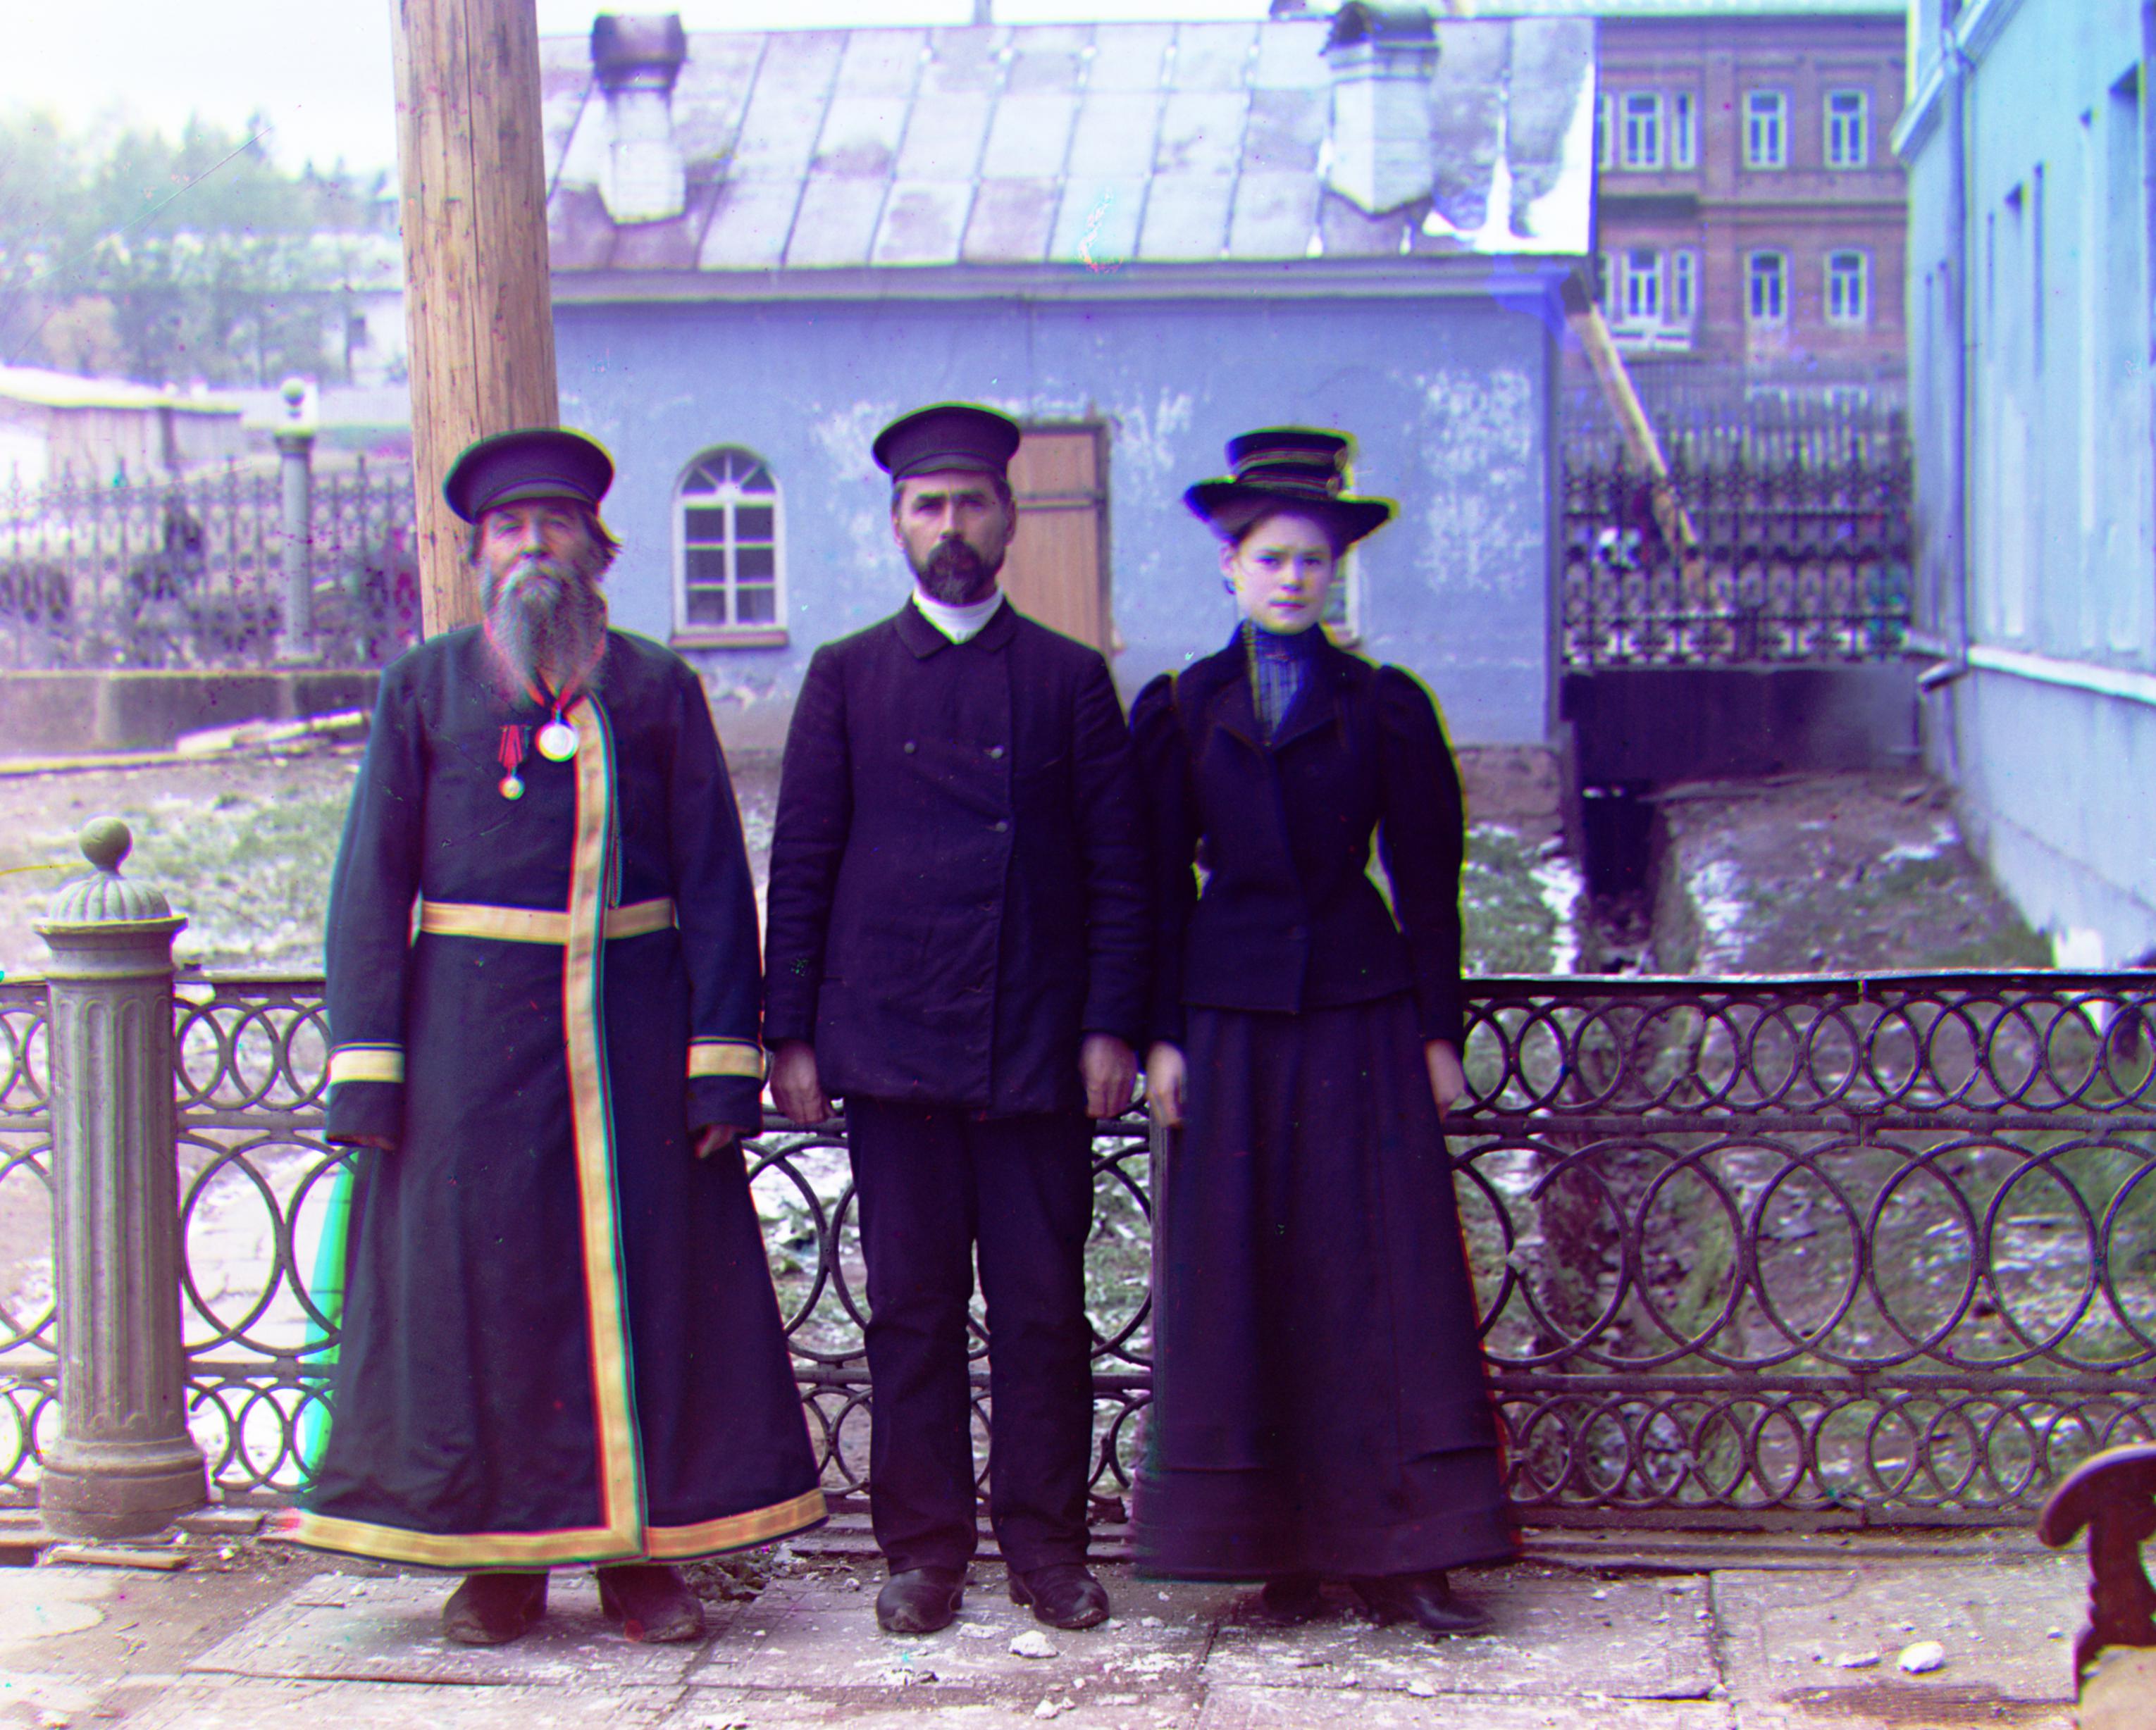
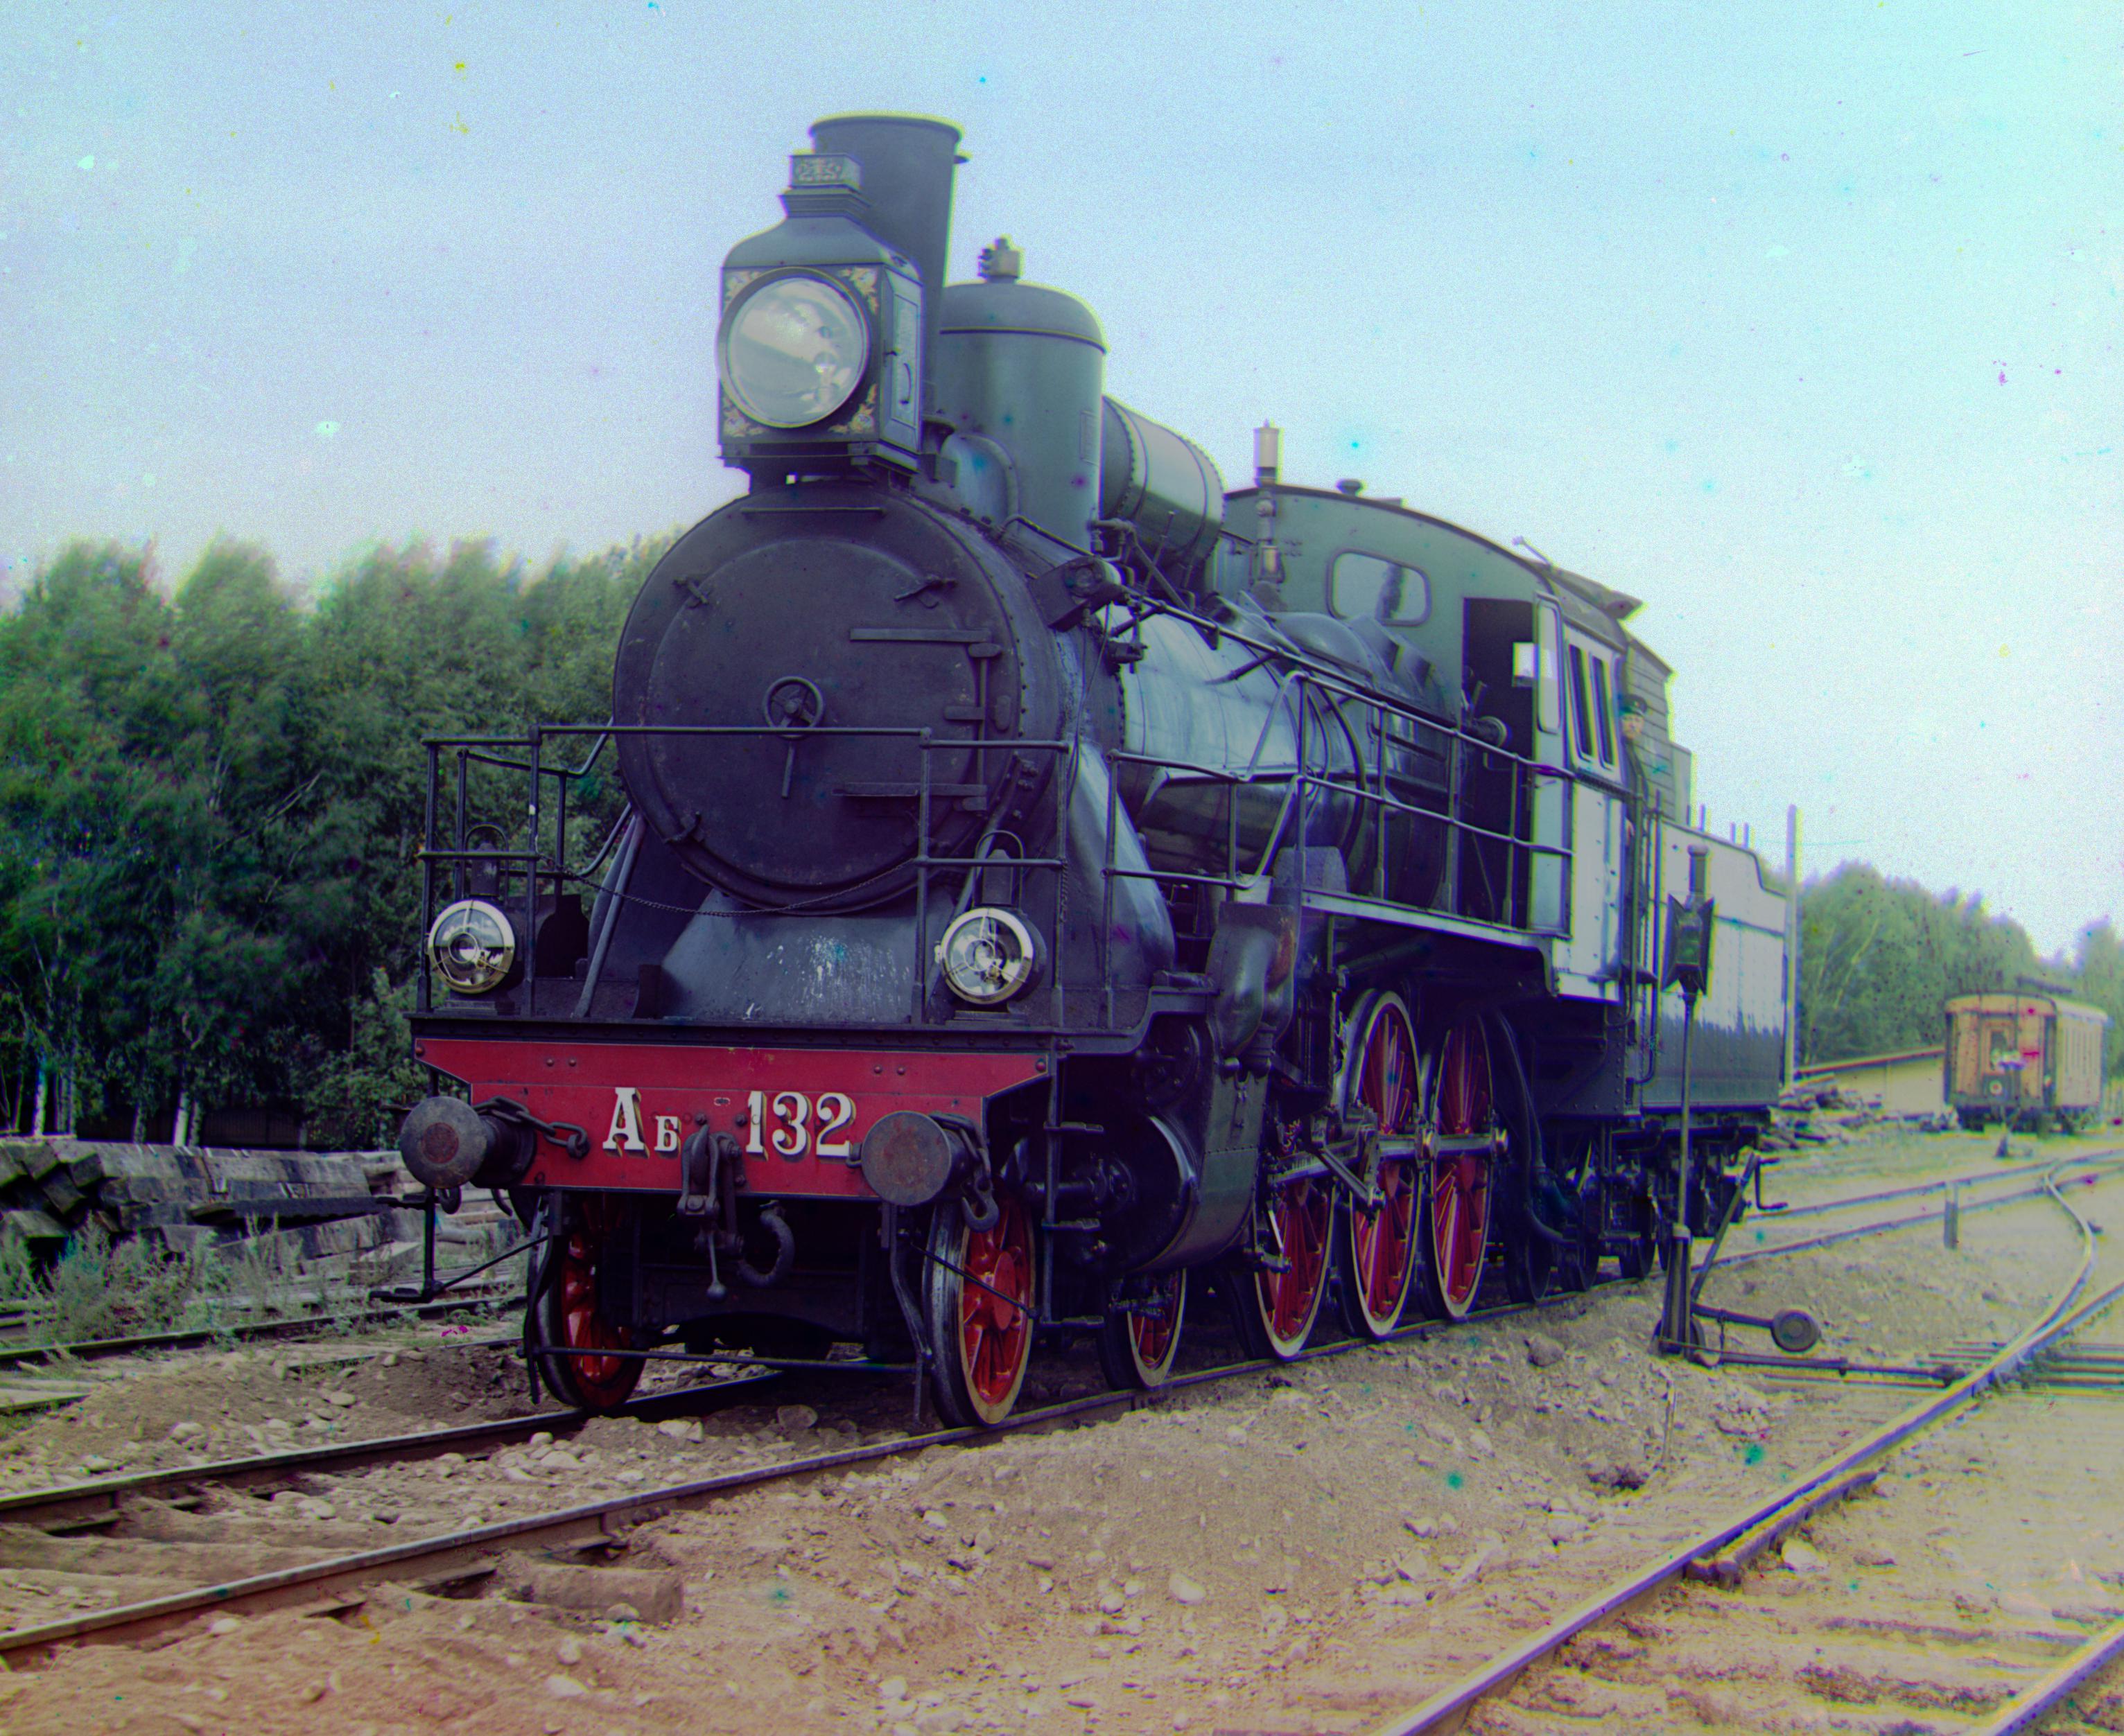
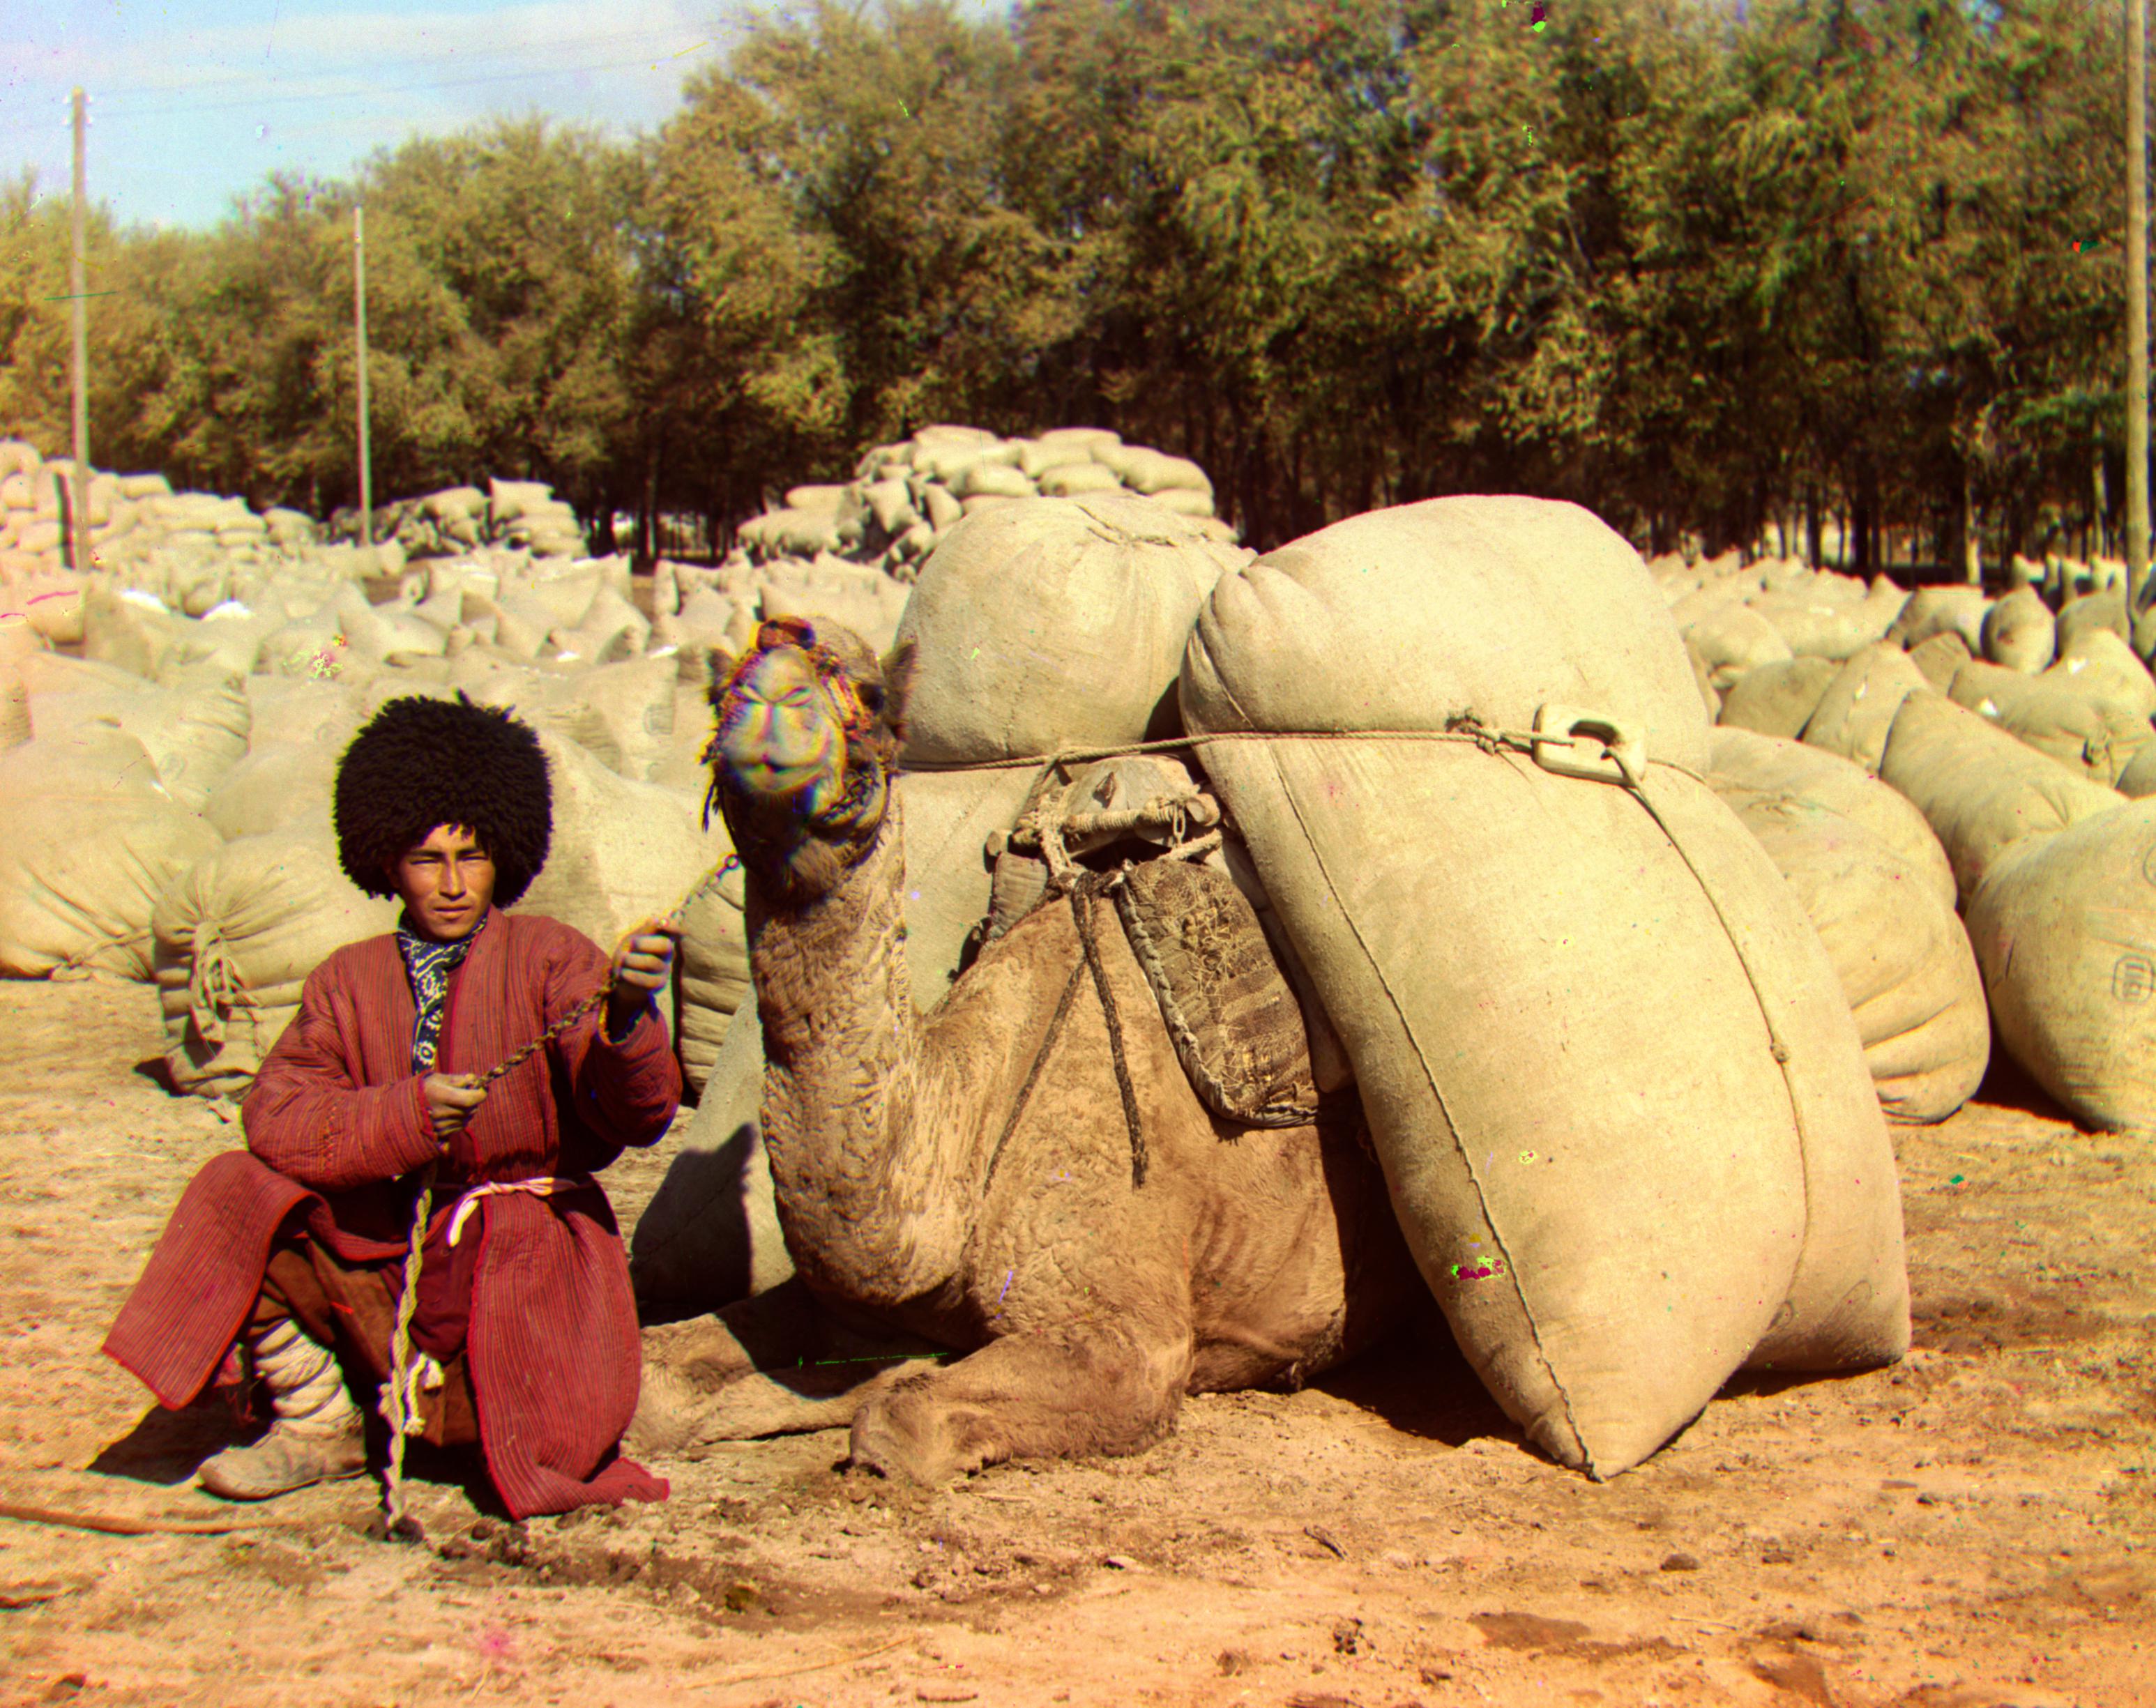
Example Images (with bells and whistles)

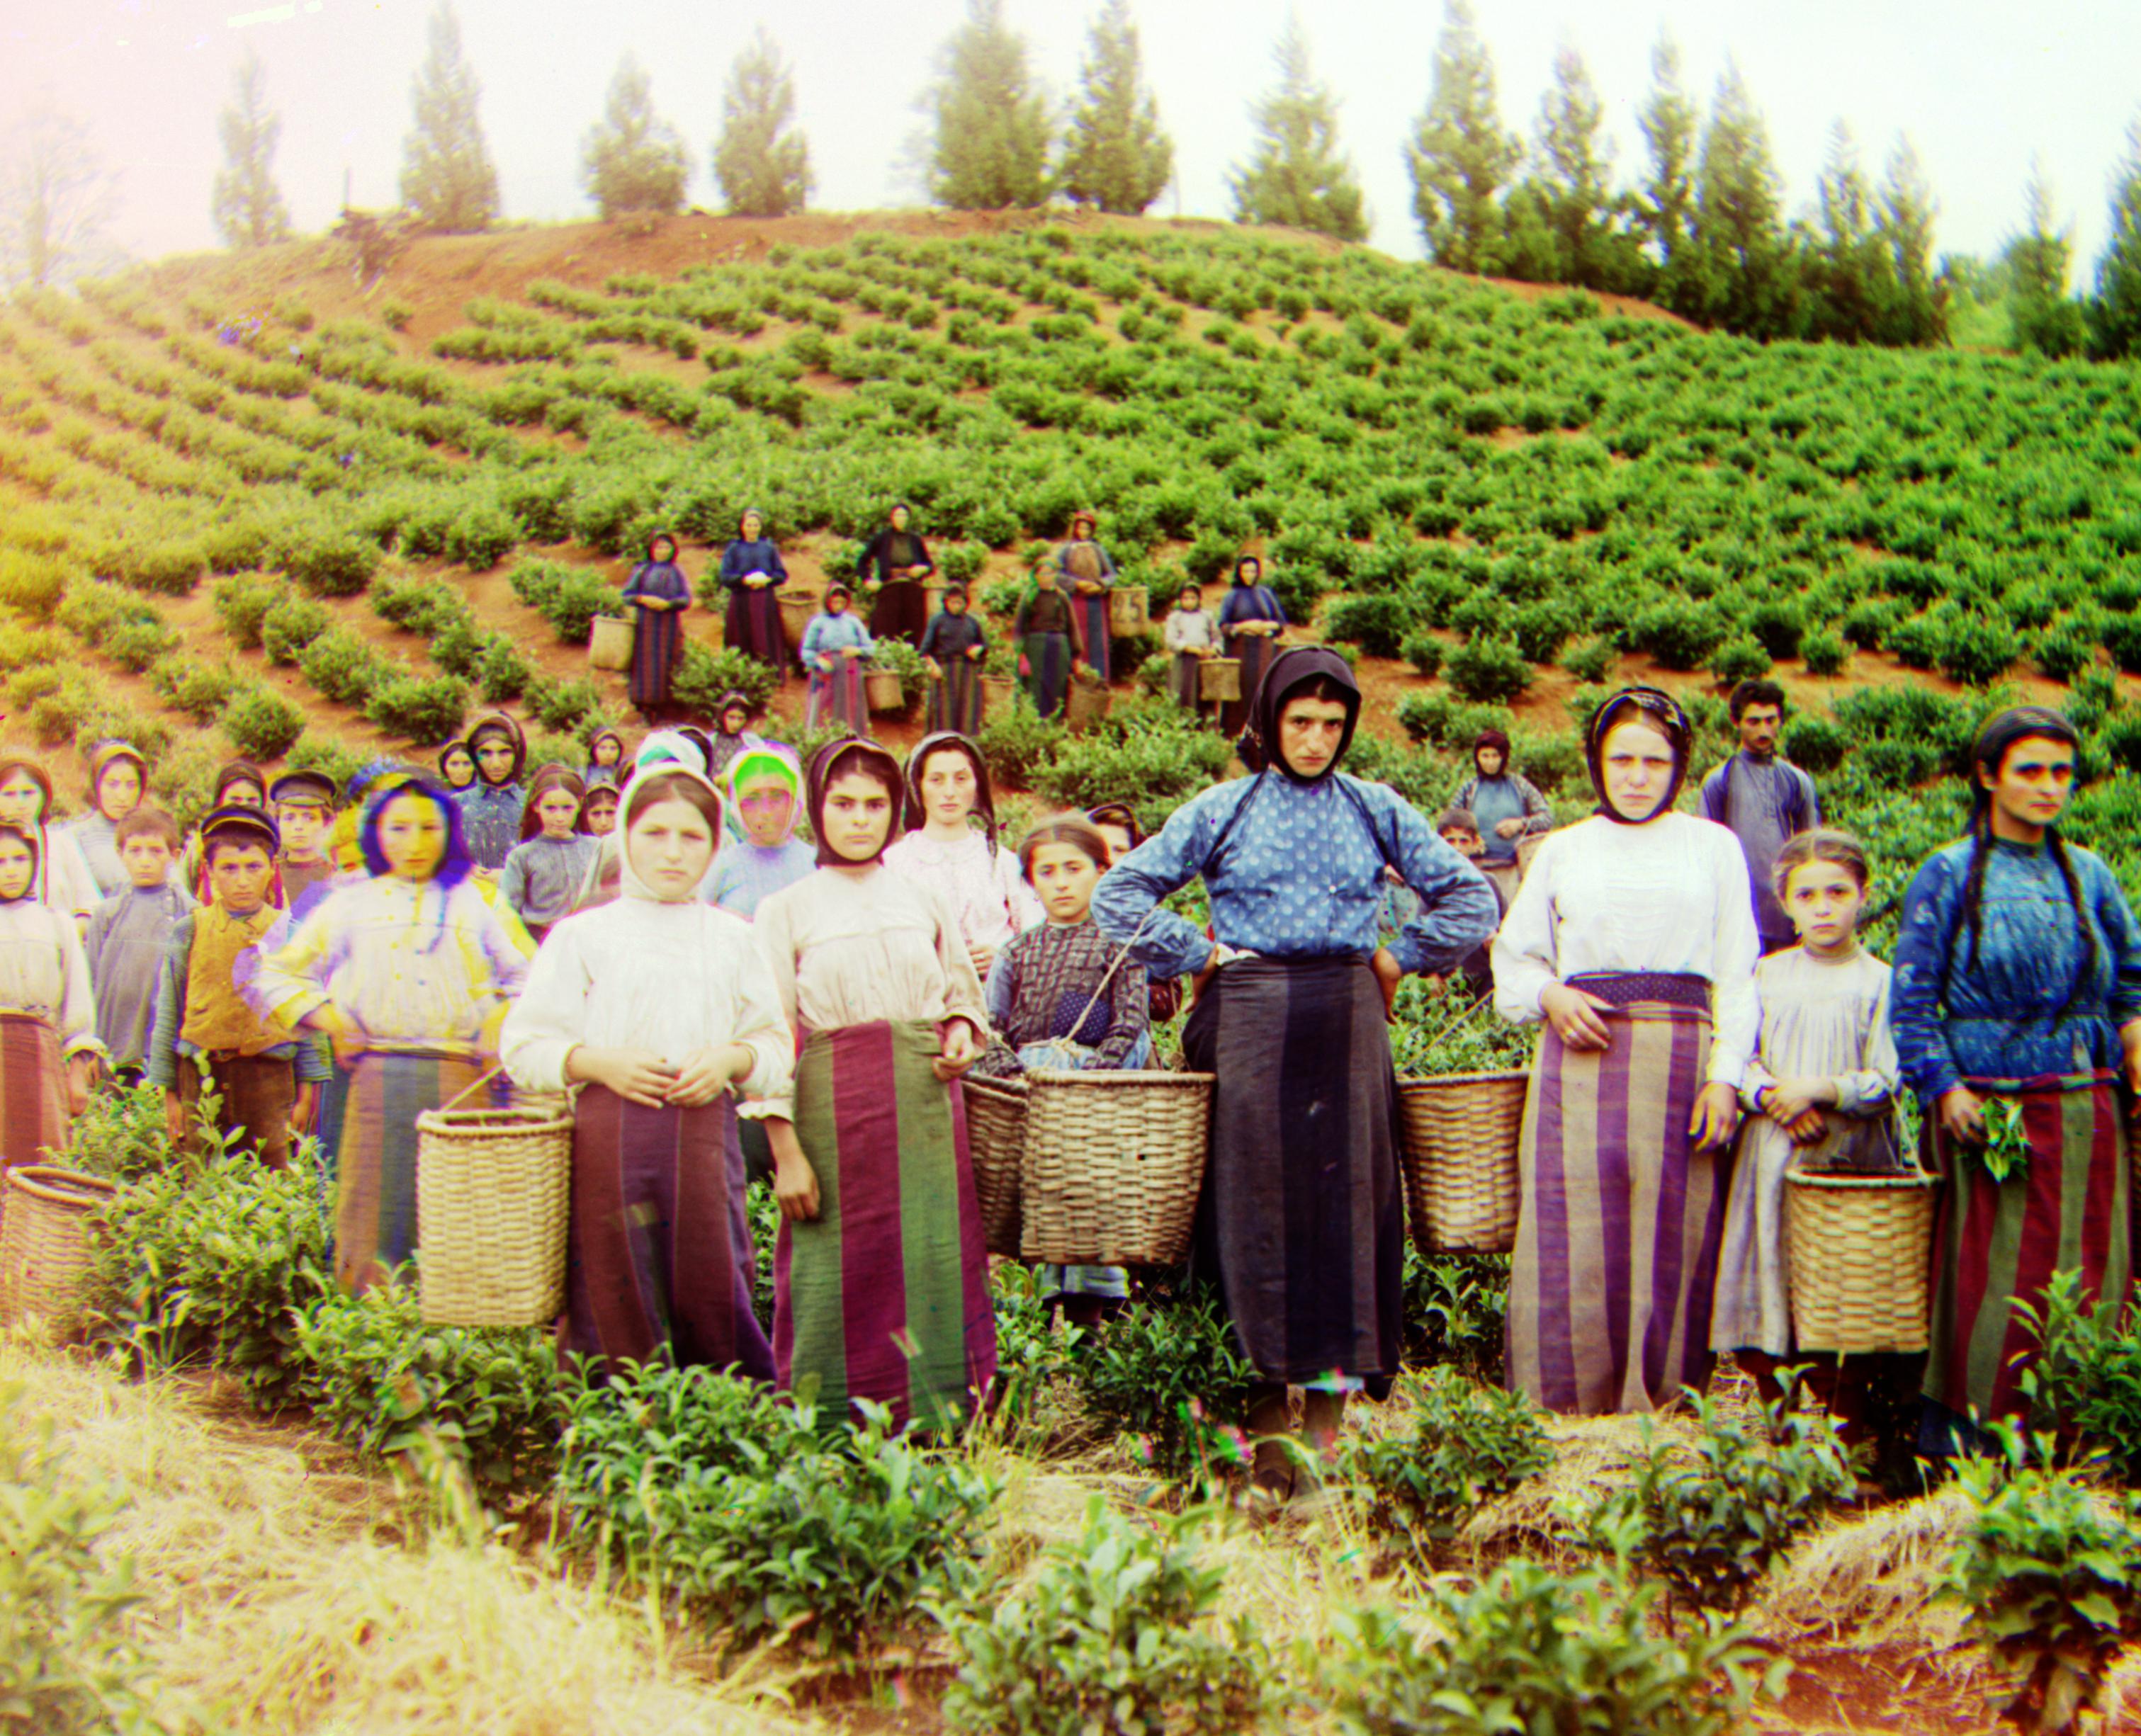
Note: some harvesters have very noticeable "auras" because they moved some time between taking each picture.
![]()
Displacement Vectors
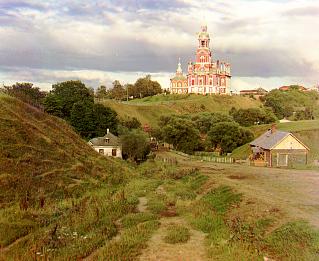
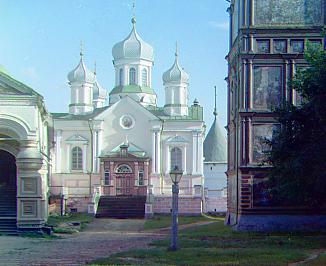
cathedral.jpg green: (2, 5) red: (3, 12)
emir.tif green: (24, 49) red: (40, 107)
harvesters.tif green: (17, 60) red: (13, 123)
icon.tif green: (17, 42) red: (23, 90)
lady.tif green: (9, 56) red: (13, 120)
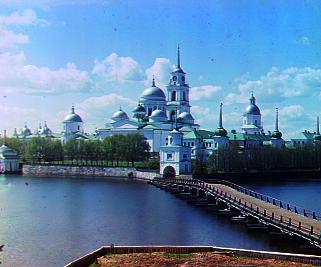
monastery.jpg green: (2, -3) red: (2, 3)
nativity.jpg green: (1, 3) red: (0, 7)
self_portrait.tif green: (29, 78) red: (36, 175)
settlers.jpg green: (0, 7) red: (-1, 14)
three_generations.tif green: (12, 54) red: (9, 111)
train.tif green: (2, 41) red: (29, 85)
turkmen.tif green: (22, 57) red: (28, 117)
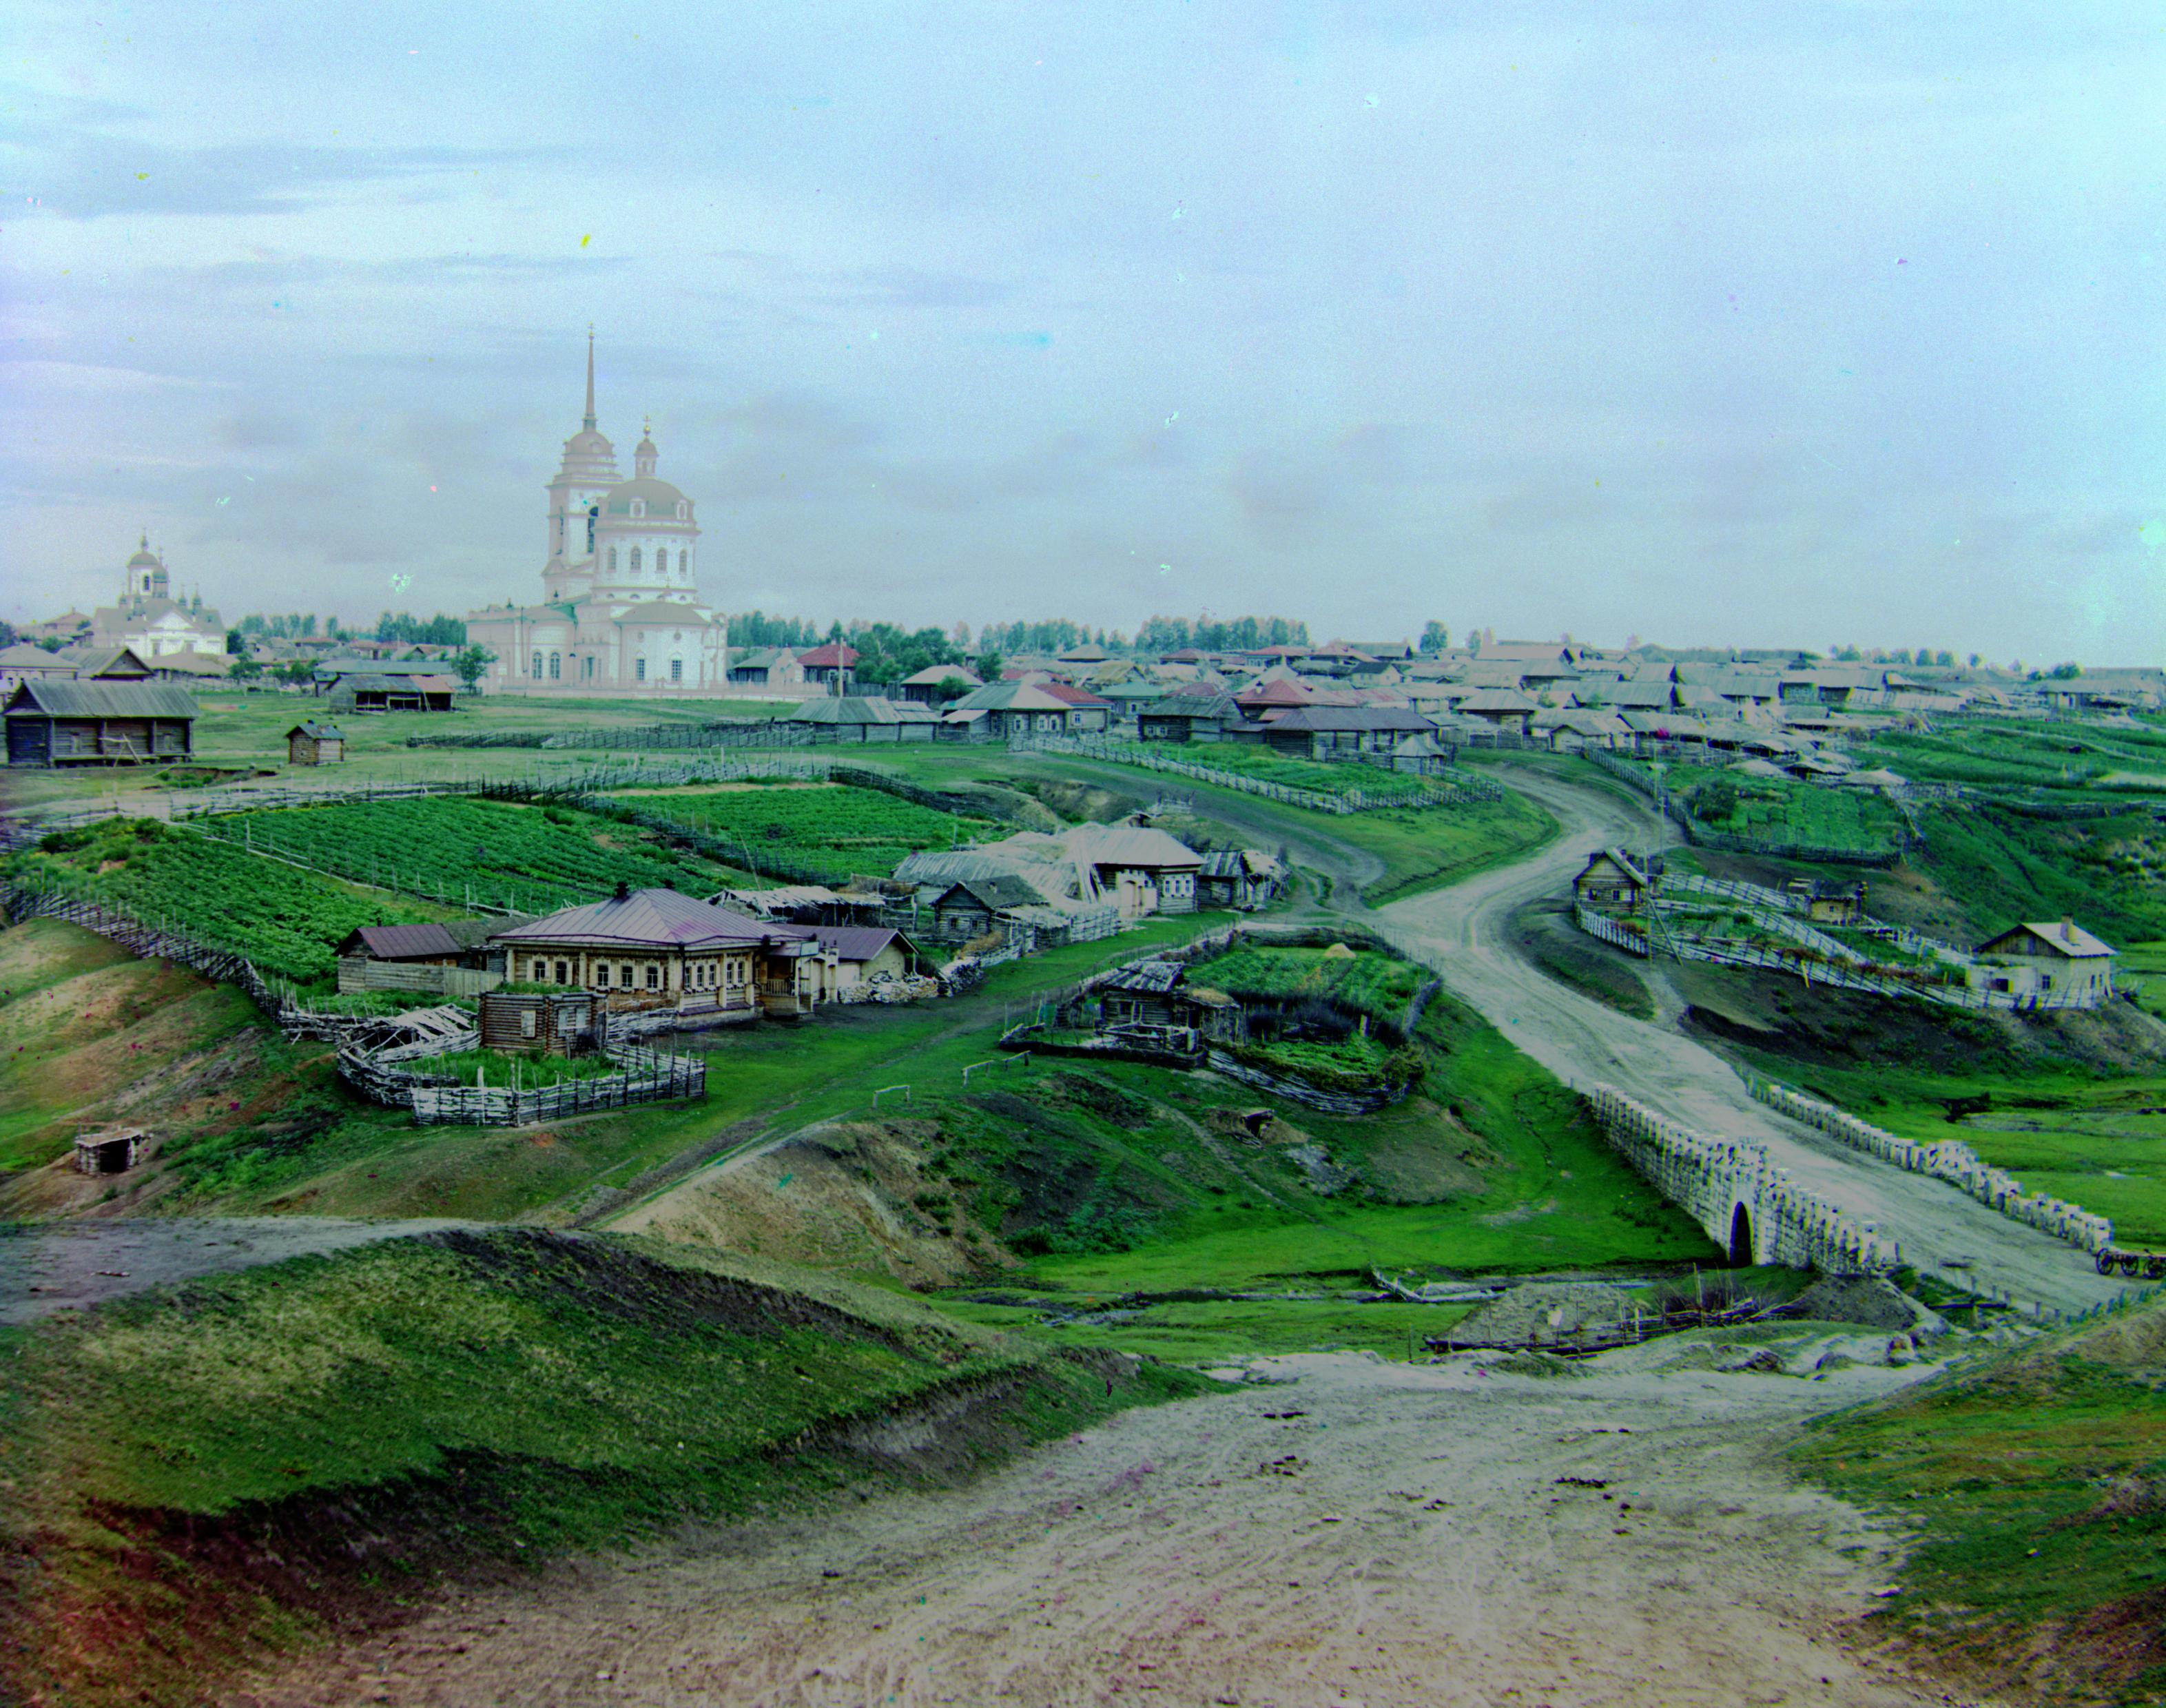
village.tif green: (10, 64) red: (21, 137)
Other Images (with bells and whistles)
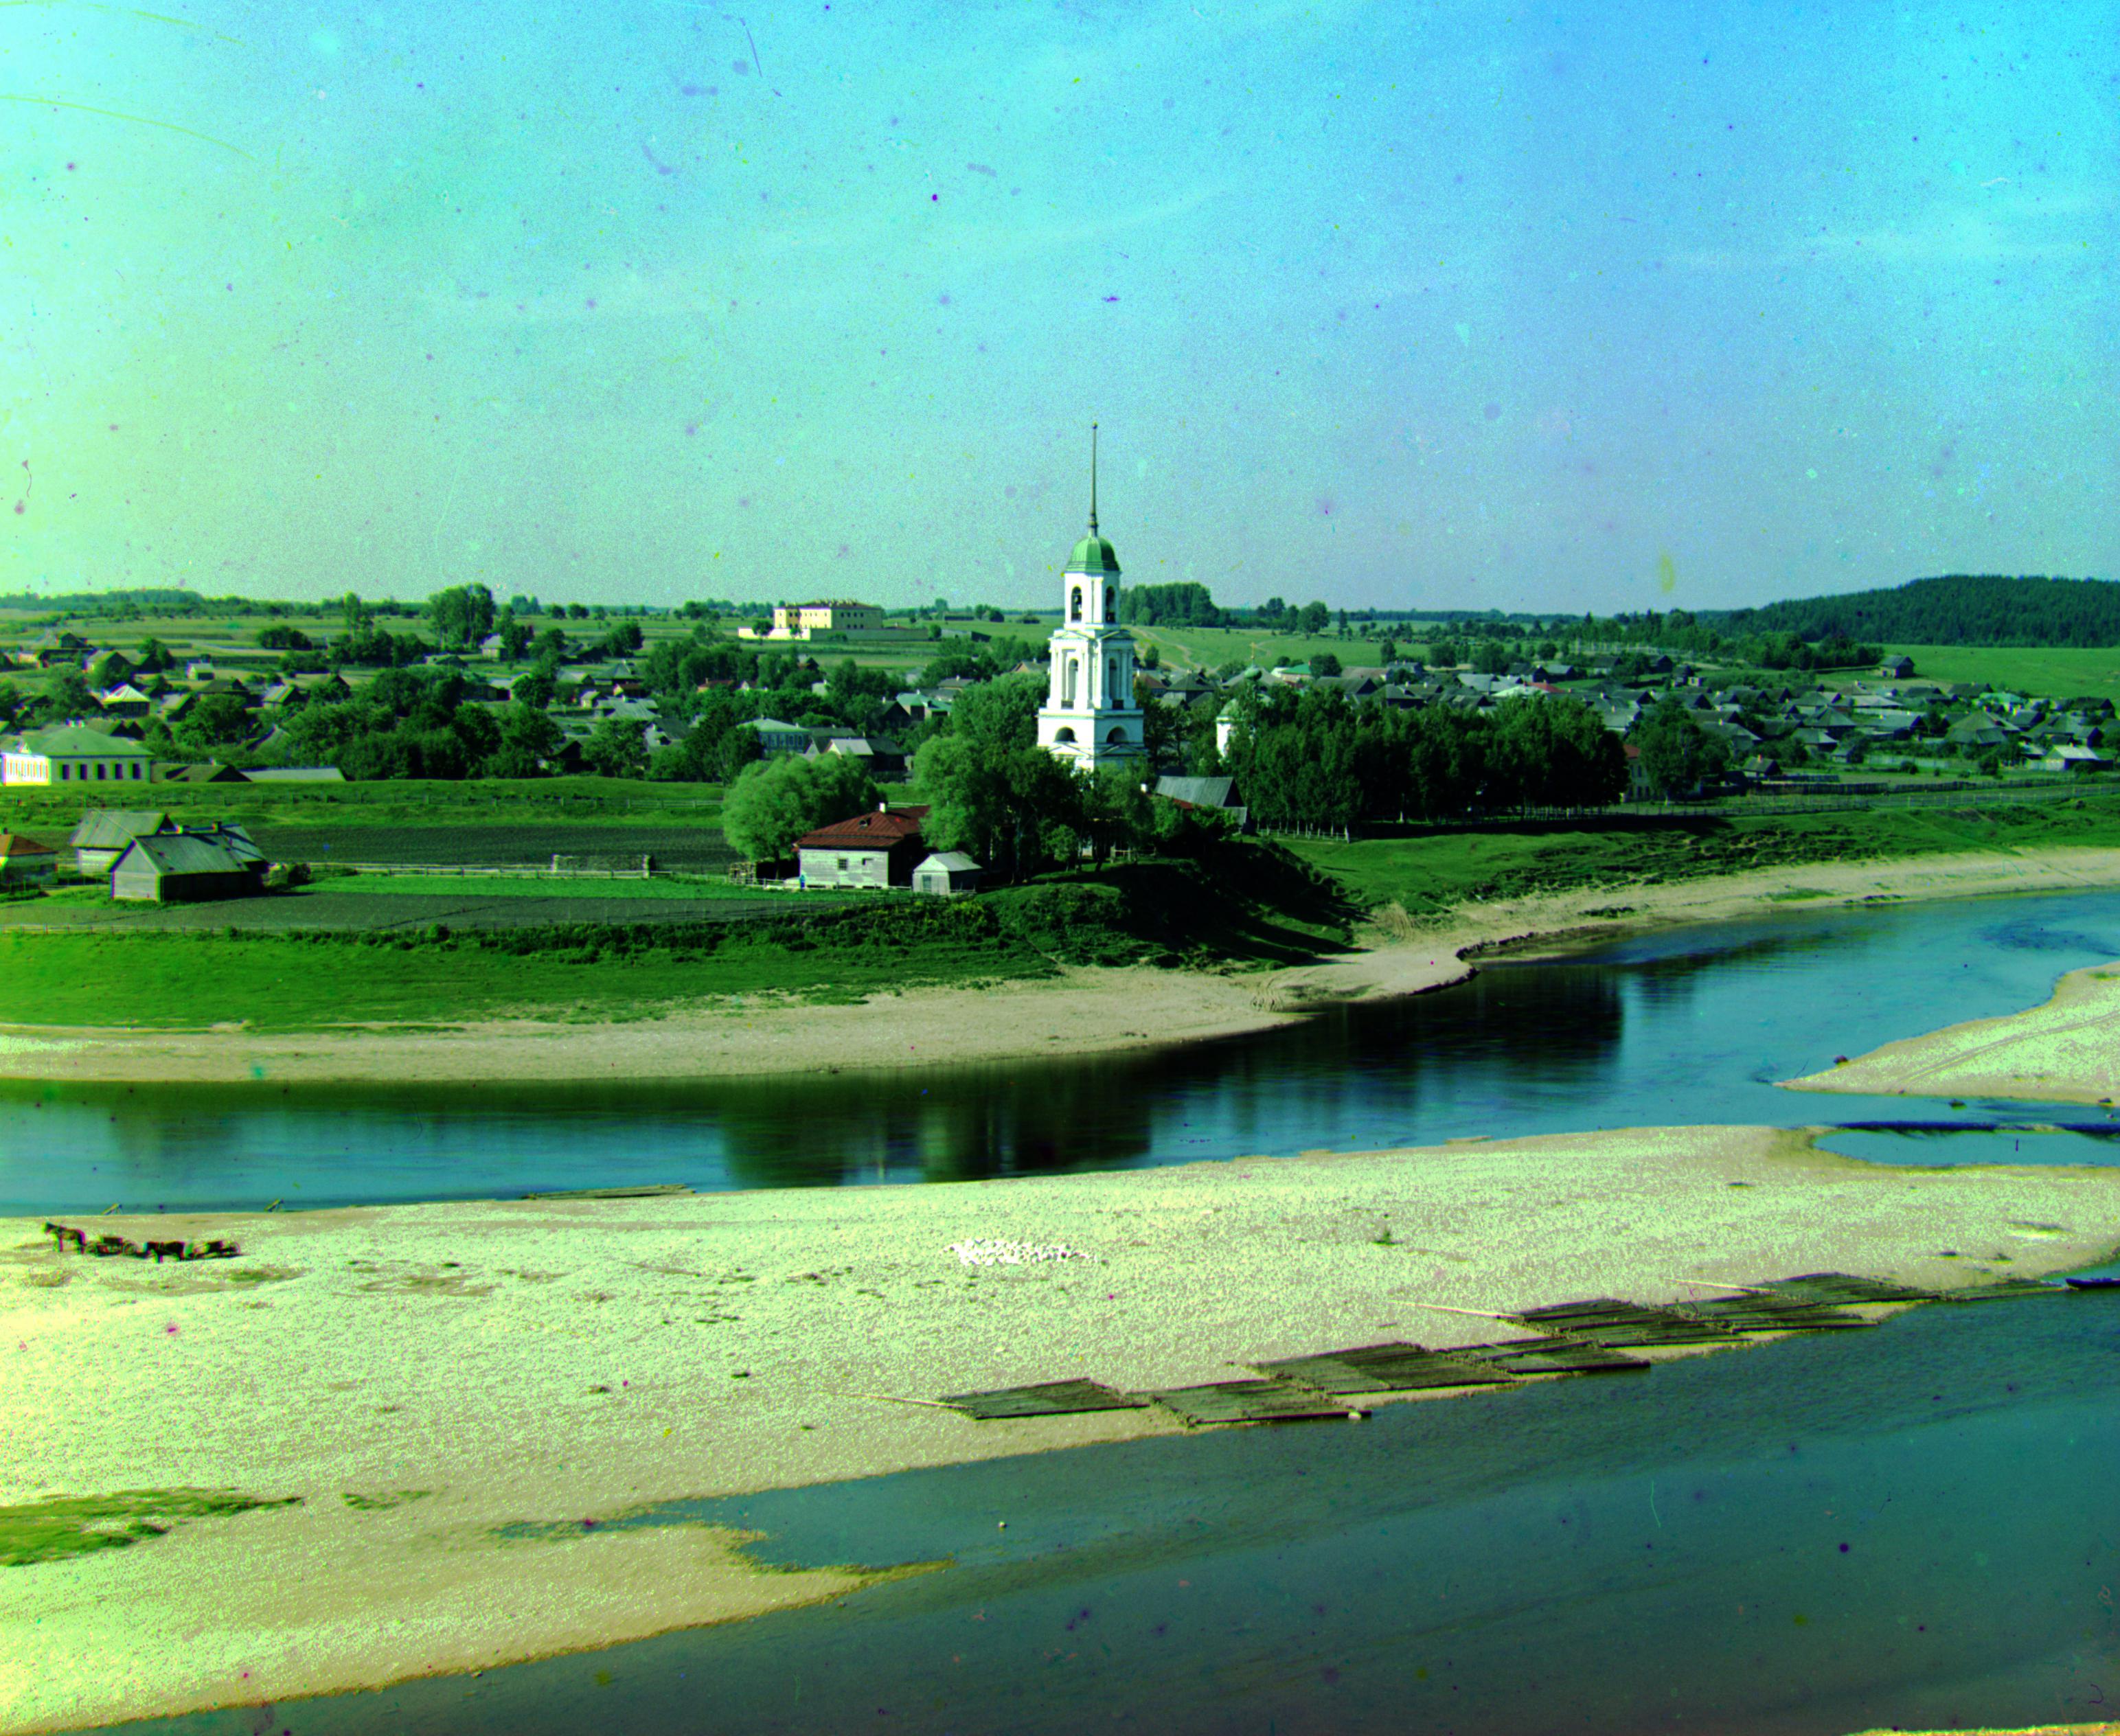
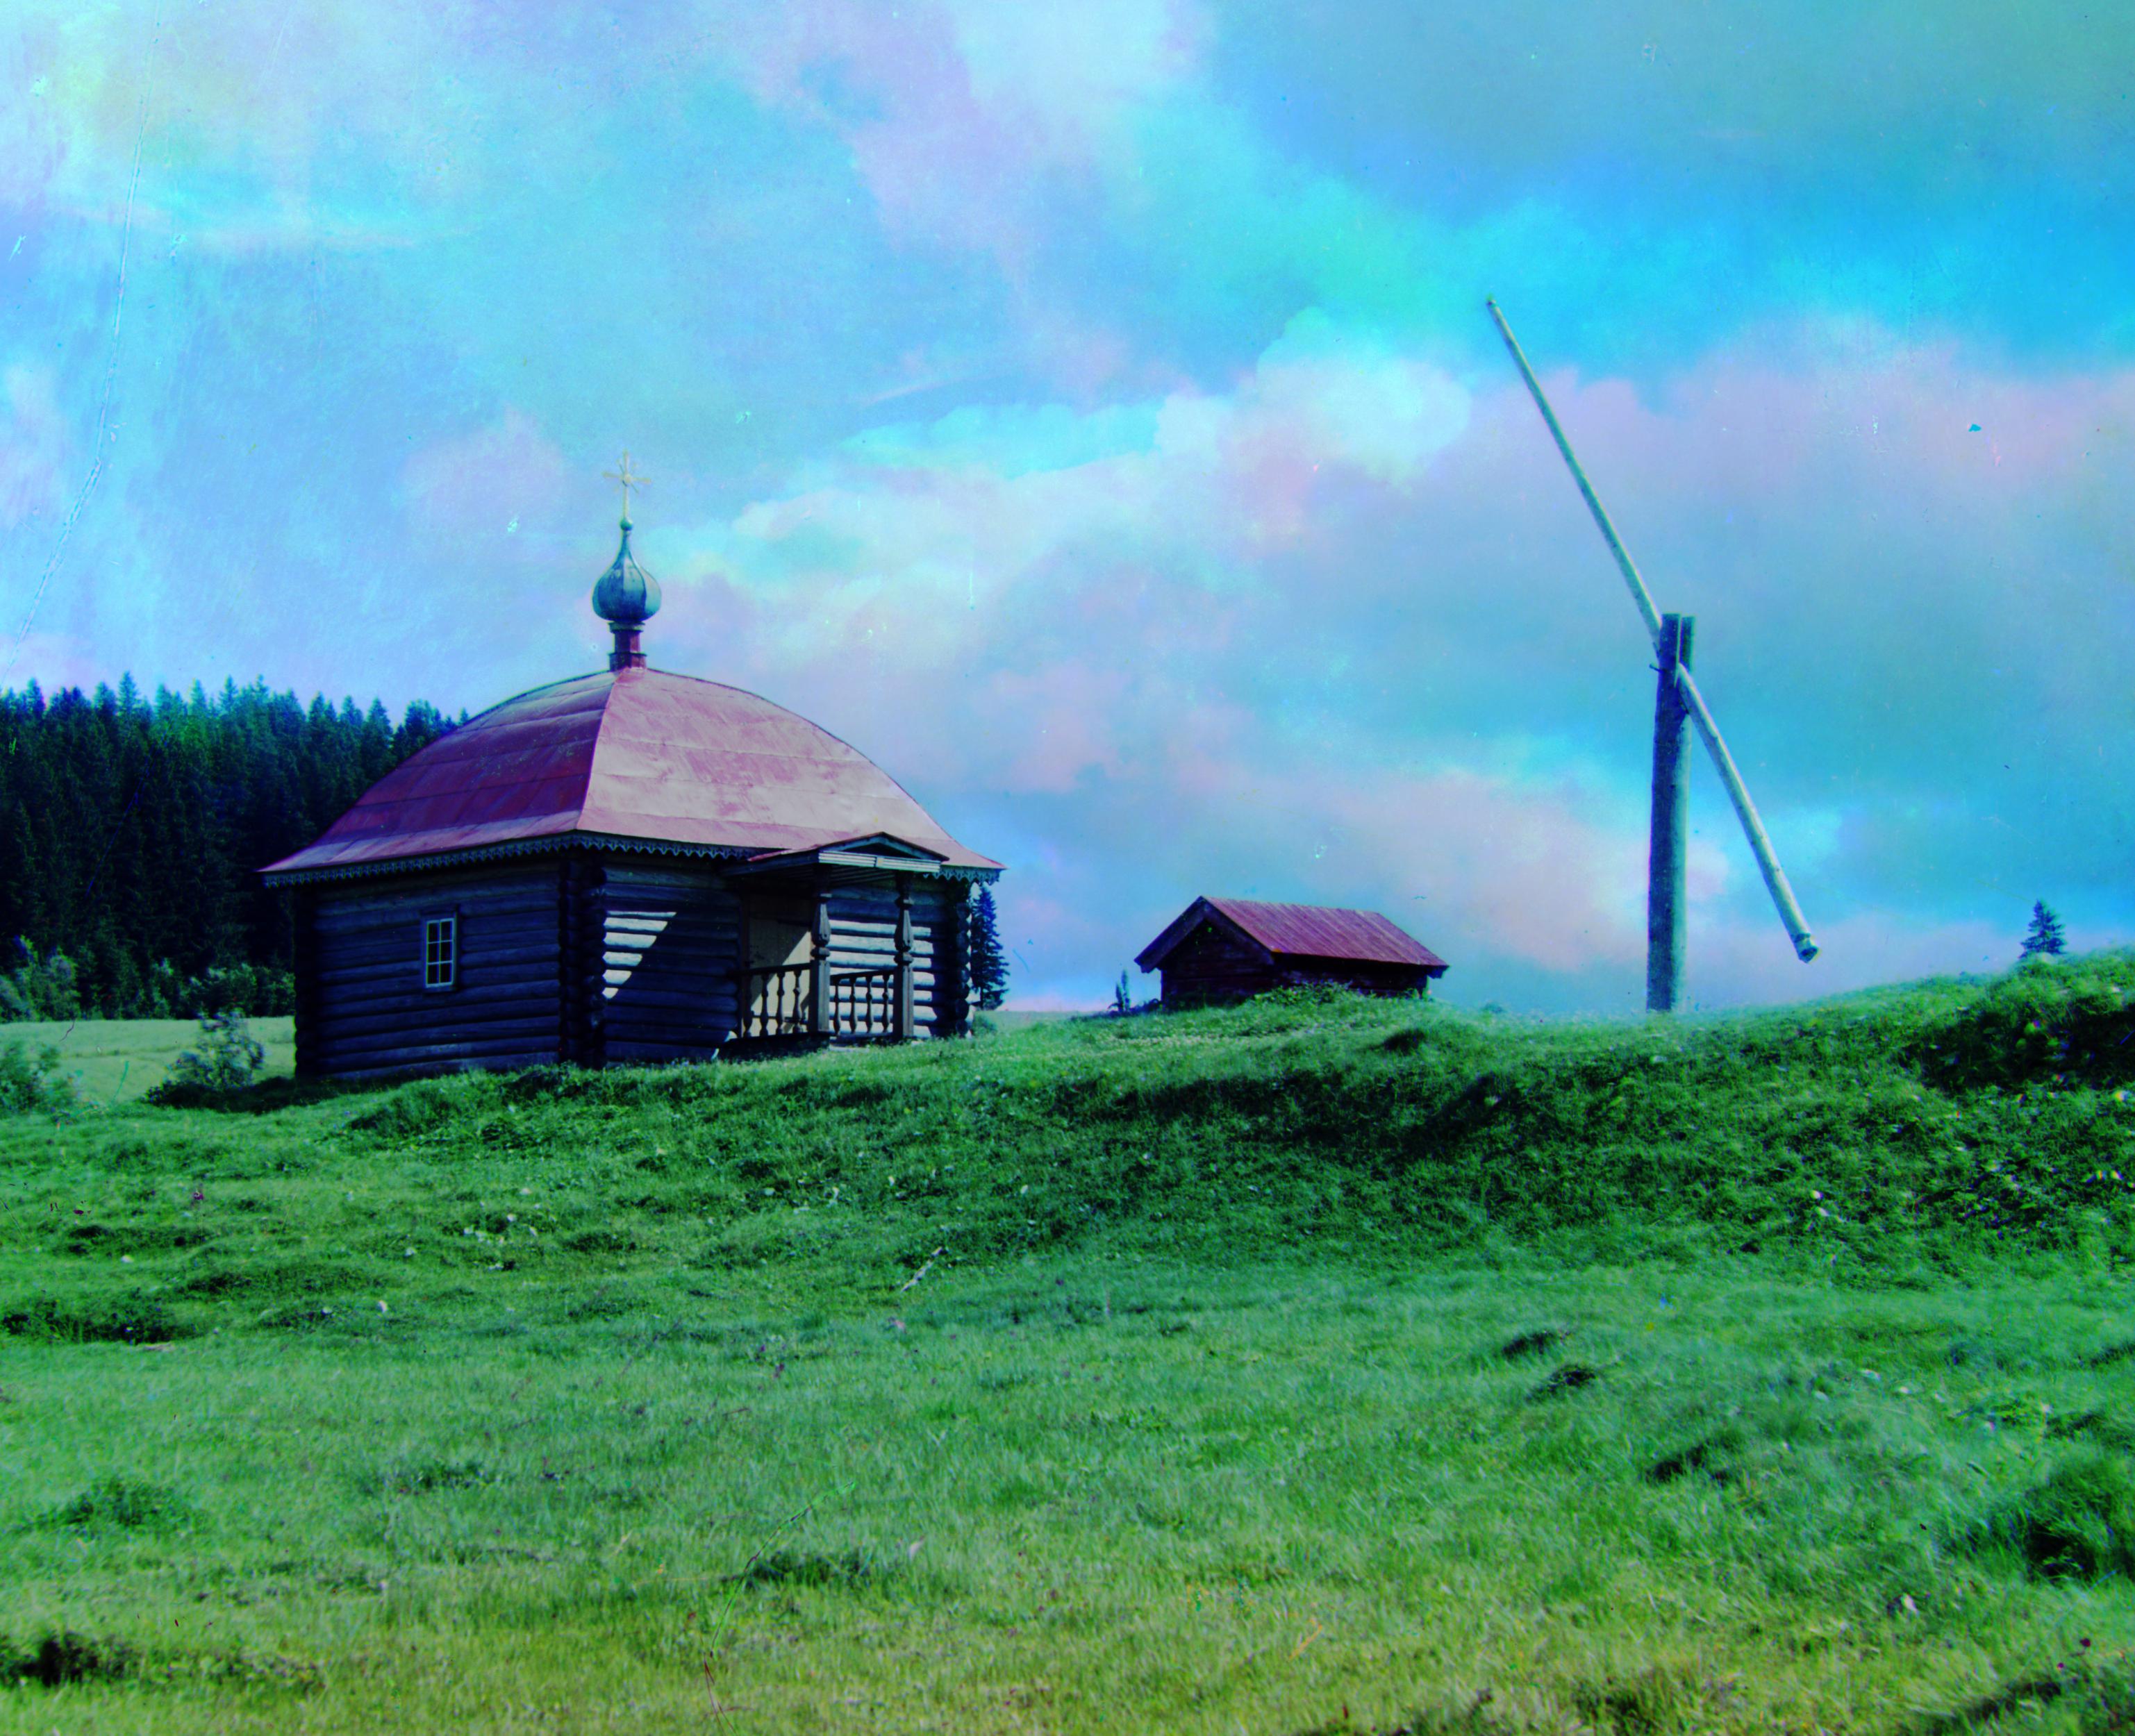
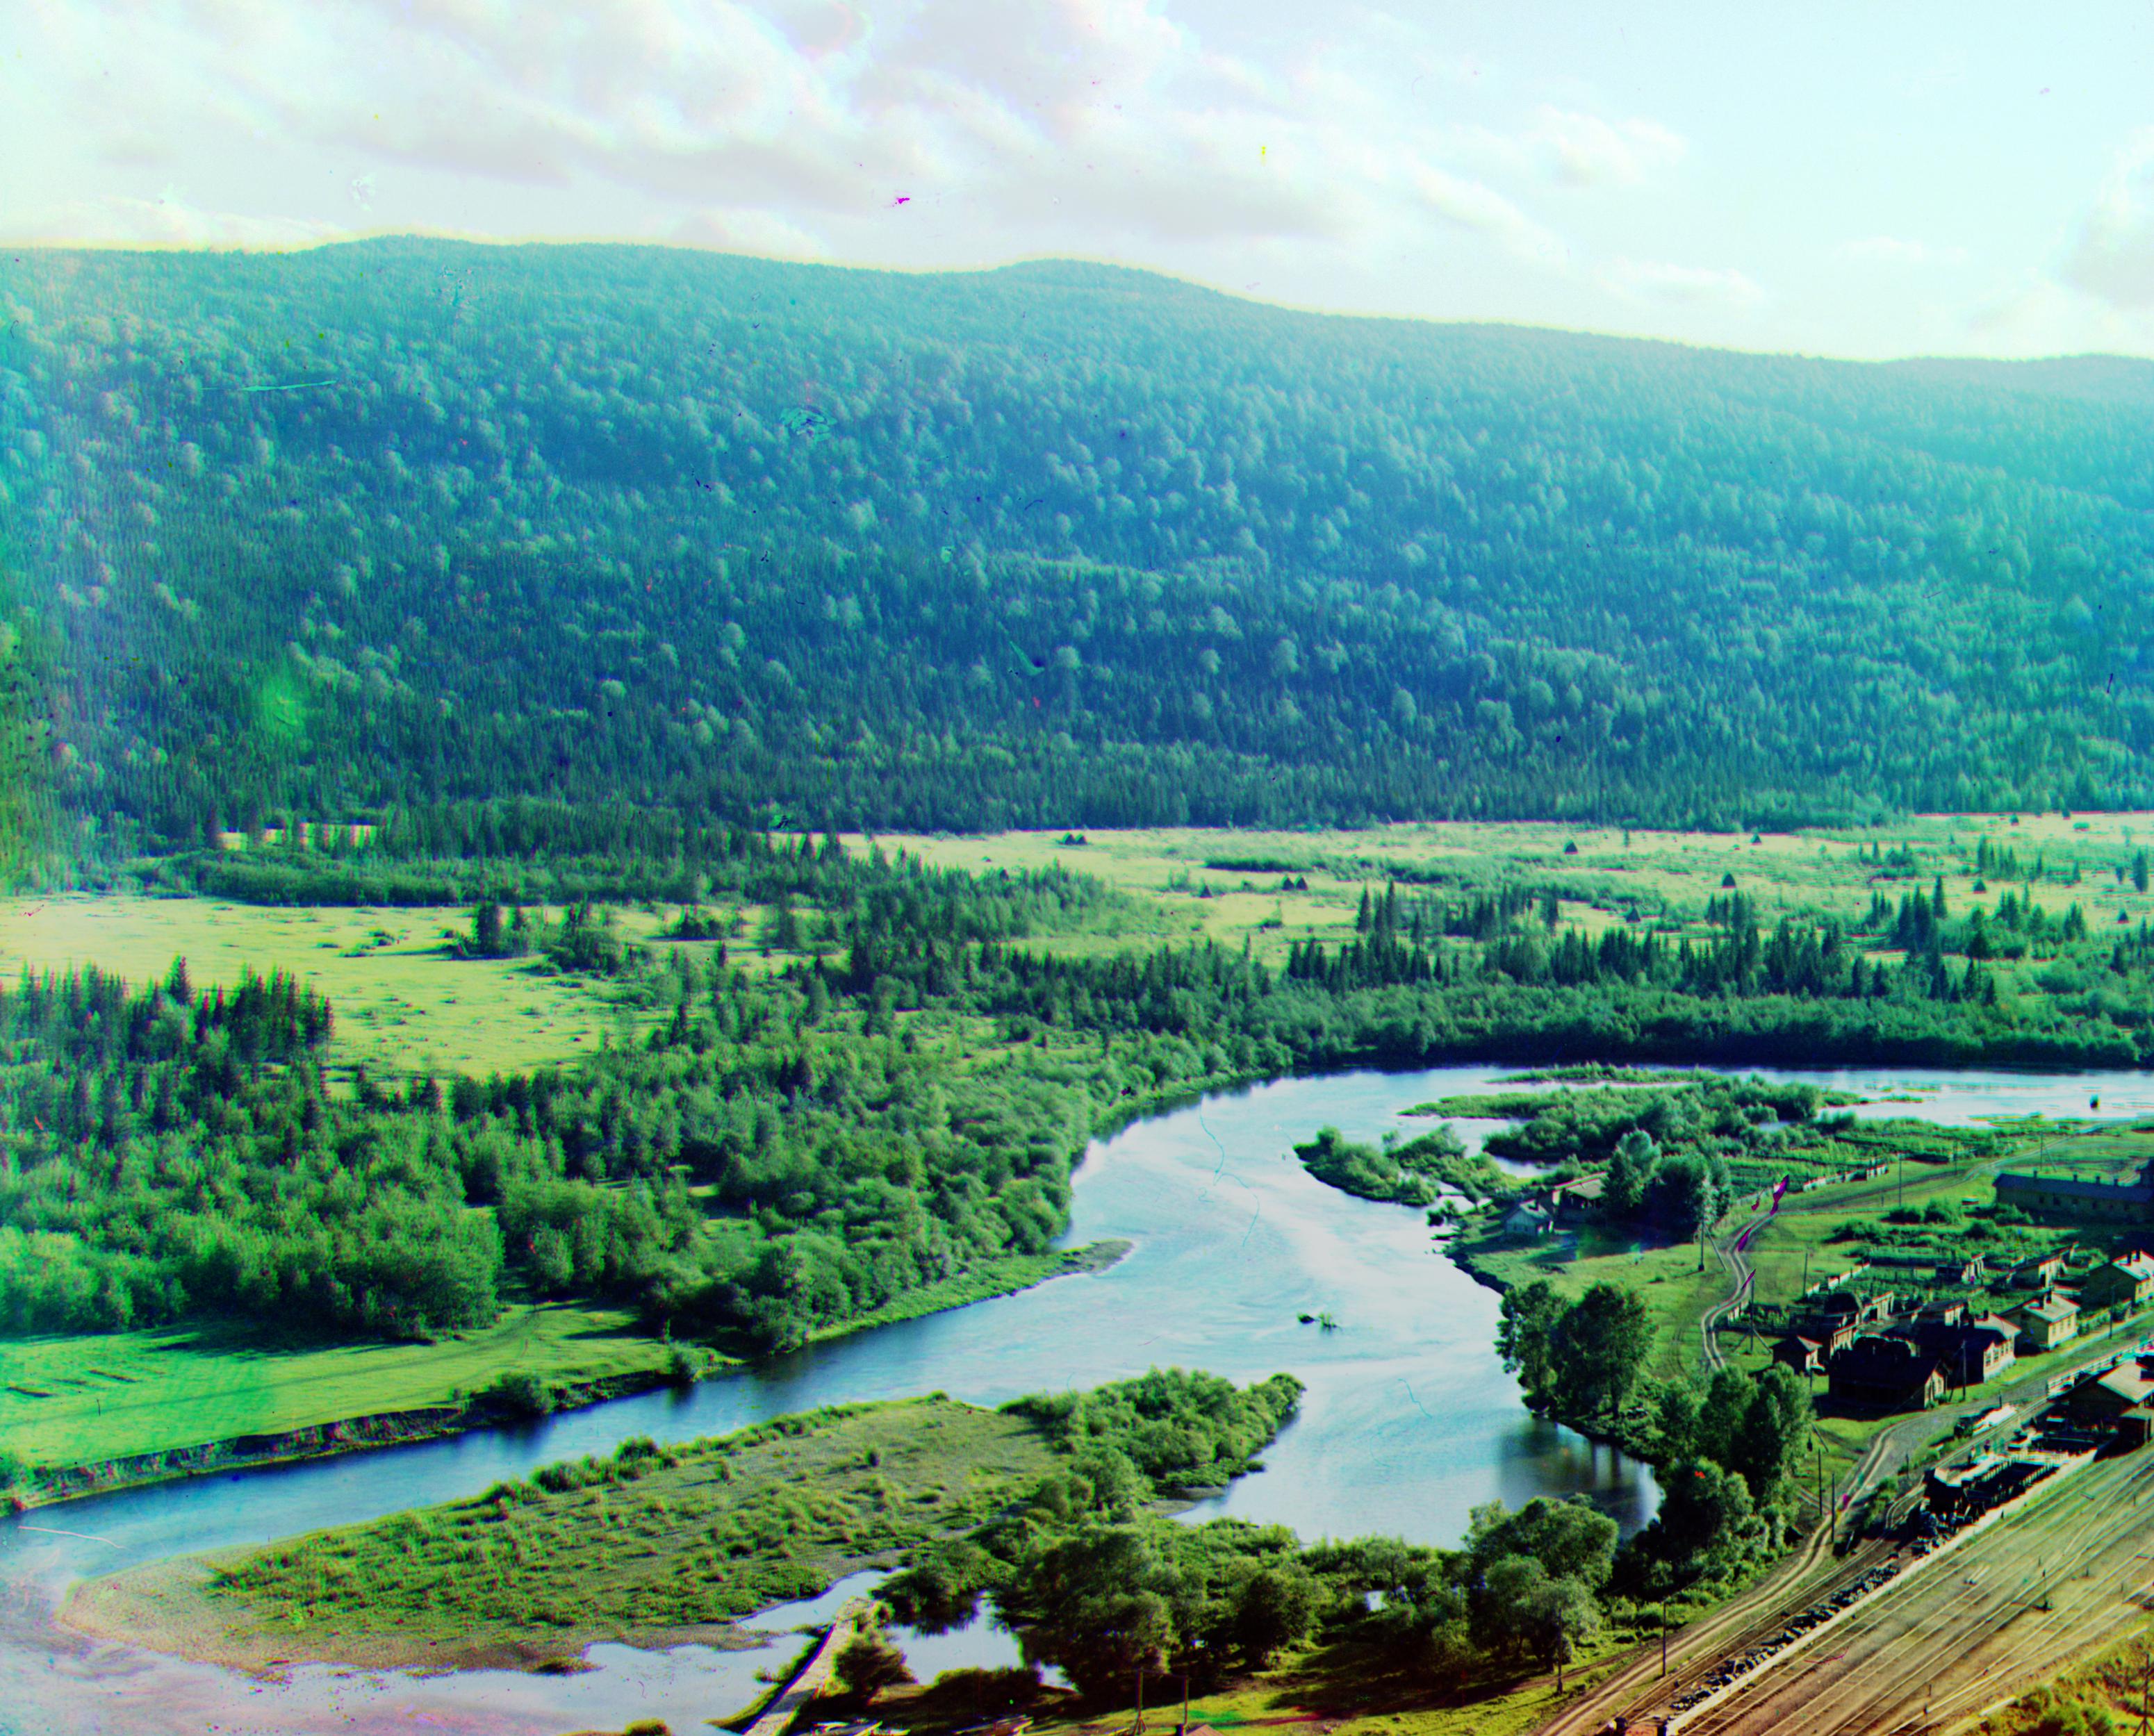
Displacement Vectors
beach.tif green: (15, 65) red: (26, 45)
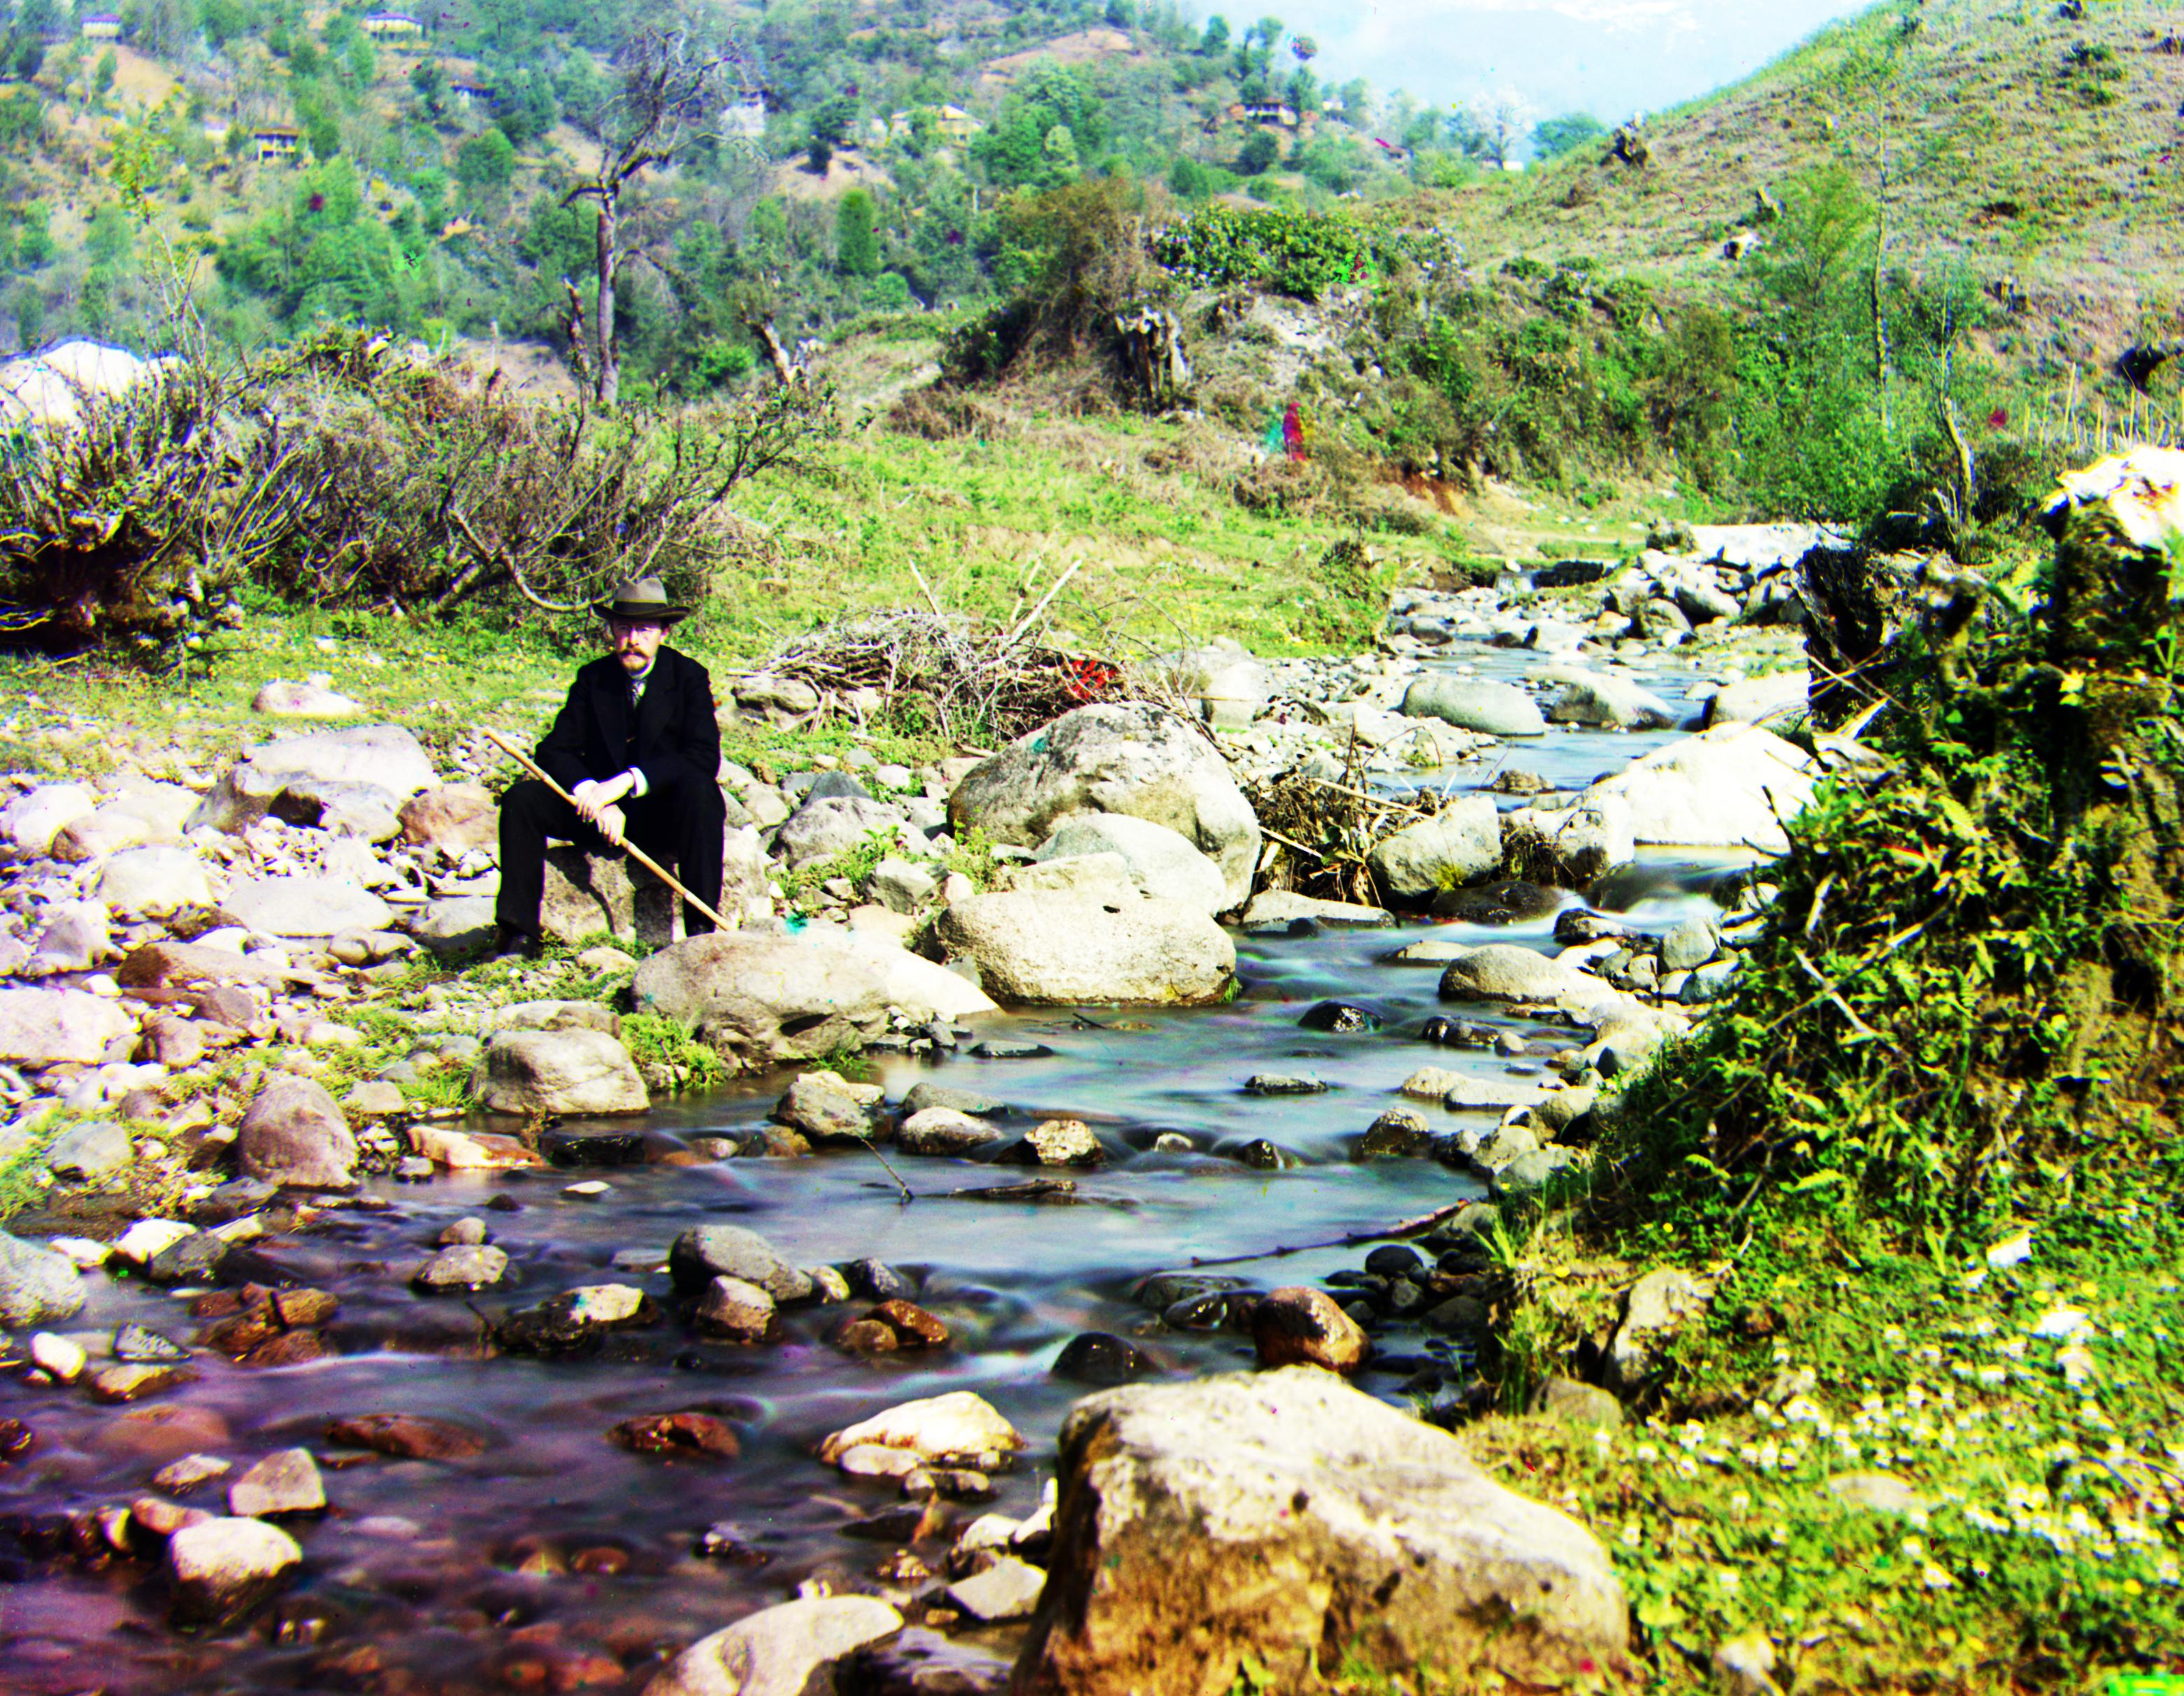
cabin.tif green: (3, 28) red: (6, 70)
river_bend.tif green: (25, 42) red: (34, 83)
soldier.tif green: (5, 40) red: (1, 105)