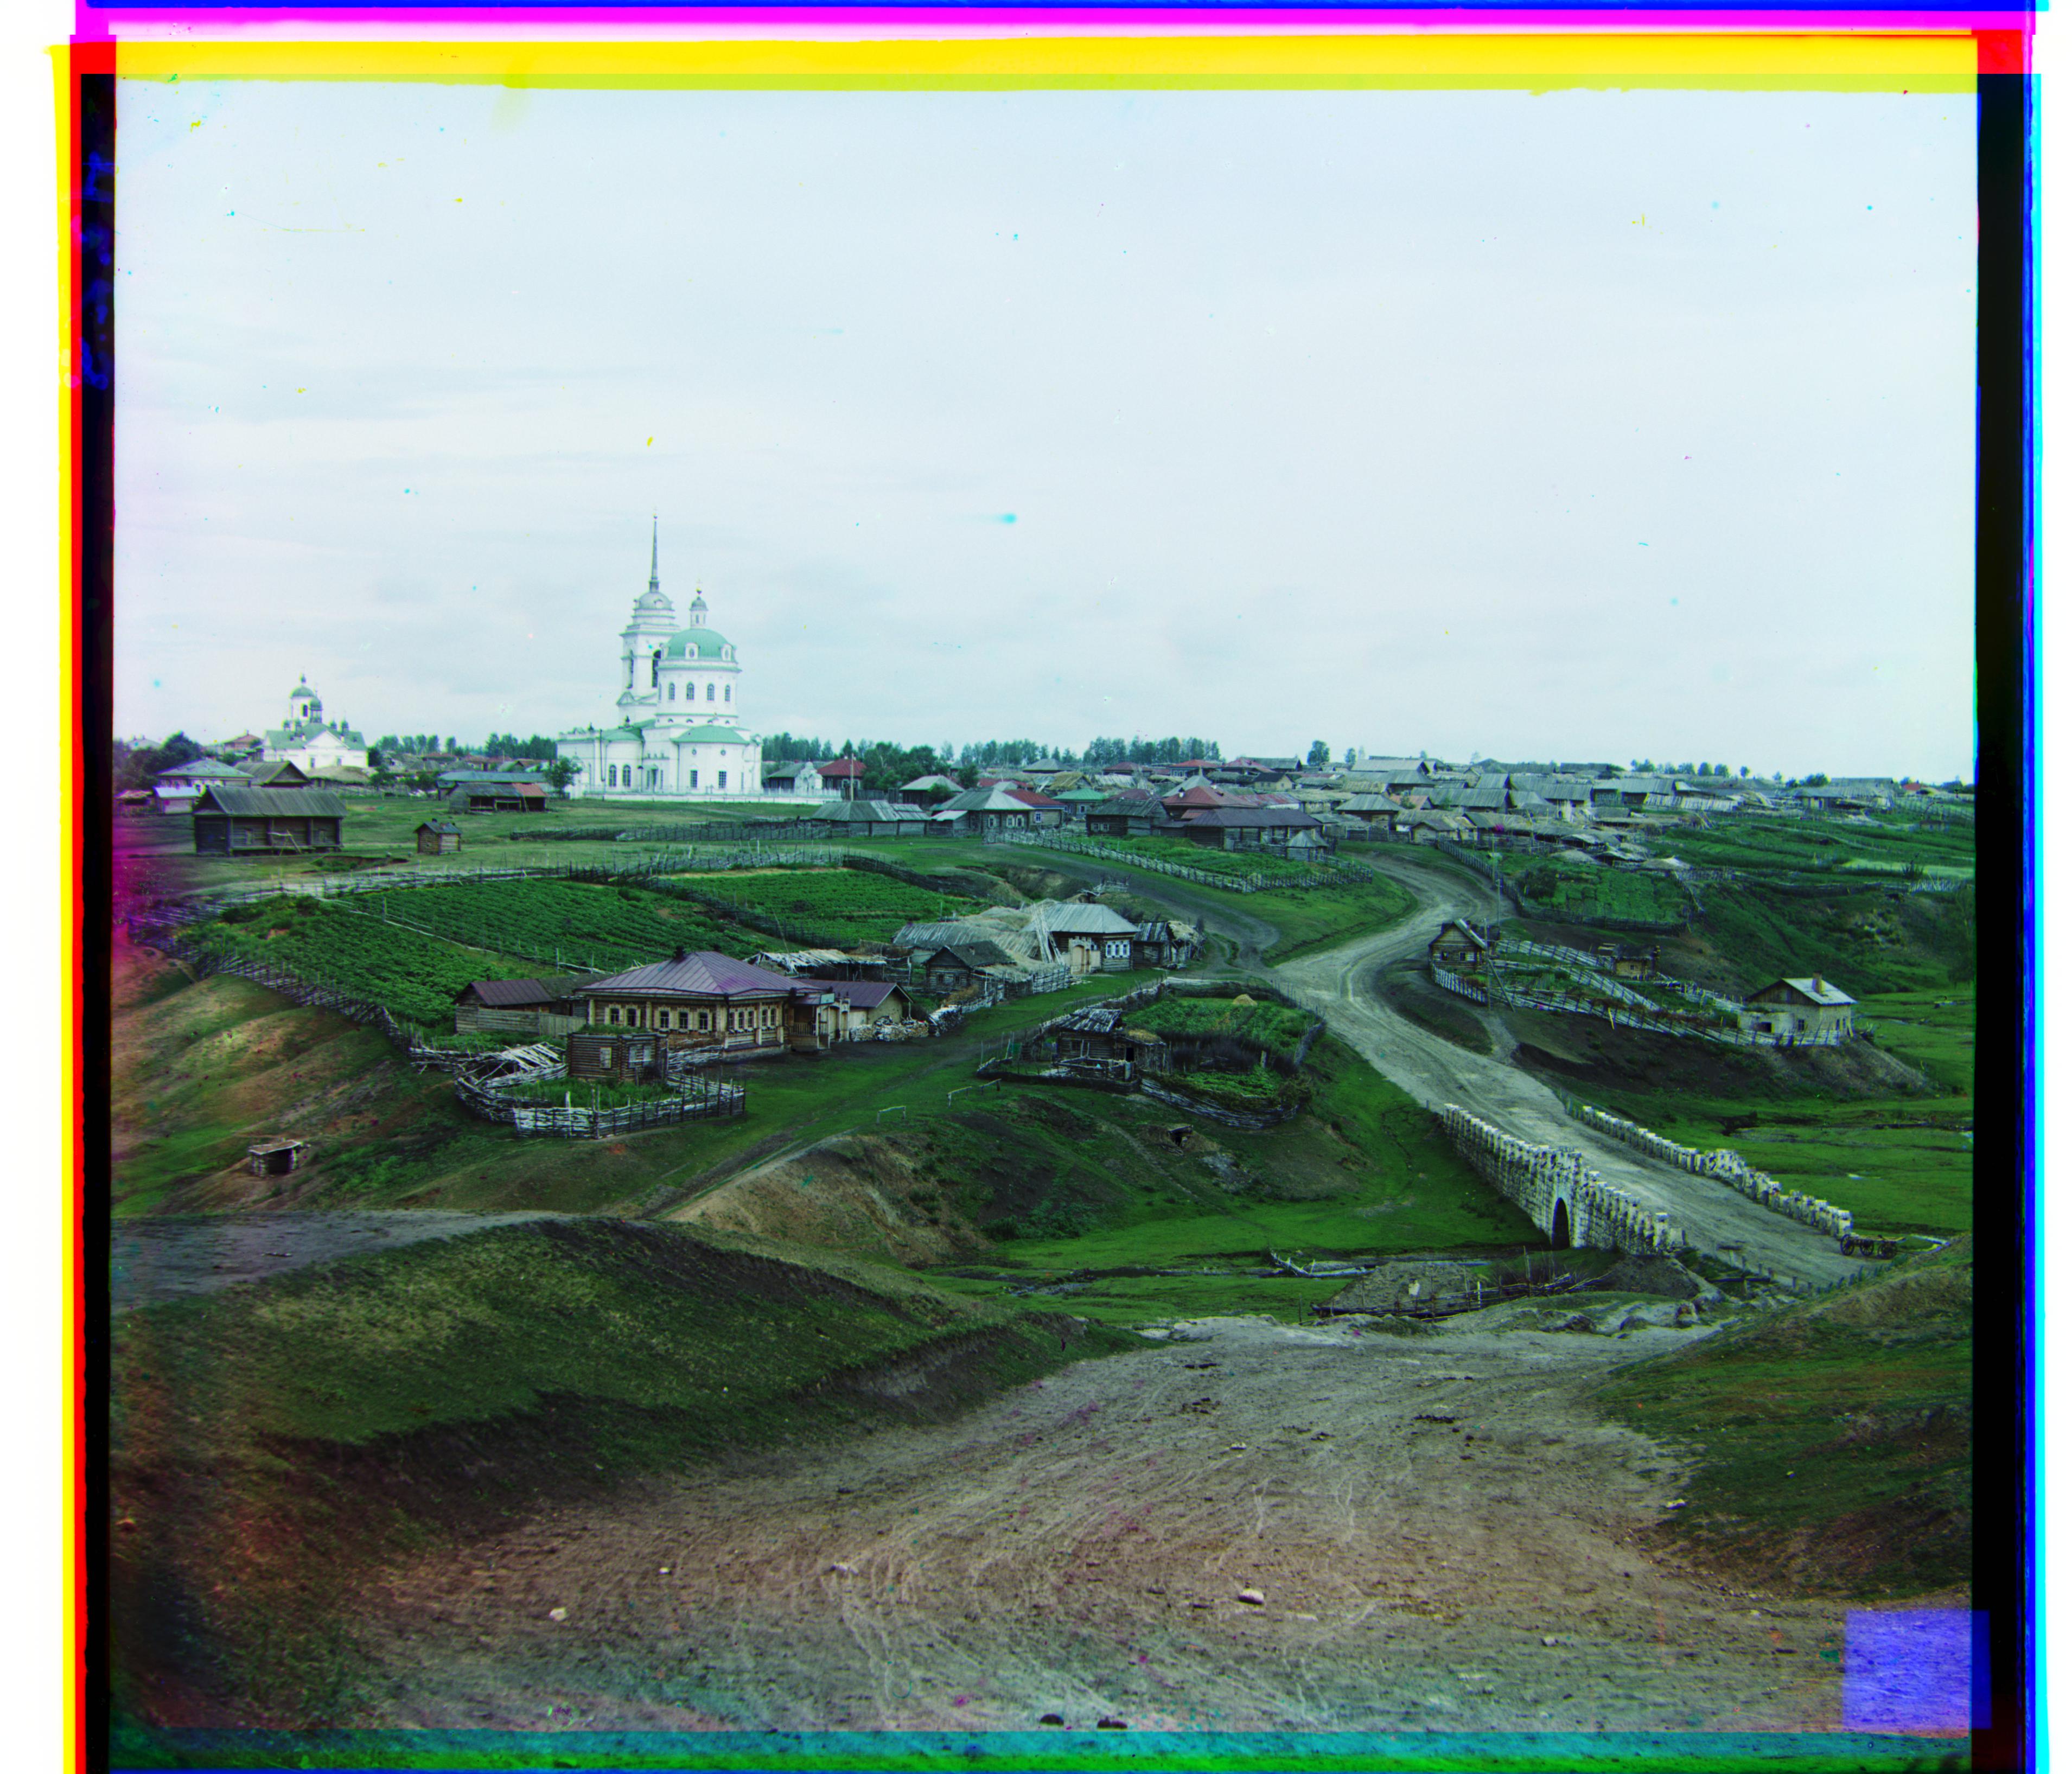
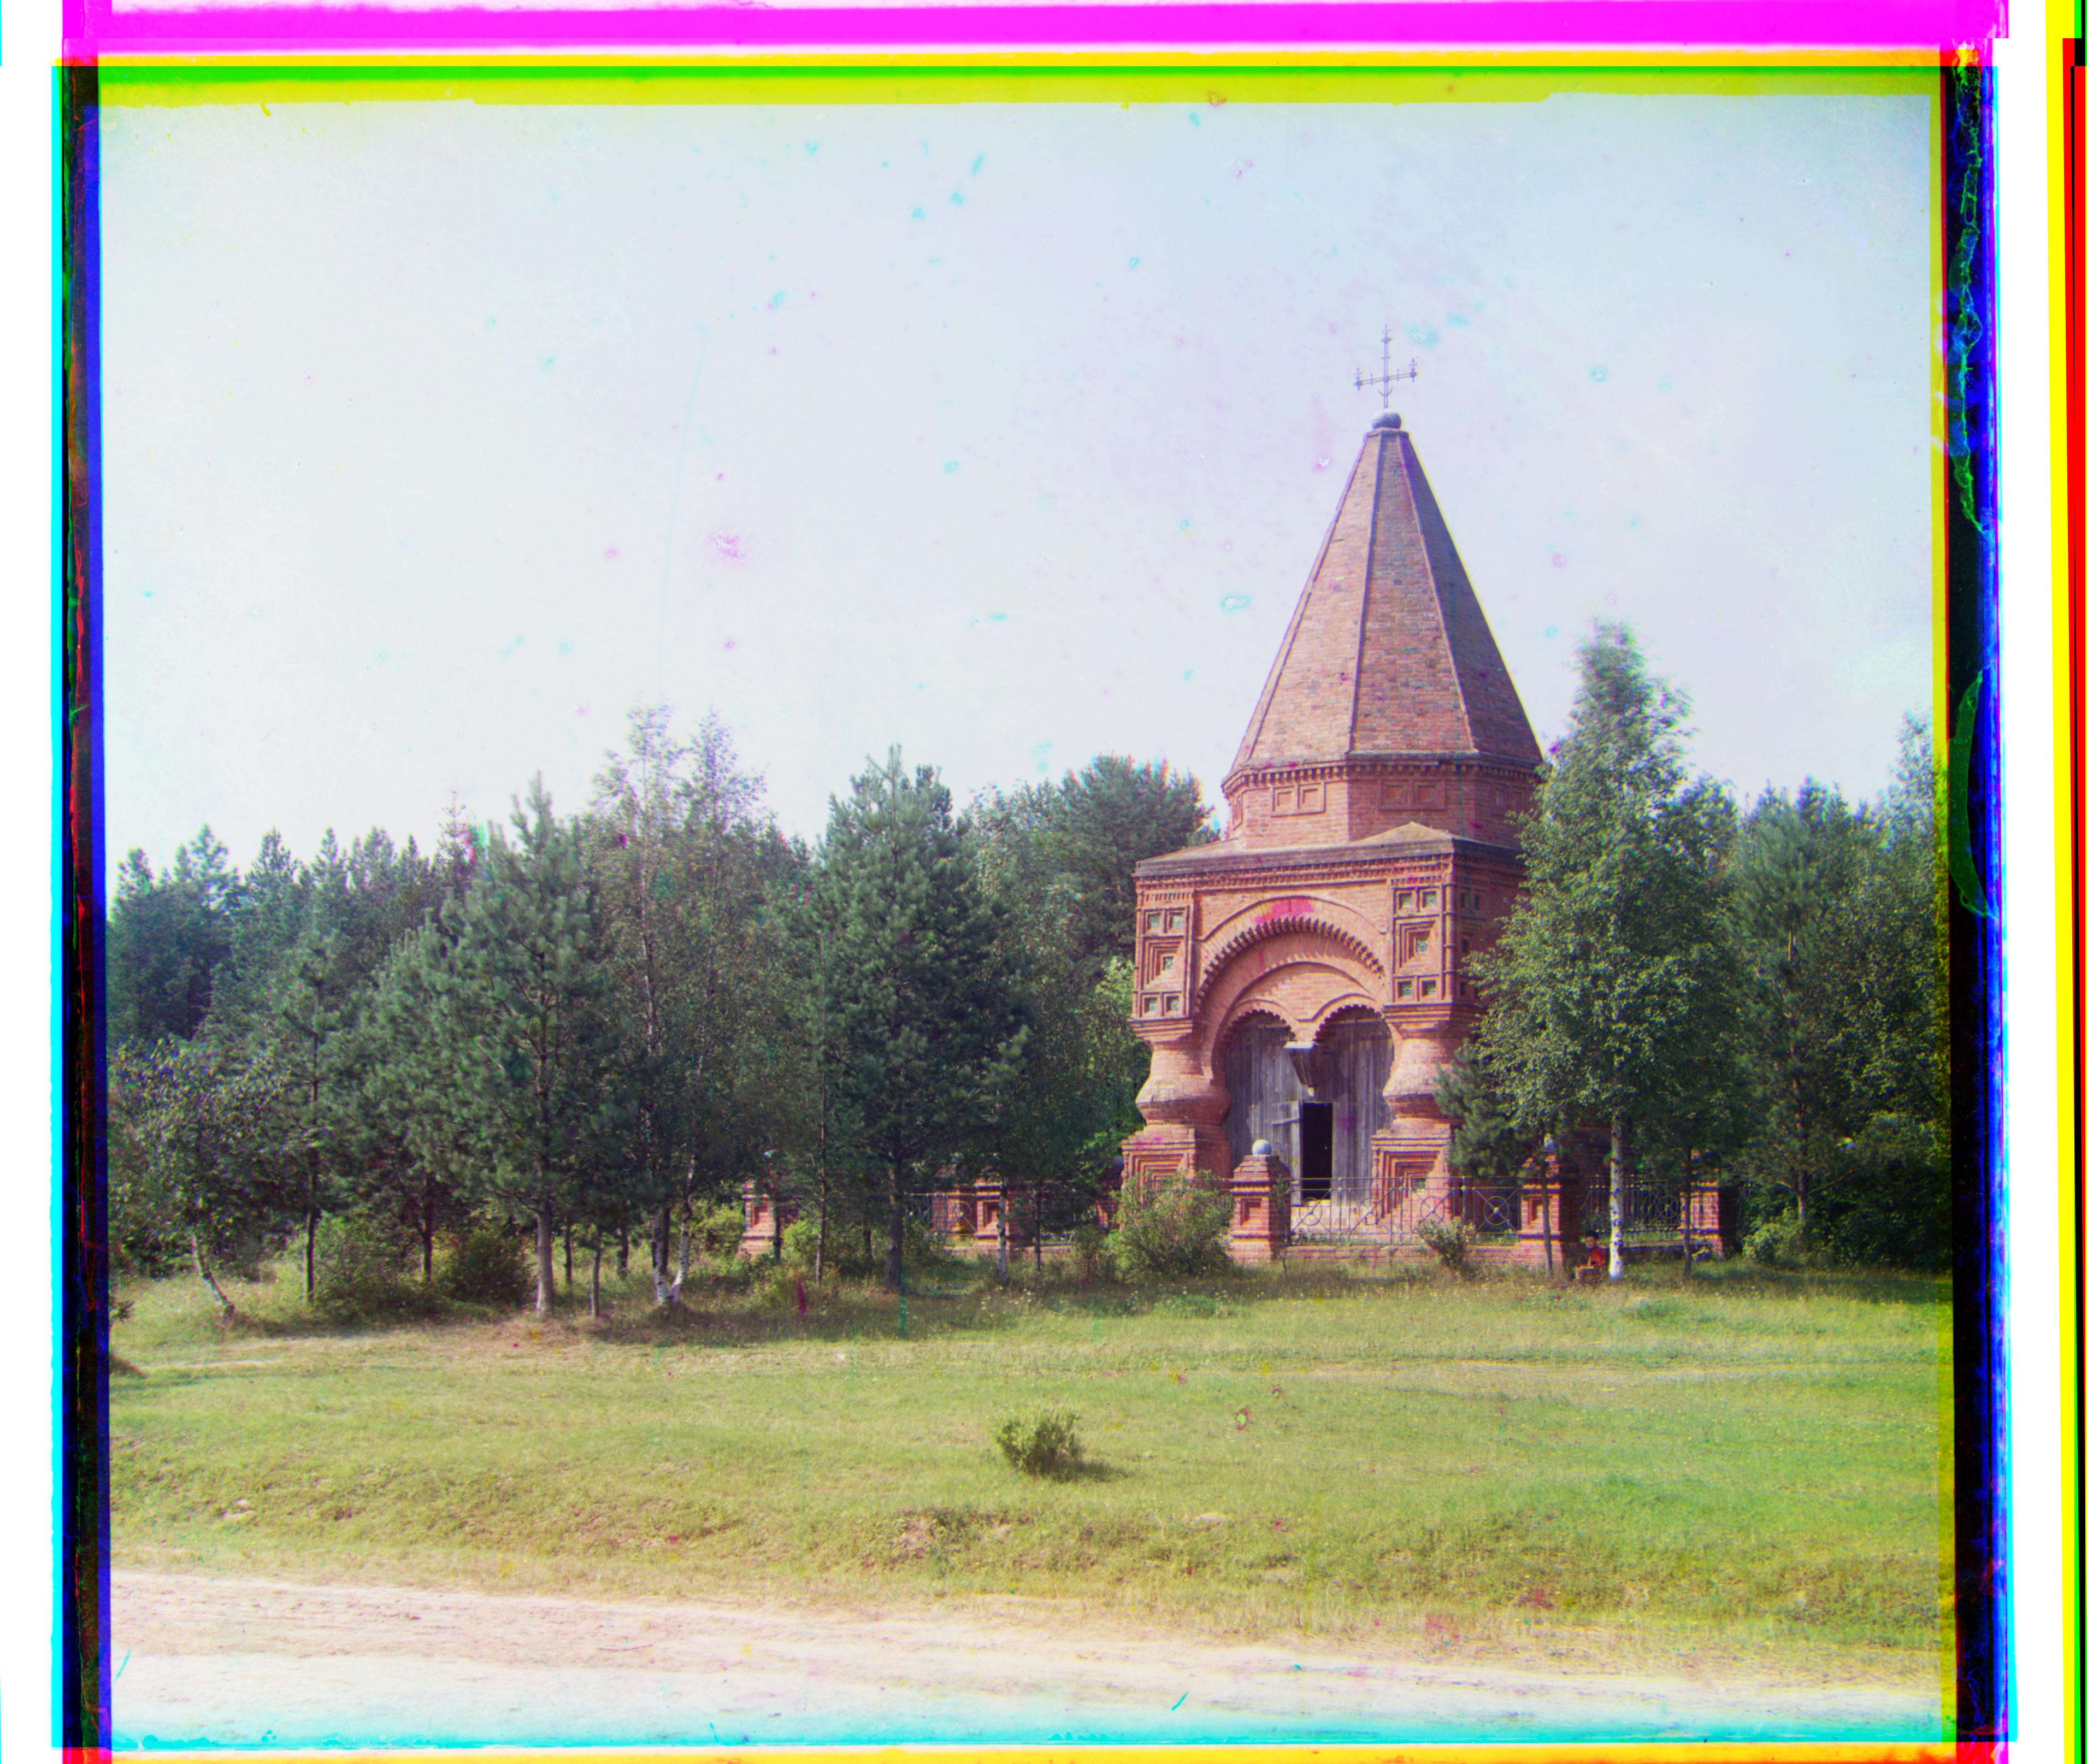
Cathedral
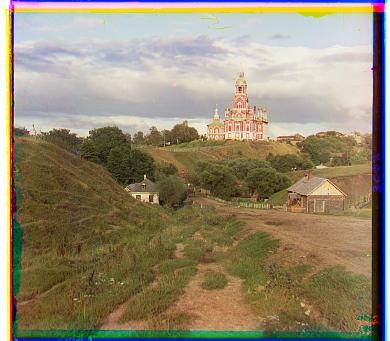
Loss Function: Sum of squared distance
Green and Blue Displacement: Vertical: 5; Horizontal: 2
Red and Blue Displacement: Vertical: 12; Horizontal: 3
First I down sampled the two images by 50% until they were less than 300 pixels tall. I have a preset max_dispacement used to find the best vertical and horizontal dislacements for this blurriest image. Then I use the images one scale above, align the two images based on the displacements I found for the previous down sampled images, and then fine tune the adjustments. I continue this process until I've fine tuned the alignment for the original images.
Here's how it works:
Another challenge I had was when I was calculating the score between two images, I originally used the whole images. But the black borders from the image, and the colorful borders from shifting the image added unncessary noise and made some images seem incorrectly more similar or different than they actually were. To solve this issue, I added another parameter called frame_size; I only compared a frame within each of the images a small subsction of the center of each image.
Loss Function: Sum of squared distance
Green and Blue Displacement: Vertical: 5; Horizontal: 2
Red and Blue Displacement: Vertical: 12; Horizontal: 3
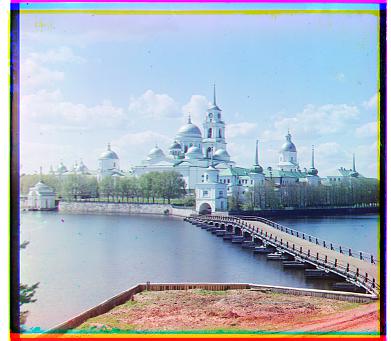
Loss Function: Normalized cross correlation
Green and Blue Displacement: Vertical: -3; Horizontal: 2
Red and Blue Displacement: Vertical: 3; Horizontal: 2
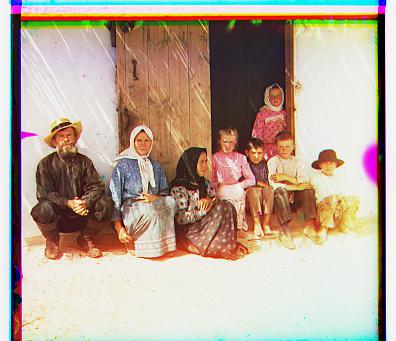
Loss Function: Normalized cross correlation
Green and Blue Displacement: Vertical: 7; Horizontal: 0
Red and Blue Displacement: Vertical: 14; Horizontal: -1
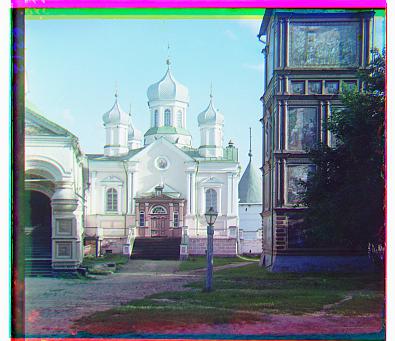
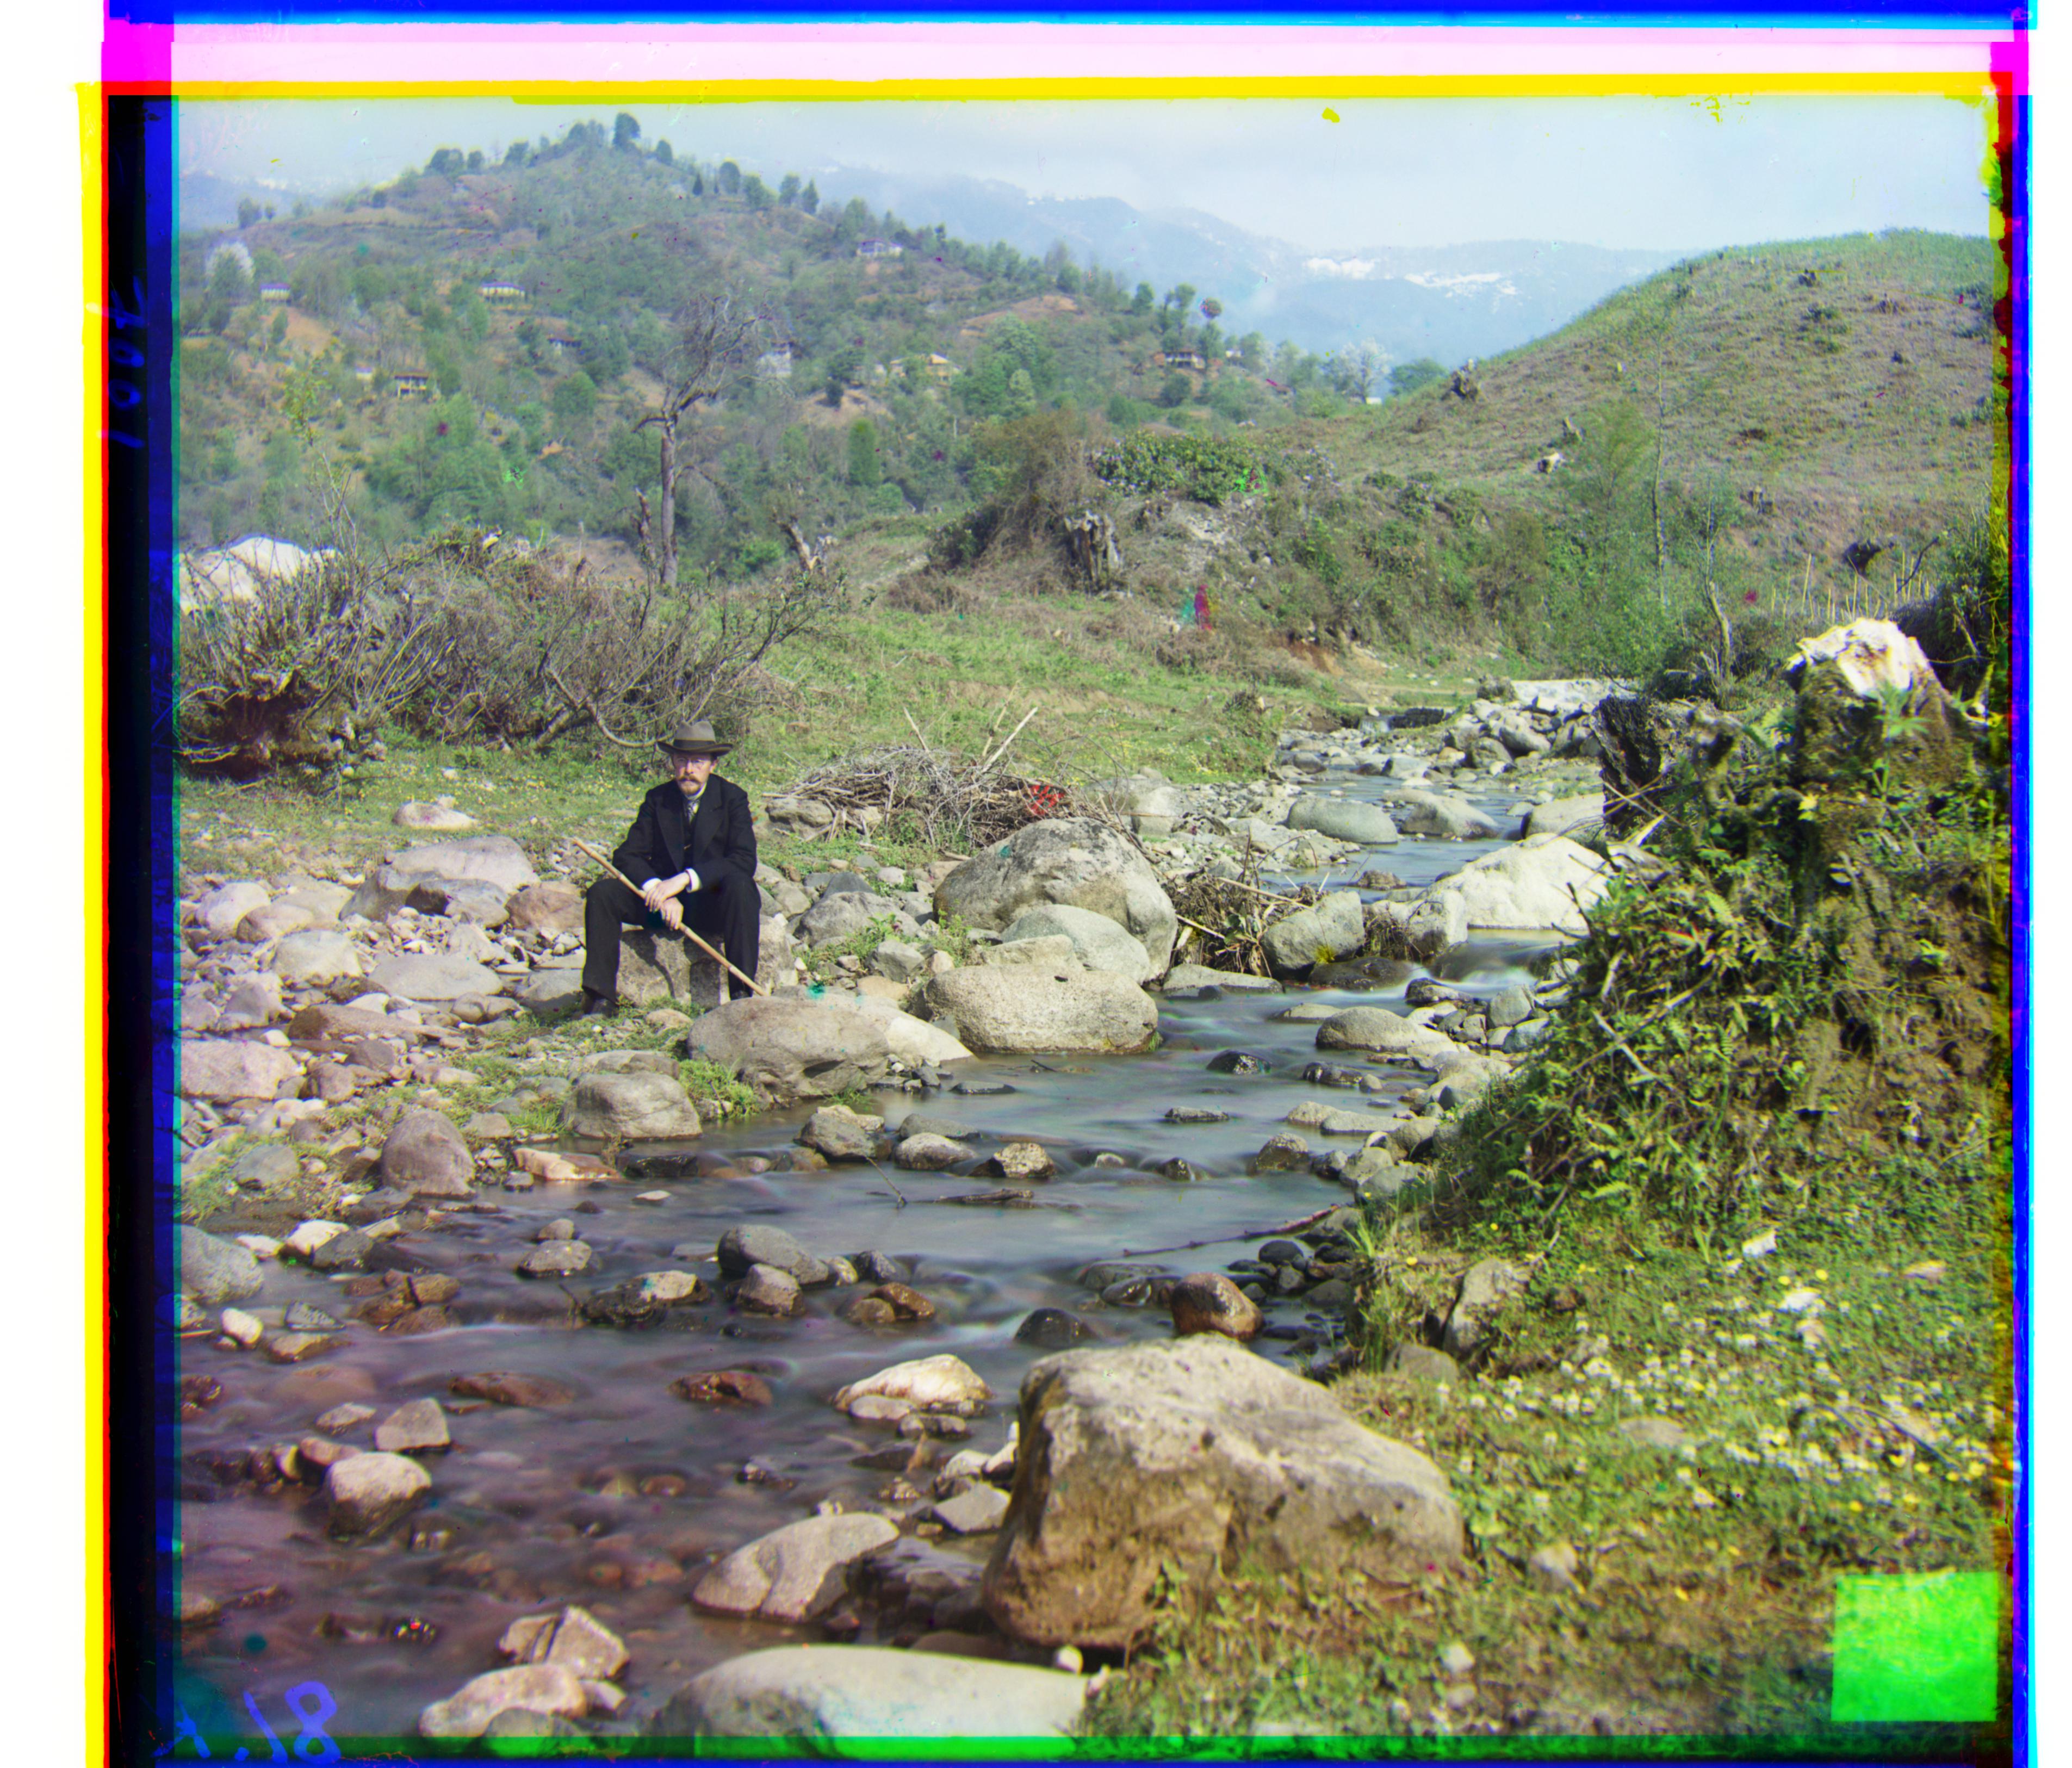
Loss Function: Normalized cross correlation
Green and Blue Displacement: Vertical: 3; Horizontal: 1
Red and Blue Displacement: Vertical: 8; Horizontal: 0
Loss Function: Normalized cross correlation
Green and Blue Displacement: Vertical: 58; Horizontal: 16
Downscaled 4 times during pyramid aligning.
Red and Blue Displacement: Vertical: 124; Horizontal: 16
Downscaled 4 times during pyramid aligning.
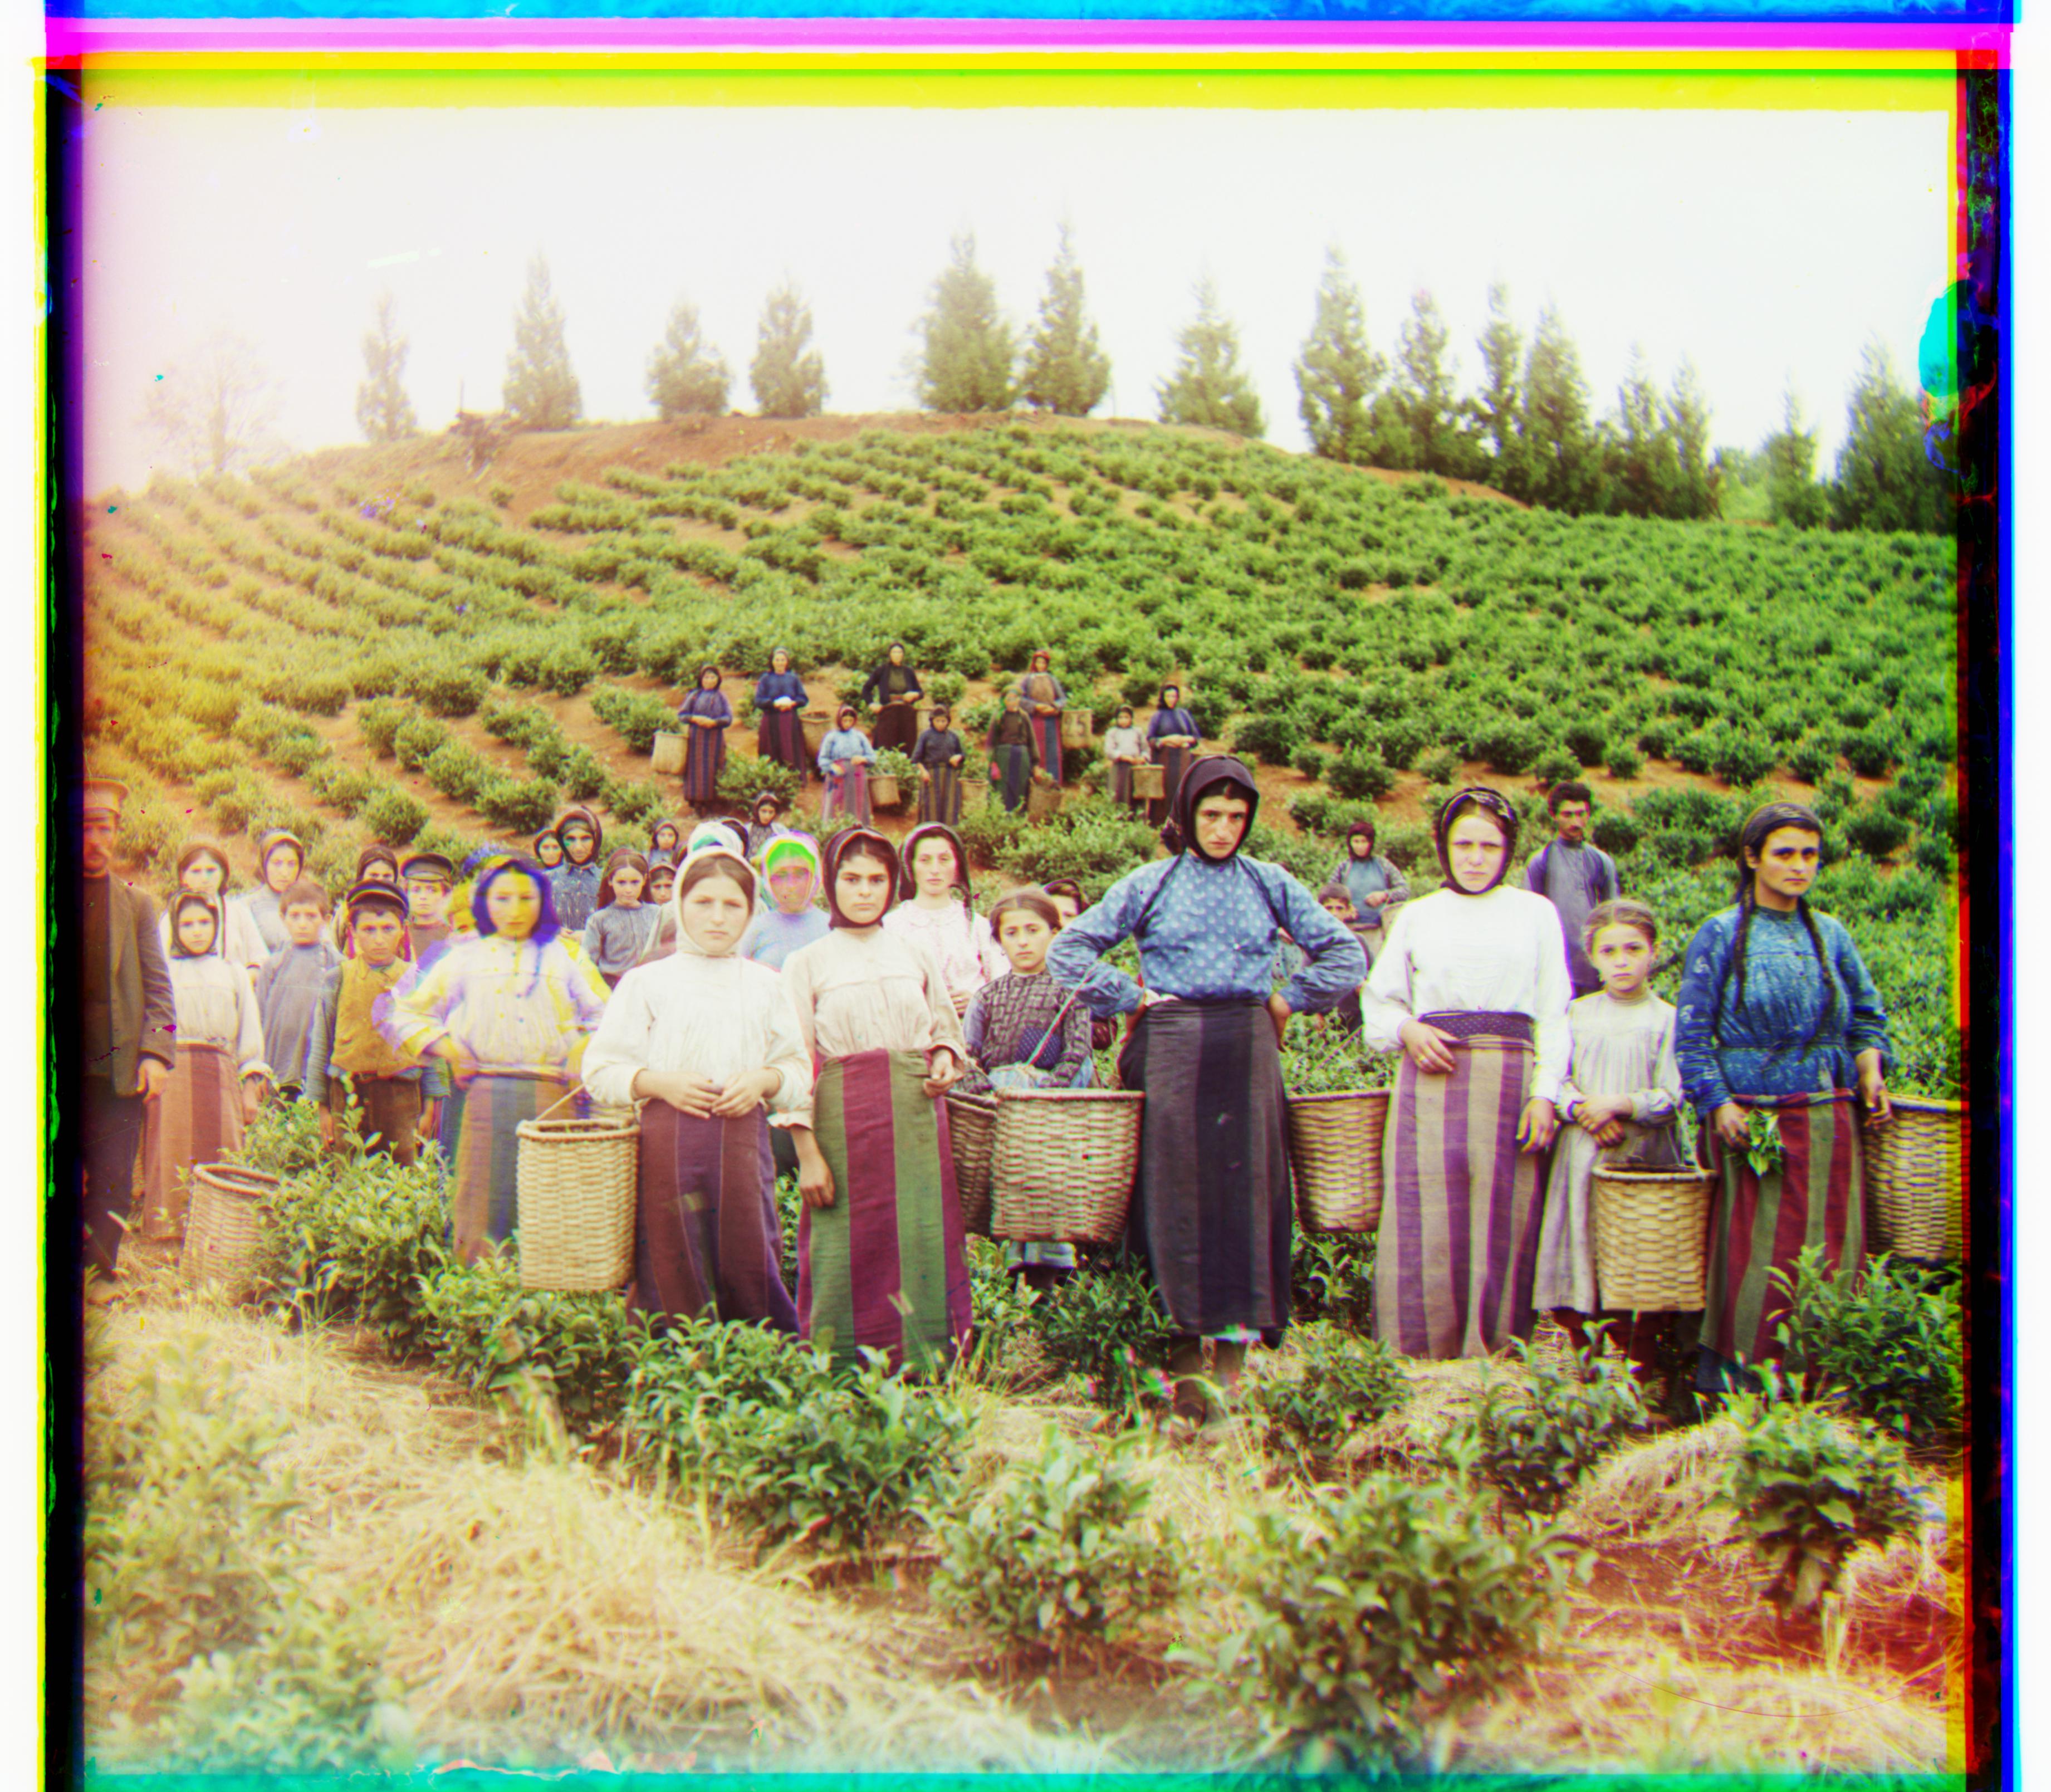
Loss Function: Normalized cross correlation
Green and Blue Displacement: Vertical: 47; Horizontal: 23
Downscaled 4 times during pyramid aligning.
Red and Blue Displacement: Vertical: 236; Horizontal: -198
Downscaled 4 times during pyramid aligning.
This solution actually required me to use an edge detector. For the original image without edge detection, please refer to the bells and whistles sections for the comparison betweent the non-edge detection image and the enhanced image.
Loss Function: Normalized cross correlation
Green and Blue Displacement: Vertical: 40; Horizontal: 18
Downscaled 4 times during pyramid aligning.
Red and Blue Displacement: Vertical: 88; Horizontal: 23
Downscaled 4 times during pyramid aligning.
Loss Function: Normalized cross correlation
Green and Blue Displacement: Vertical: 51; Horizontal: 6
Downscaled 4 times during pyramid aligning.
Red and Blue Displacement: Vertical: 111; Horizontal: 8
Downscaled 4 times during pyramid aligning.
Loss Function: Normalized cross correlation
Green and Blue Displacement: Vertical: 77; Horizontal: 29
Downscaled 4 times during pyramid aligning.
Red and Blue Displacement: Vertical: 175; Horizontal: 37
Downscaled 4 times during pyramid aligning.
Note: for this particular image, I had to increase the scanning area. For all other images, after downscaling, I would scan a displacement of +/- 8 pixels. But for this image, I search +/- 16 pixels. `MAX_DISP` = 16 this time.
Loss Function: Normalized cross correlation
Green and Blue Displacement: Vertical: 48; Horizontal: 16
Downscaled 4 times during pyramid aligning.
Red and Blue Displacement: Vertical: 108; Horizontal: 11
Downscaled 4 times during pyramid aligning.
Loss Function: Normalized cross correlation
Green and Blue Displacement: Vertical: 42; Horizontal: 6
Downscaled 4 times during pyramid aligning.
Red and Blue Displacement: Vertical: 84; Horizontal: 32
Downscaled 4 times during pyramid aligning.
Loss Function: Normalized cross correlation
Green and Blue Displacement: Vertical: 56; Horizontal: 22
Downscaled 4 times during pyramid aligning.
Red and Blue Displacement: Vertical: 116; Horizontal: 28
Downscaled 4 times during pyramid aligning.
Loss Function: Normalized cross correlation
Green and Blue Displacement: Vertical: 64; Horizontal: 12
Downscaled 4 times during pyramid aligning.
Red and Blue Displacement: Vertical: 136; Horizontal: 22
Downscaled 4 times during pyramid aligning.
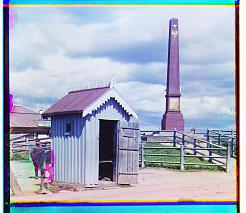
Loss Function: Normalized cross correlation
Green and Blue Displacement: Vertical: 70; Horizontal: -3
Downscaled 4 times during pyramid aligning.
Red and Blue Displacement: Vertical: 121; Horizontal: -23
Downscaled 4 times during pyramid aligning.
Link: http://www.loc.gov/pictures/collection/prok/item/prk2000000005/
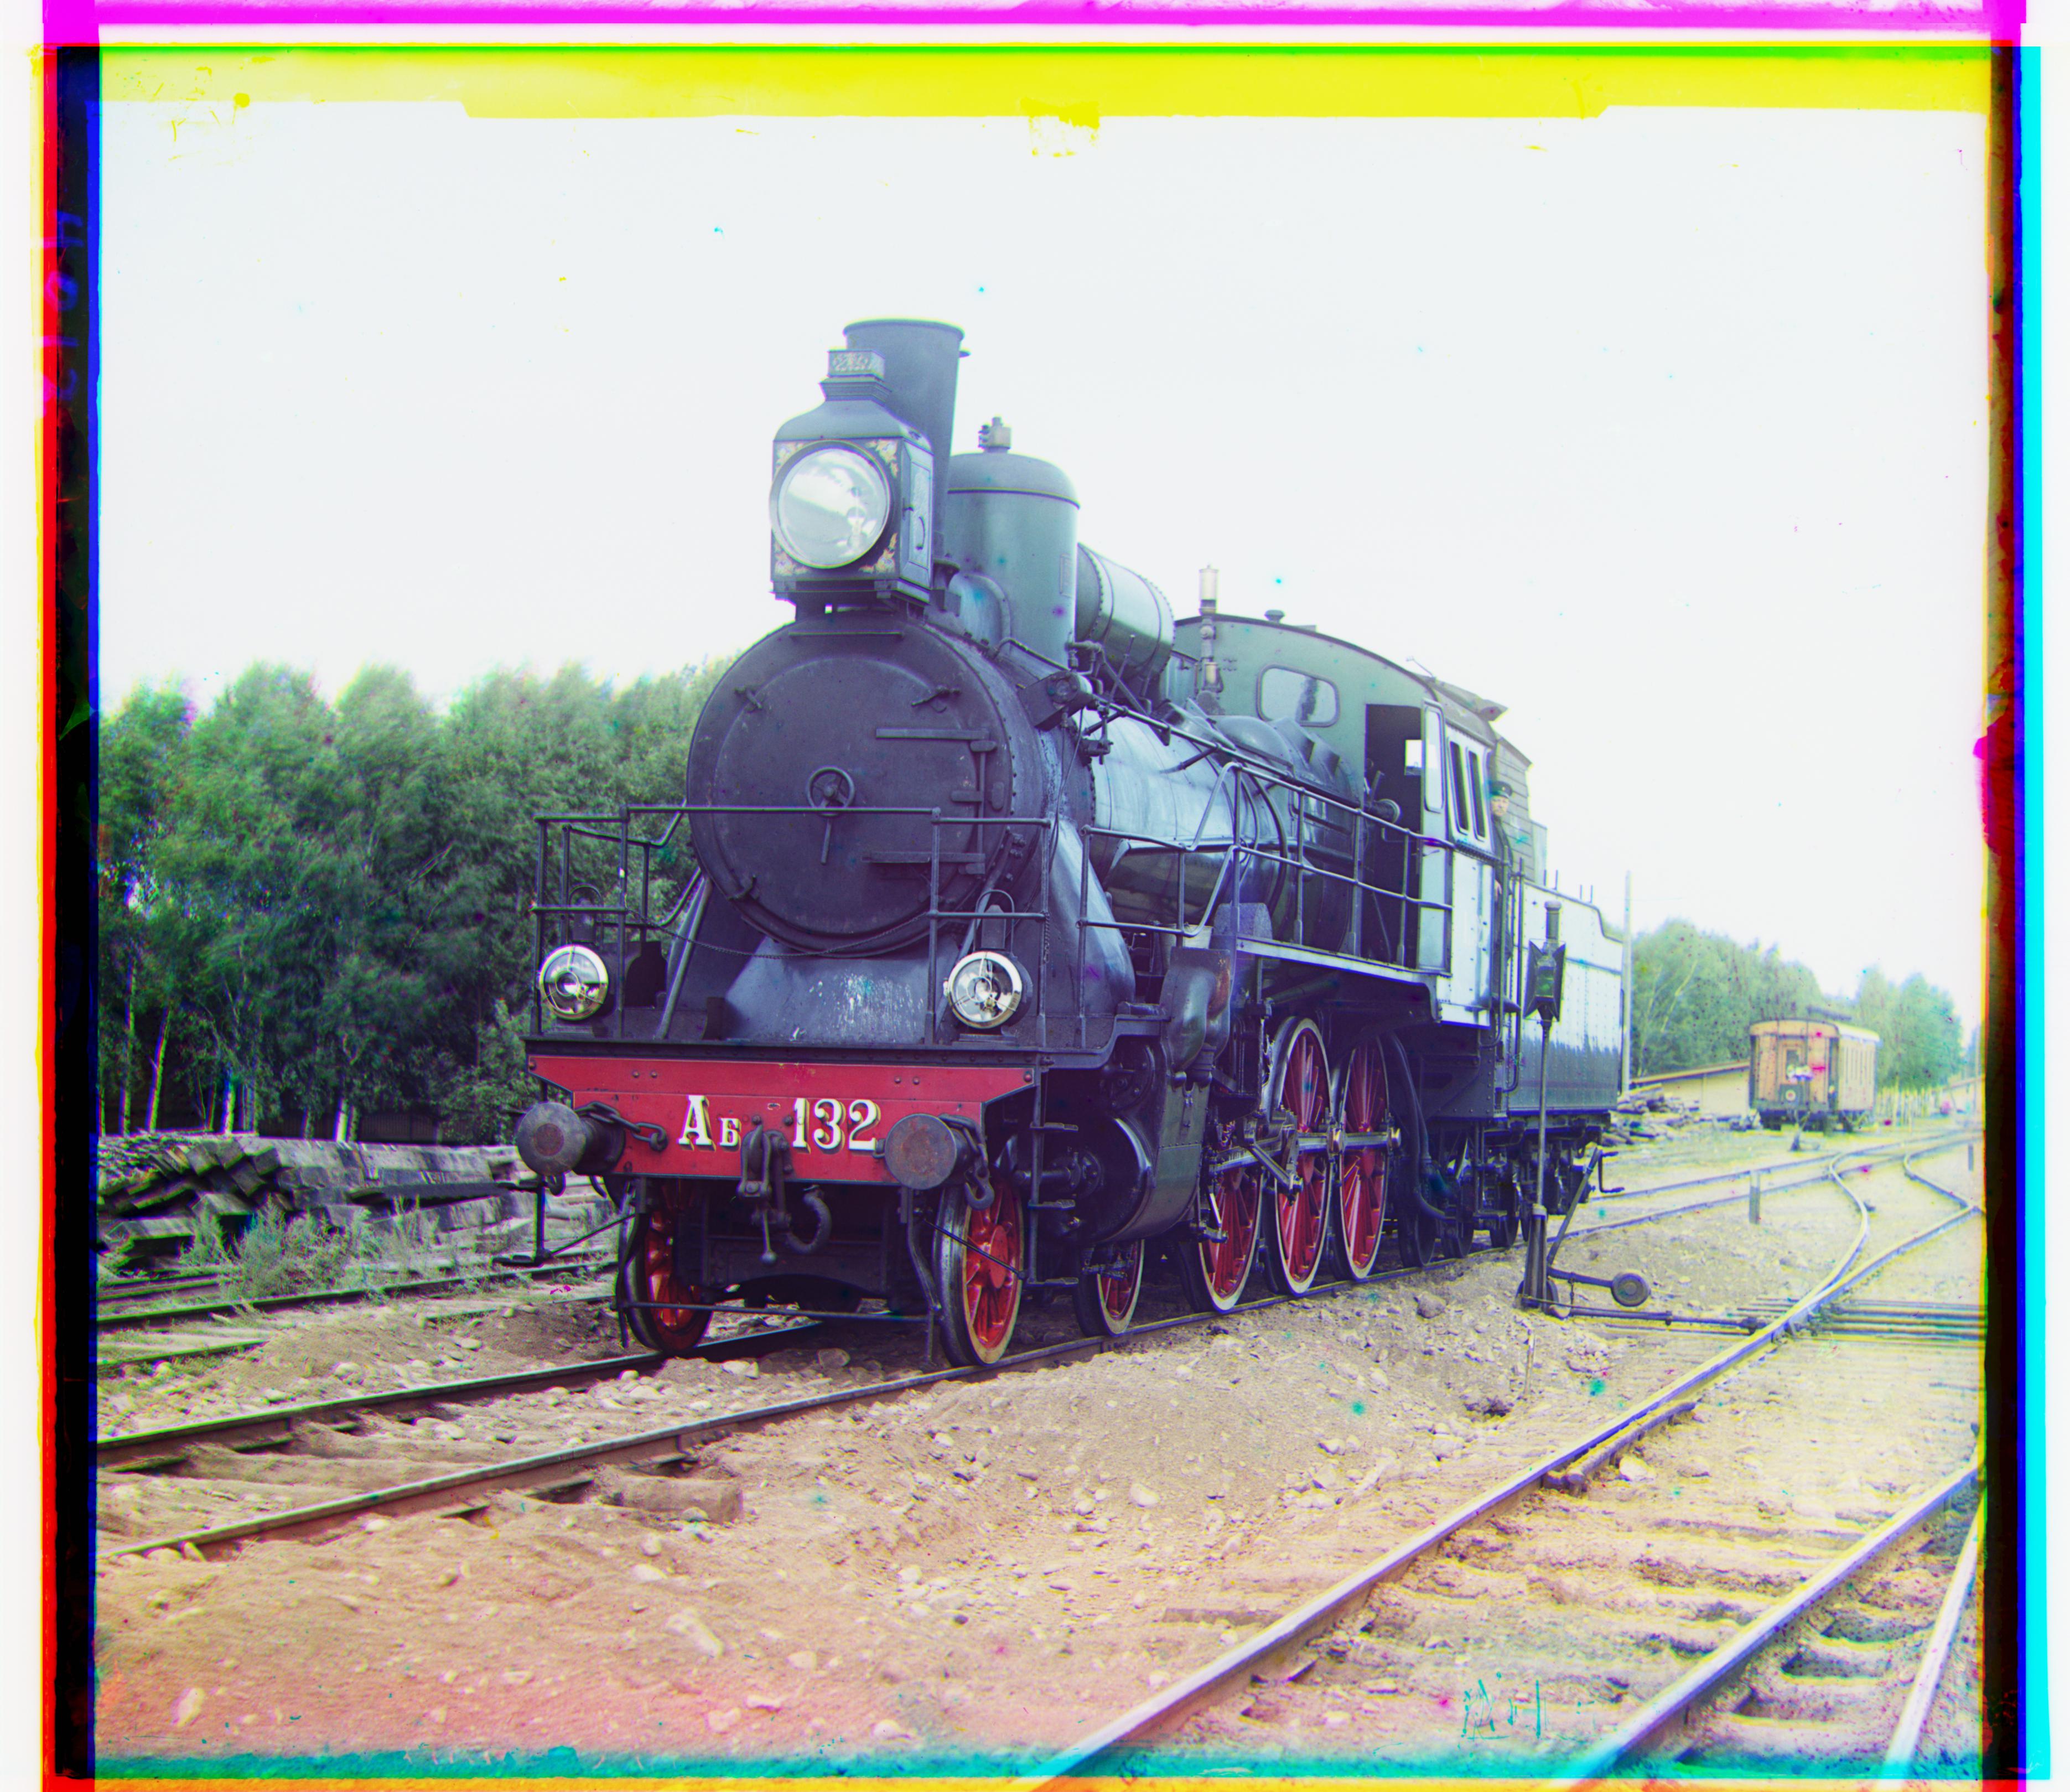
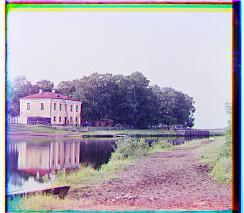
Loss Function: Normalized cross correlation
Green and Blue Displacement: Vertical: 70; Horizontal: -3
Downscaled 4 times during pyramid aligning.
Red and Blue Displacement: Vertical: 121; Horizontal: -23
Downscaled 4 times during pyramid aligning.
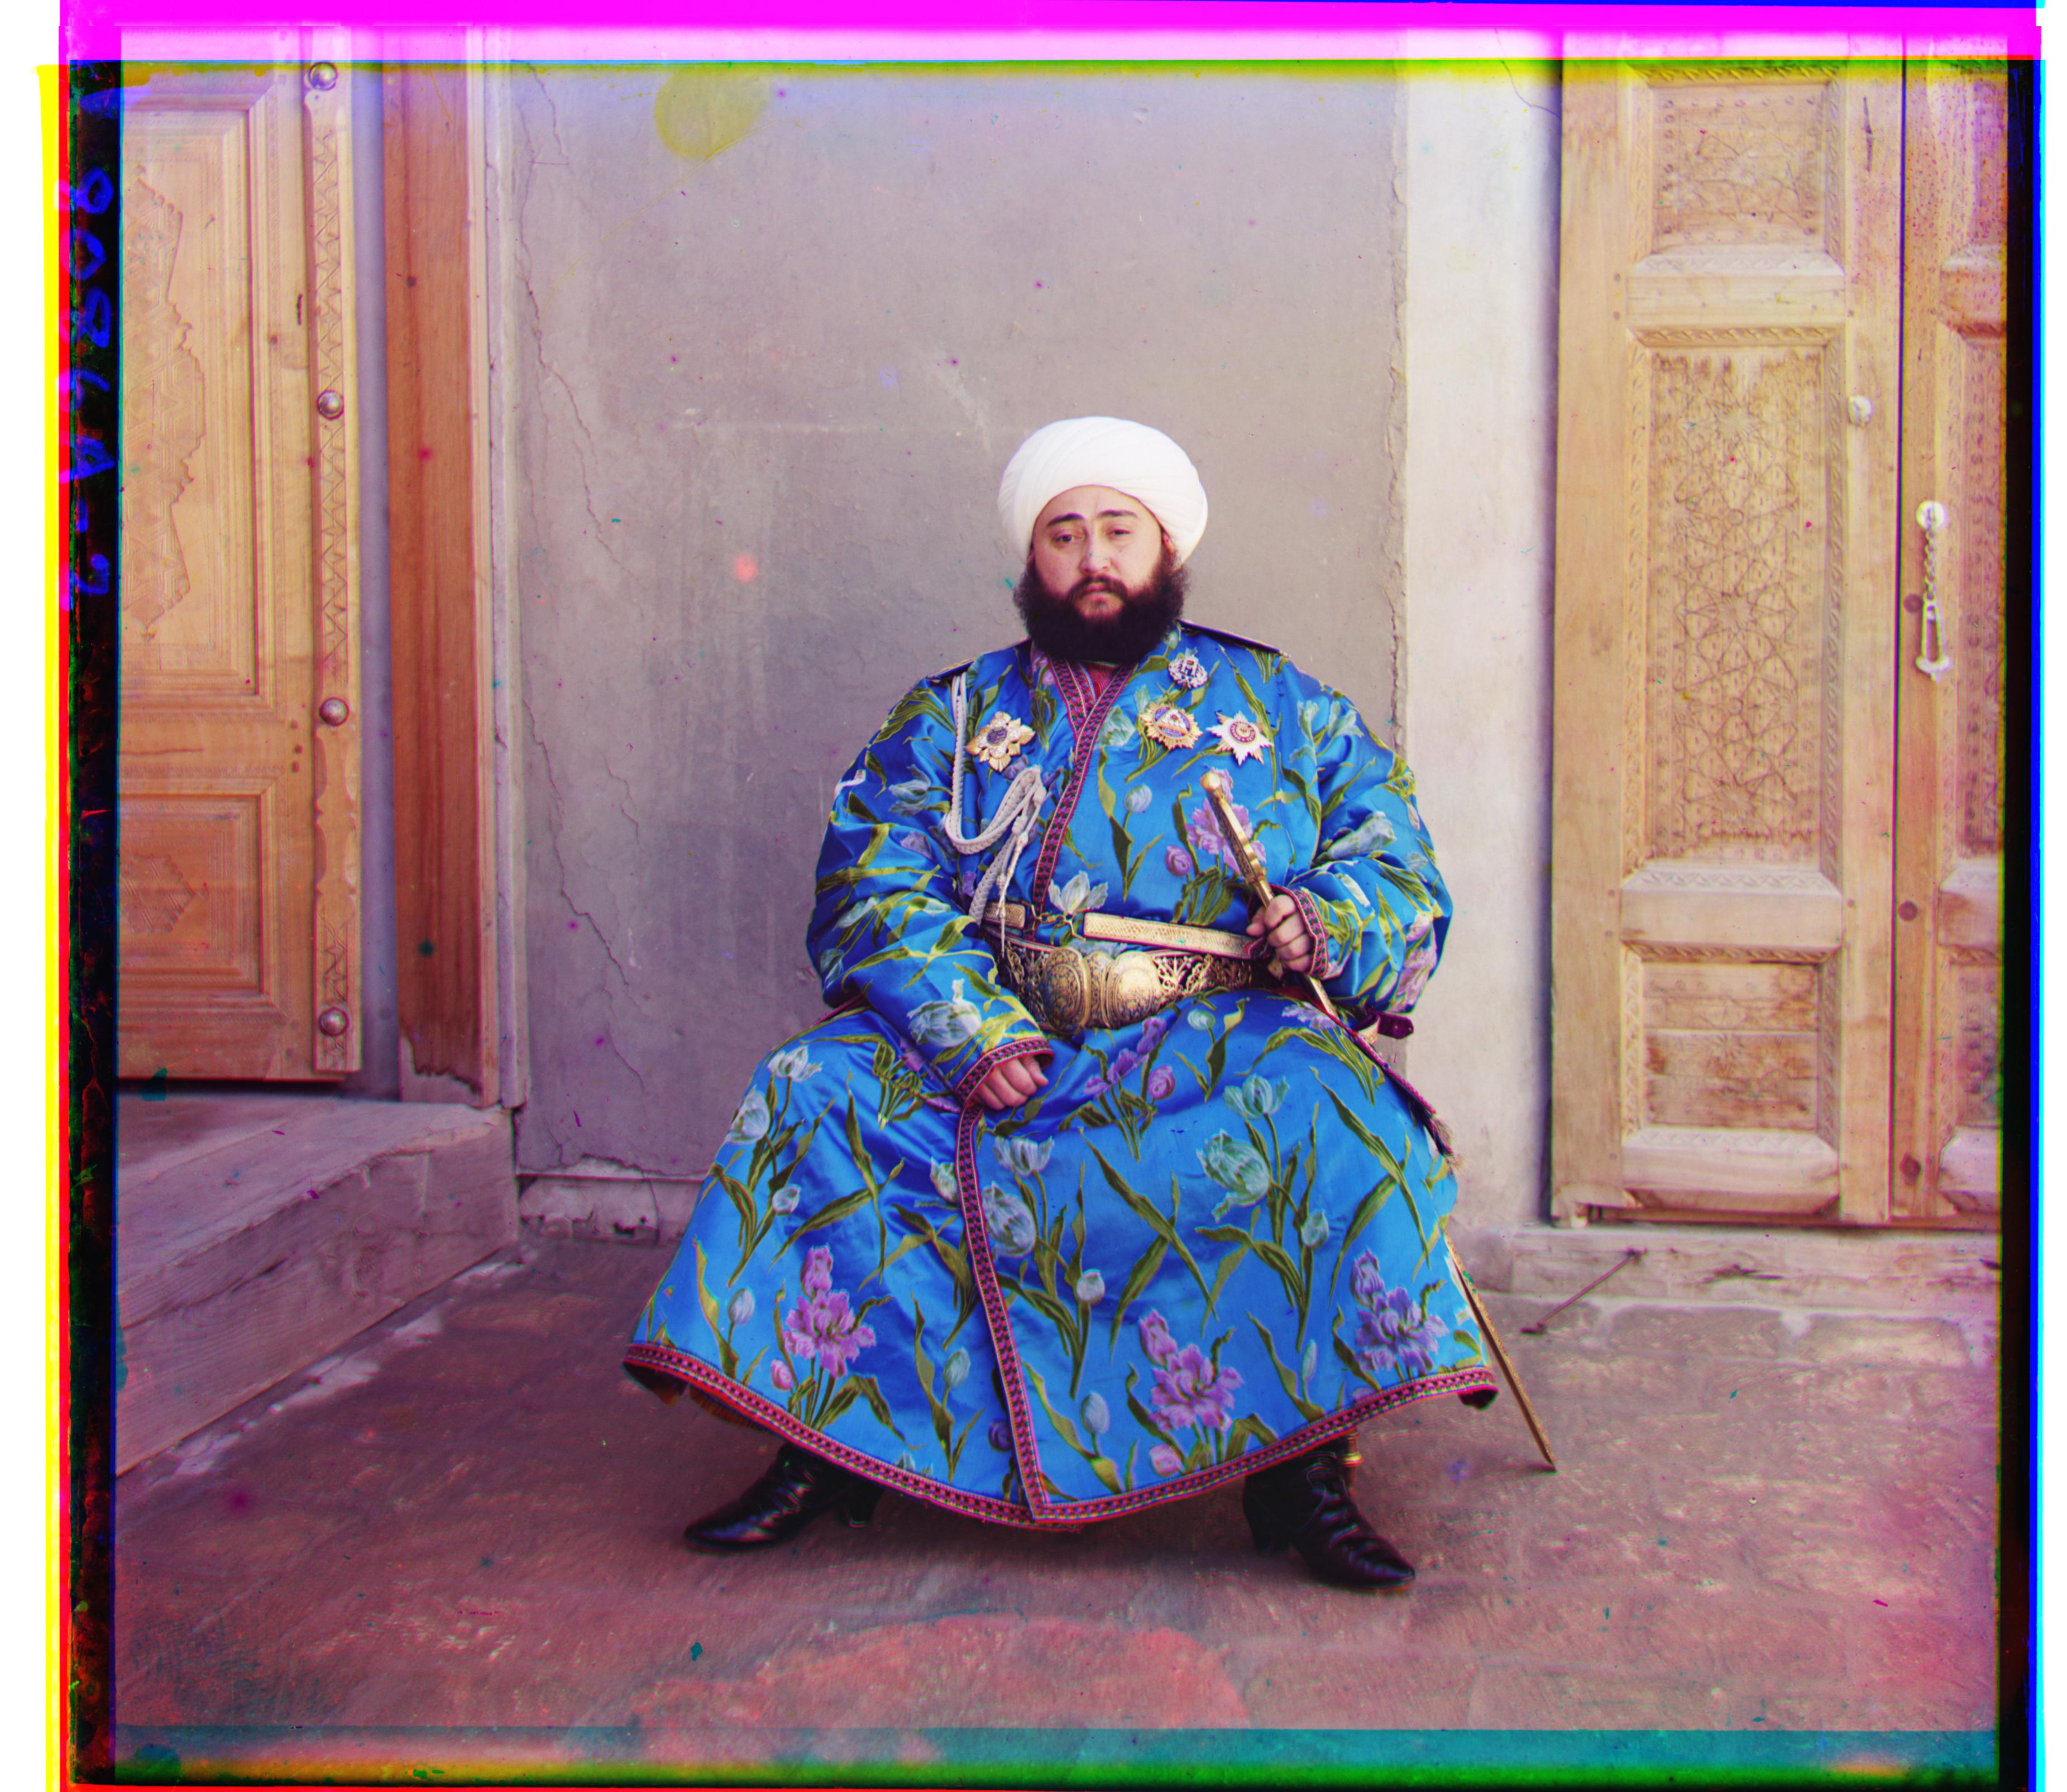
Note: this is at the Ministry of Communication and Transportation at Belyie Ozerki
Loss Function: Normalized cross correlation
Green and Blue Displacement: Vertical: 1; Horizontal: -1
Downscaled 4 times during pyramid aligning.
Red and Blue Displacement: Vertical: 7; Horizontal: -2
Downscaled 4 times during pyramid aligning.
Original Aligned Emir (no edge detection)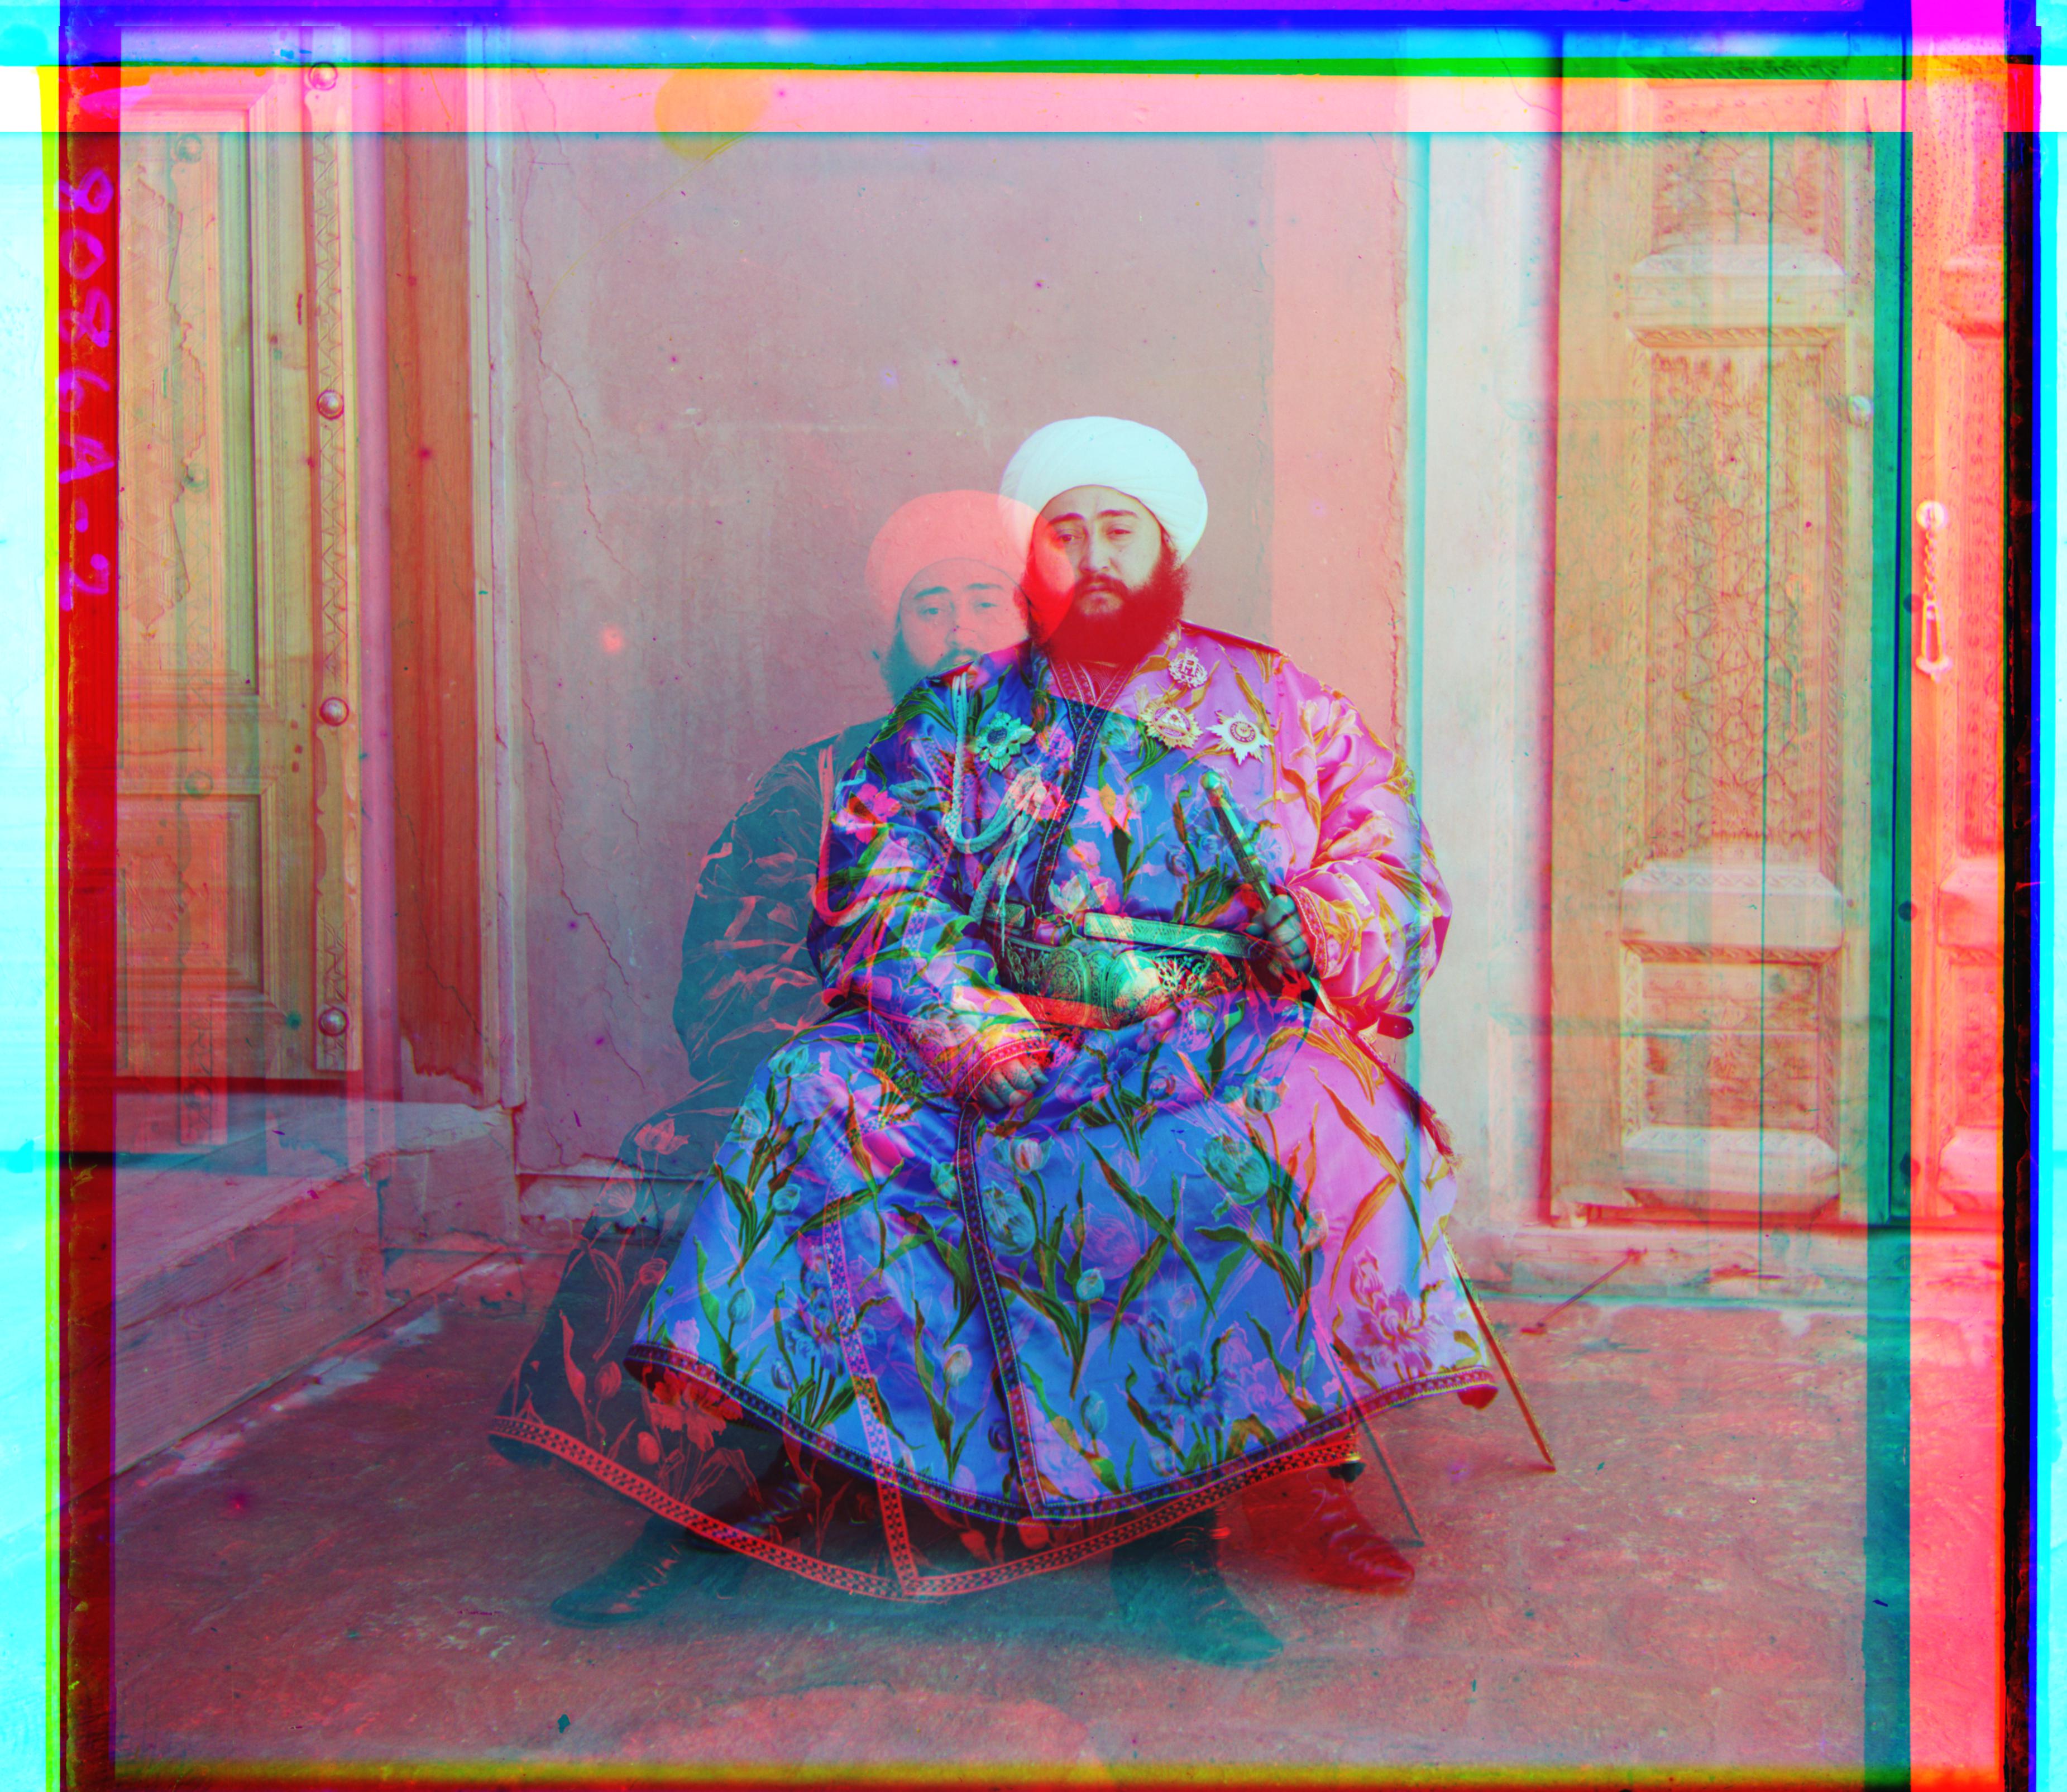
Loss Function: Normalized cross correlation Green and Blue Displacement: Vertical: 47; Horizontal: 23 Downscaled 4 times during pyramid aligning. Red and Blue Displacement: Vertical: 236; Horizontal: -198 Downscaled 4 times during pyramid aligning. |
Aligned Emir (with Canny edge detection)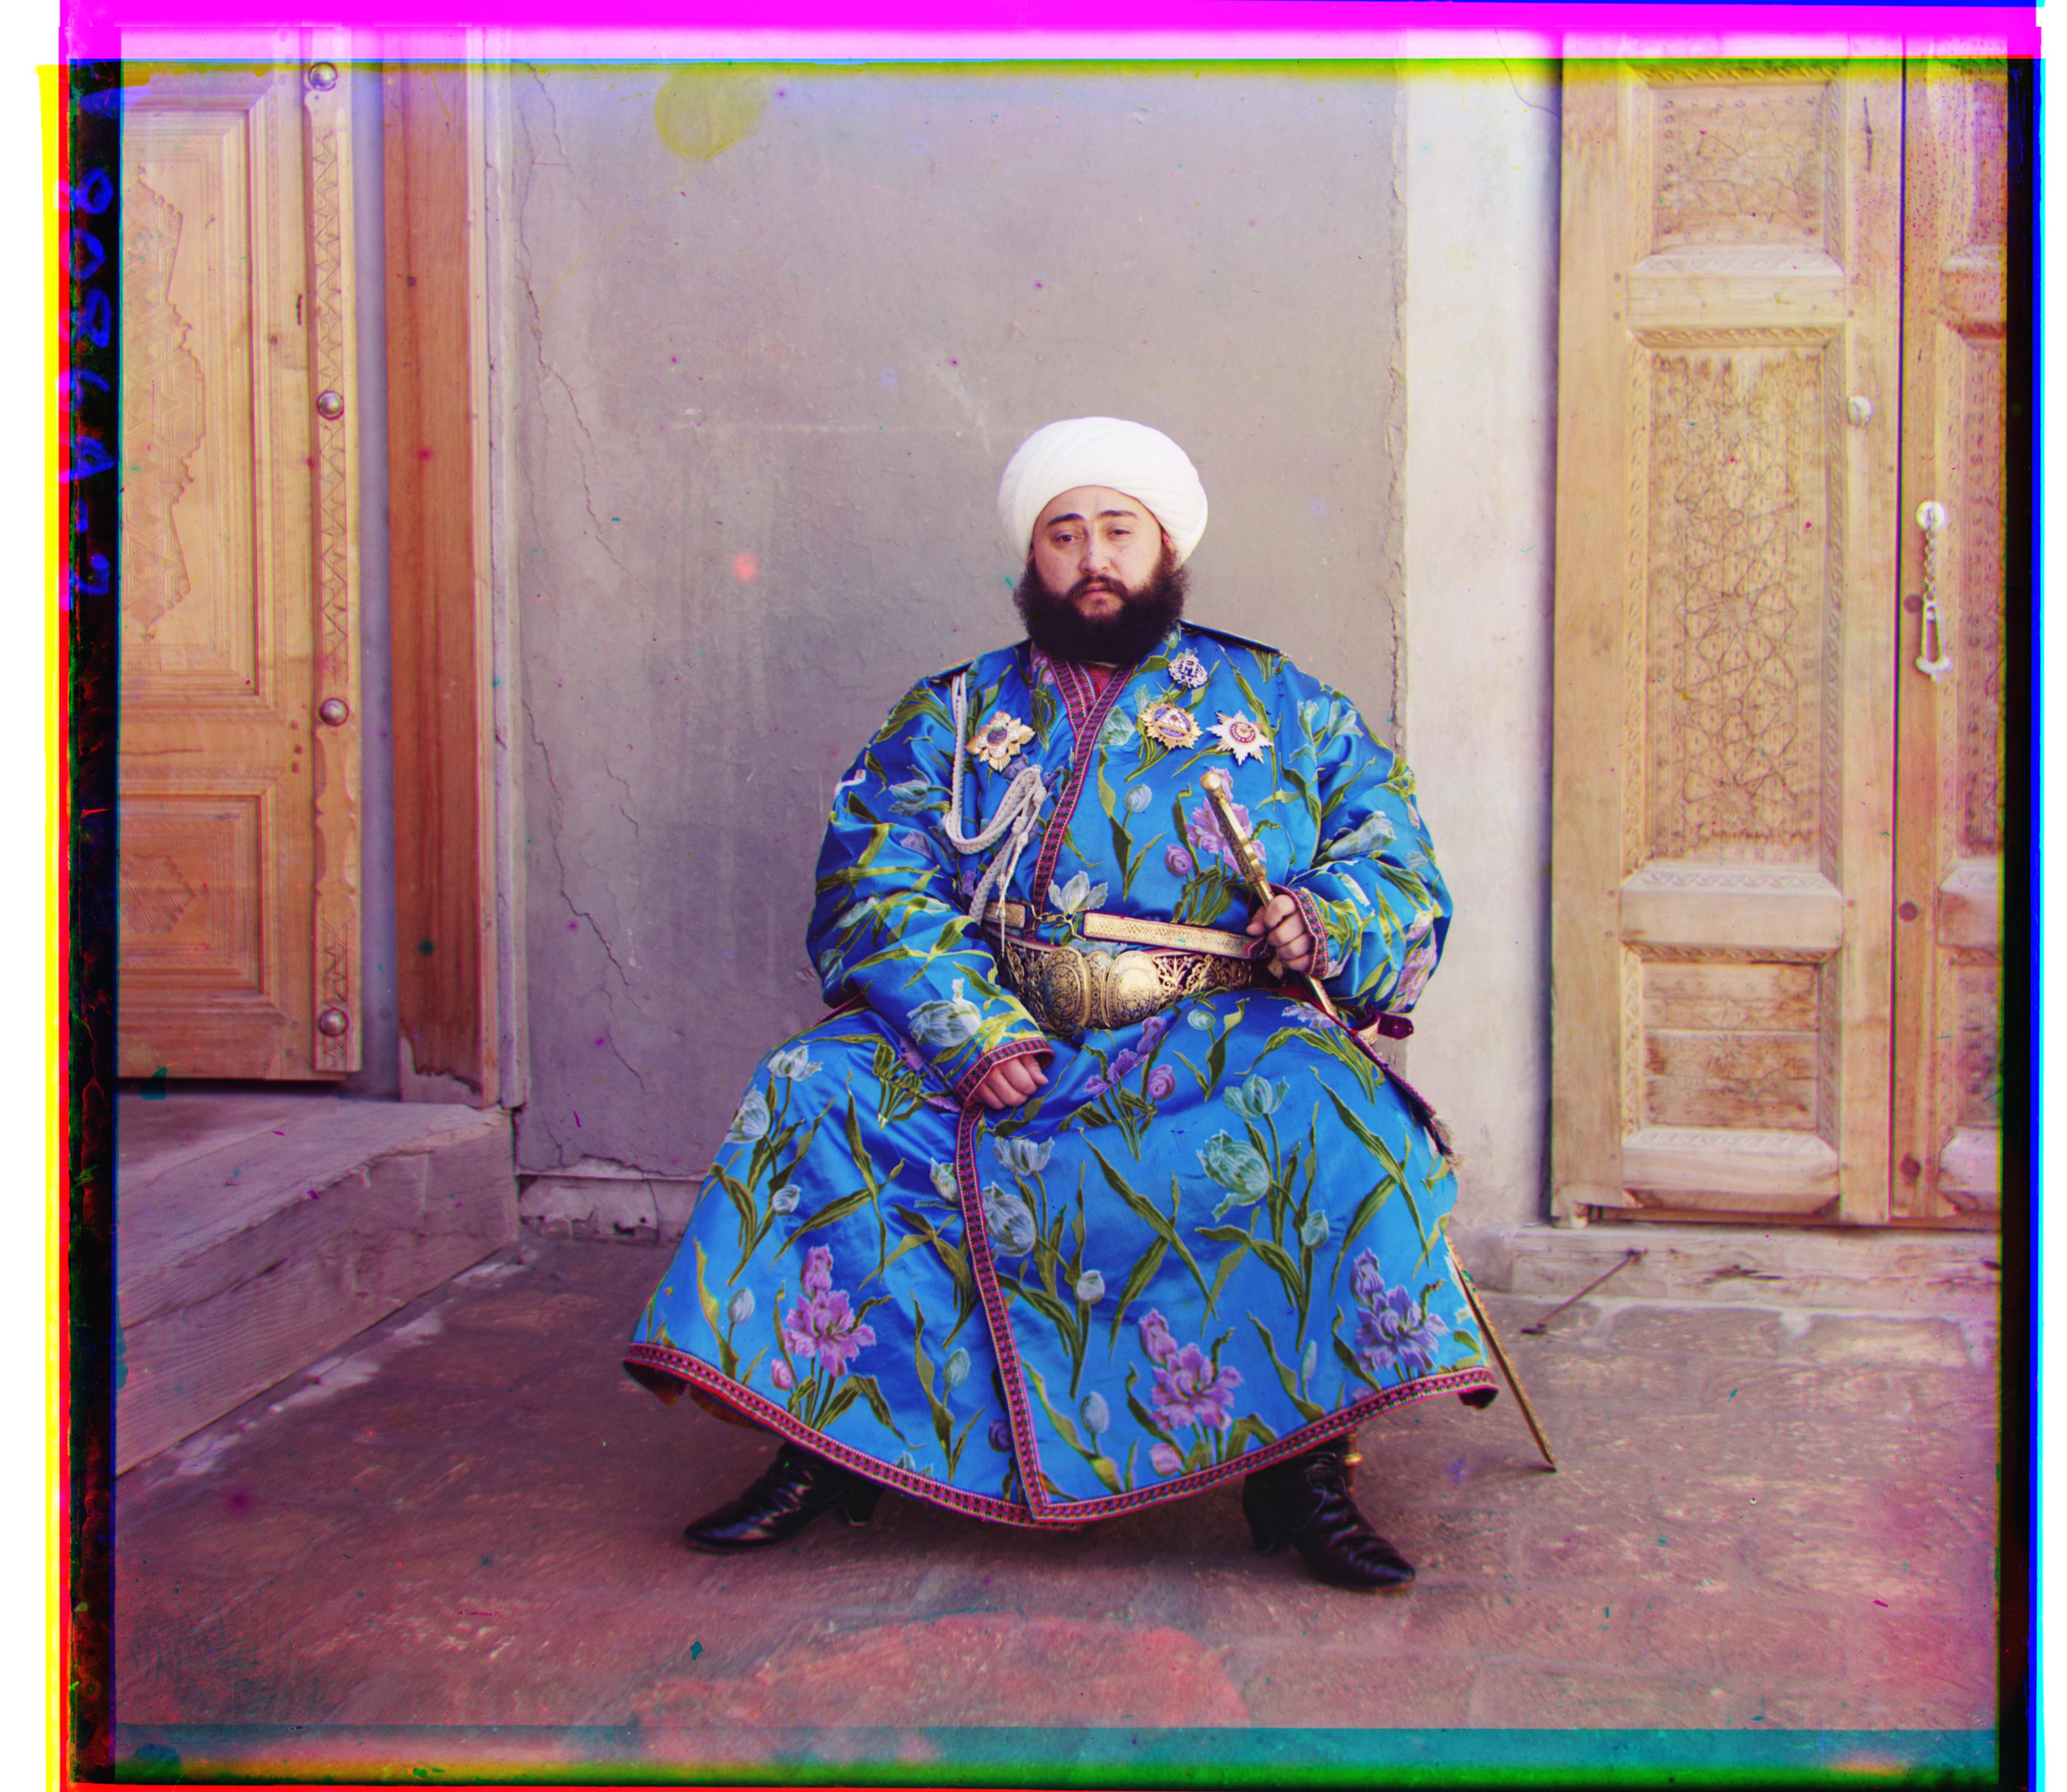
Loss Function: Normalized cross correlation Green and Blue Displacement: Vertical: 48; Horizontal: 23 Downscaled 4 times during pyramid aligning. Red and Blue Displacement: Vertical: 105; Horizontal: 40 Downscaled 4 times during pyramid aligning. |
Notice how the Green and Blue images were already aligned perfectly originally. The Red and Blue filtered images are the problem. Once we take an image with everything filtered except its edges, it works. Let's take a look at what the edges look like
Emir filtered Red with Canny Edge Detector Applied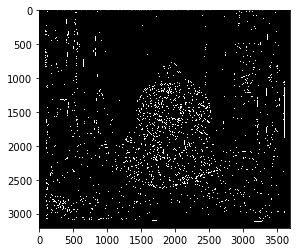
Canny Sigma Parameter: 1 |
Emir filtered Blue with Canny Edge Detector Applied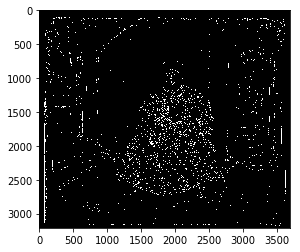
Canny Sigma Parameter: 1 |
Emir filtered Red with Canny Edge Detector Applied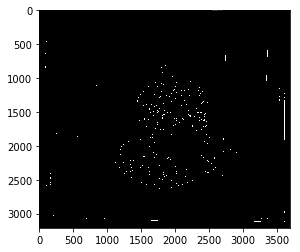
Canny Sigma Parameter: 5 |
Emir filtered Blue with Canny Edge Detector Applied
Canny Sigma Parameter: 1 |
Let's look at the difference in image quality with a sigma of 5 instead of 1
Original Aligned Emir (no edge detection)
Loss Function: Normalized cross correlation Green and Blue Displacement: Vertical: 47; Horizontal: 23 Downscaled 4 times during pyramid aligning. Red and Blue Displacement: Vertical: 236; Horizontal: -198 Downscaled 4 times during pyramid aligning. |
Aligned Emir (with Canny edge detection - Sigma - 5)
Loss Function: Normalized cross correlation Green and Blue Displacement: Vertical: 47; Horizontal: 23 Downscaled 4 times during pyramid aligning. Red and Blue Displacement: Vertical: 107; Horizontal: 40 Downscaled 4 times during pyramid aligning. |
The differences are minimal with this change.
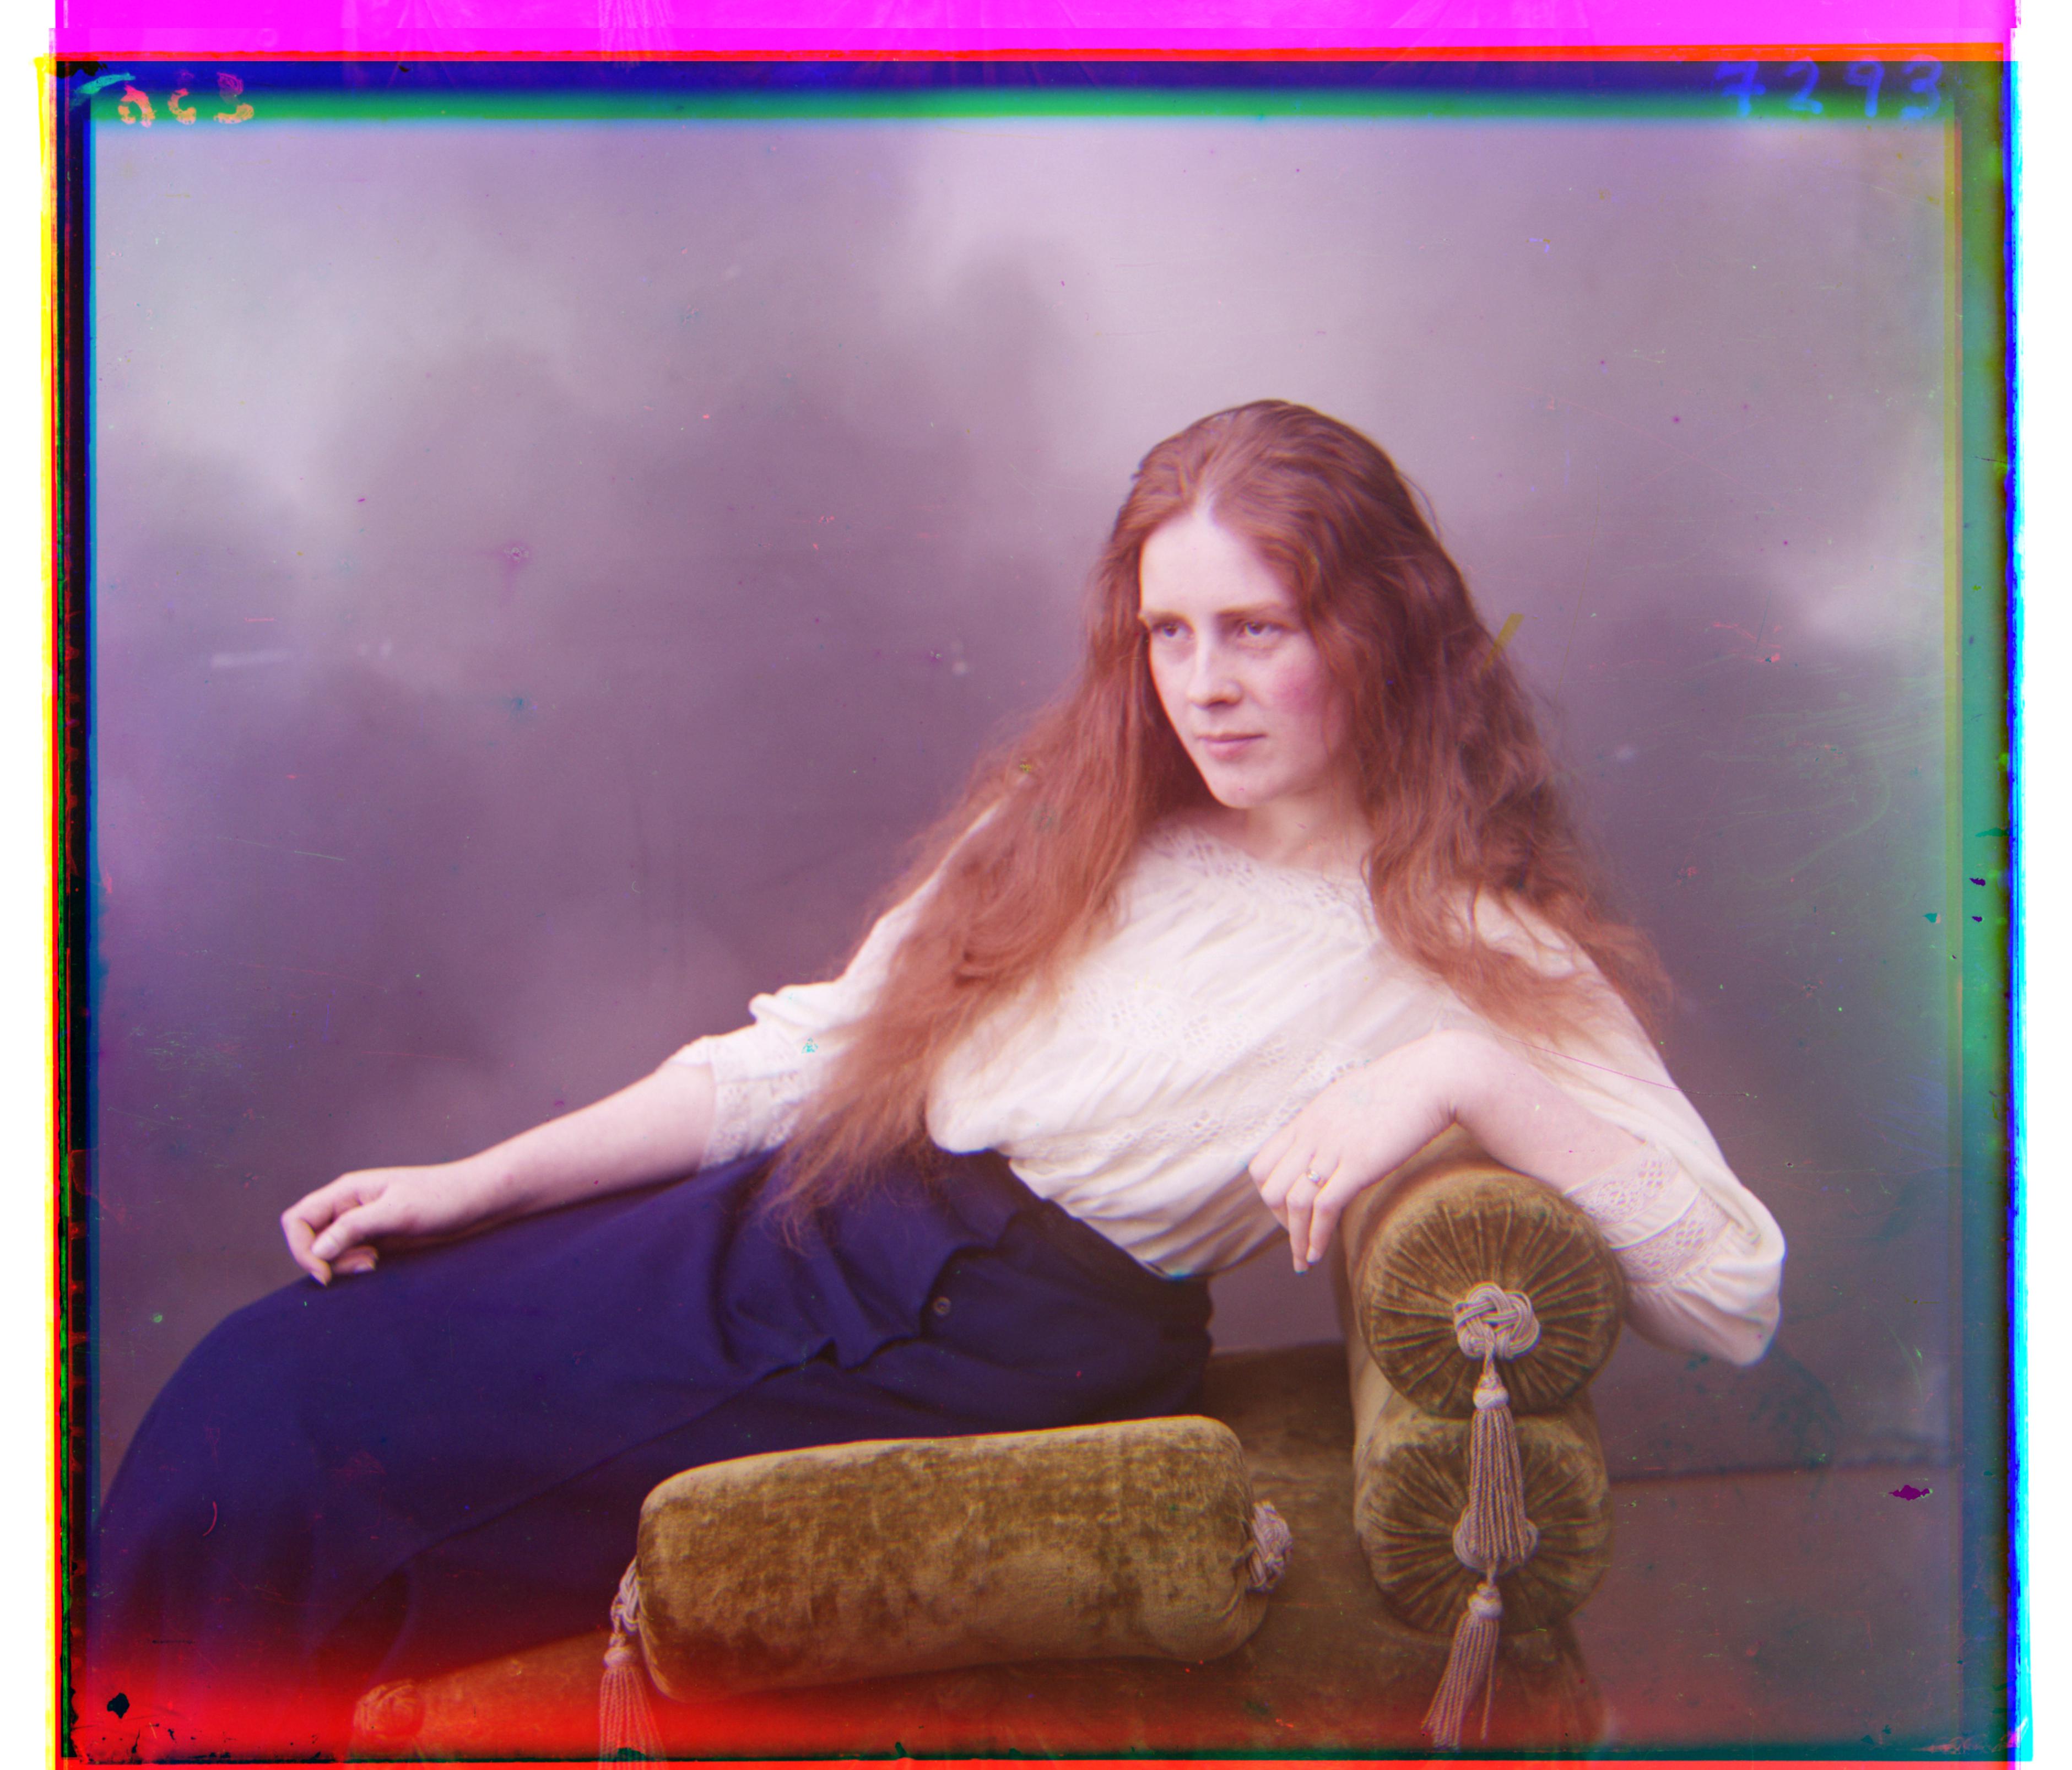
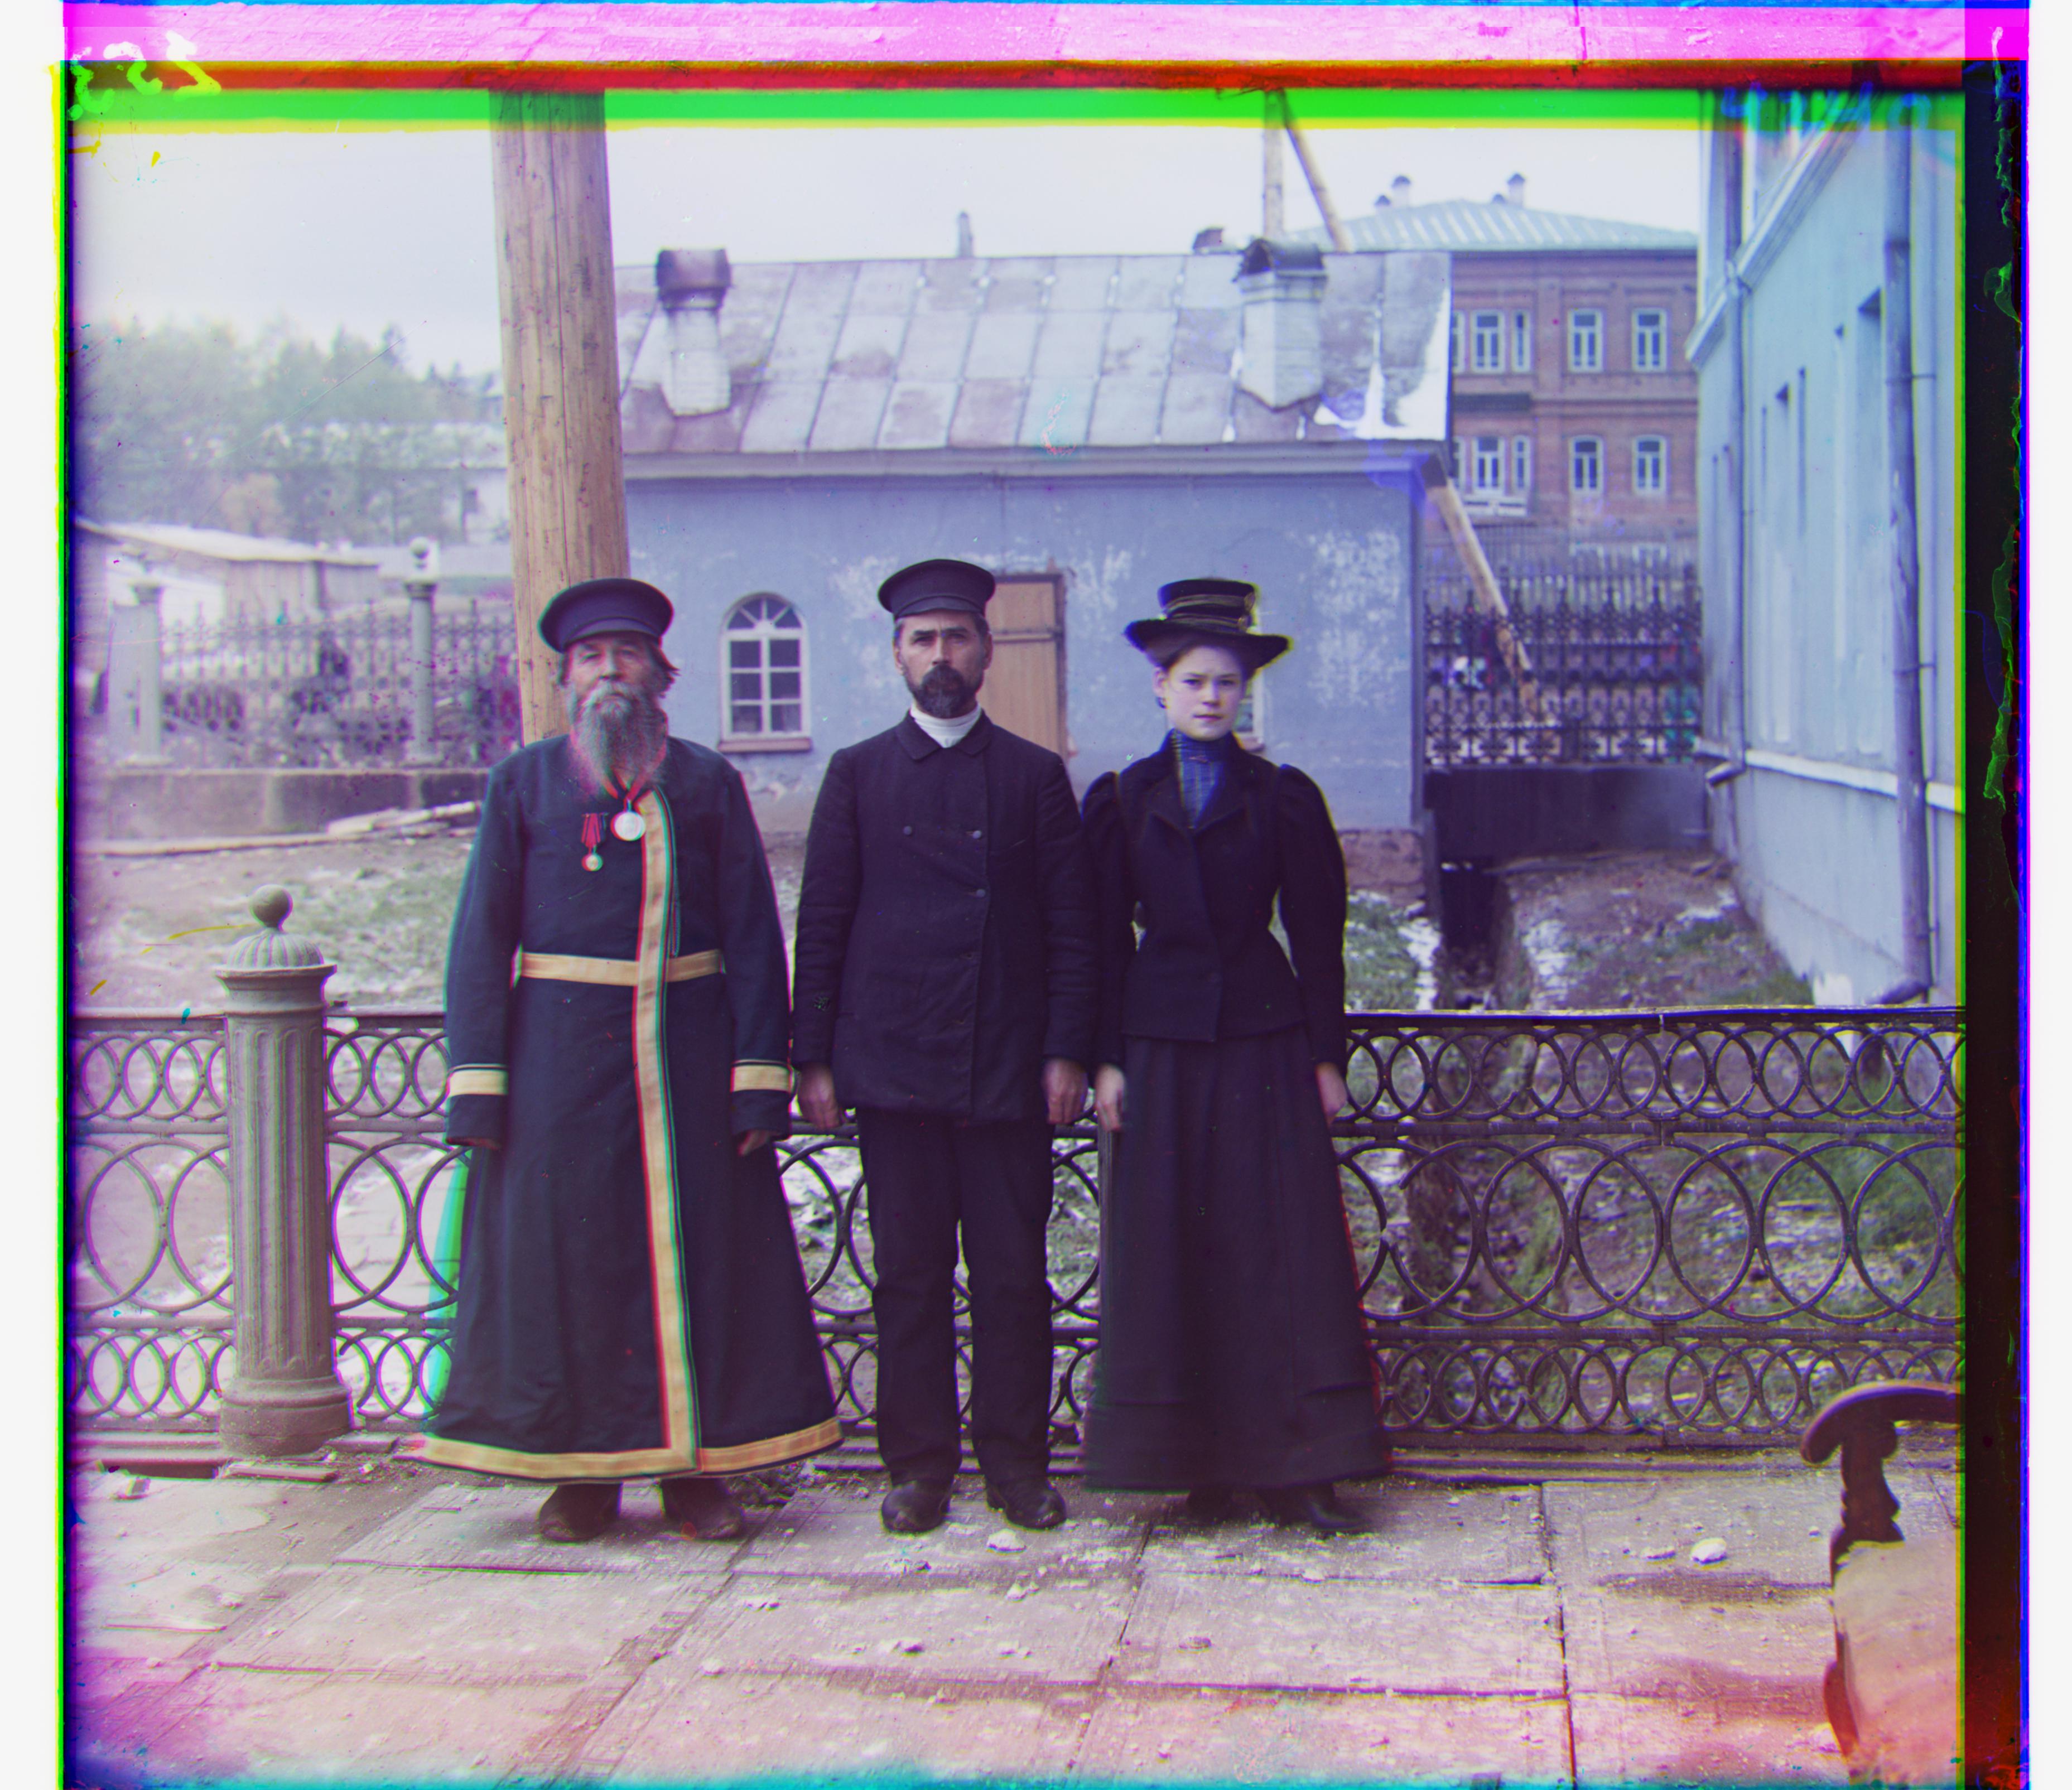
Original Aligned Lady (no Histogram Equalization)
Note: Note that this picture is kind of dim. We can se from a histogram that most of the pixels are centered the lower end of the 0 .. 255 spectrum. |
Aligned Lady (with histogram equalization)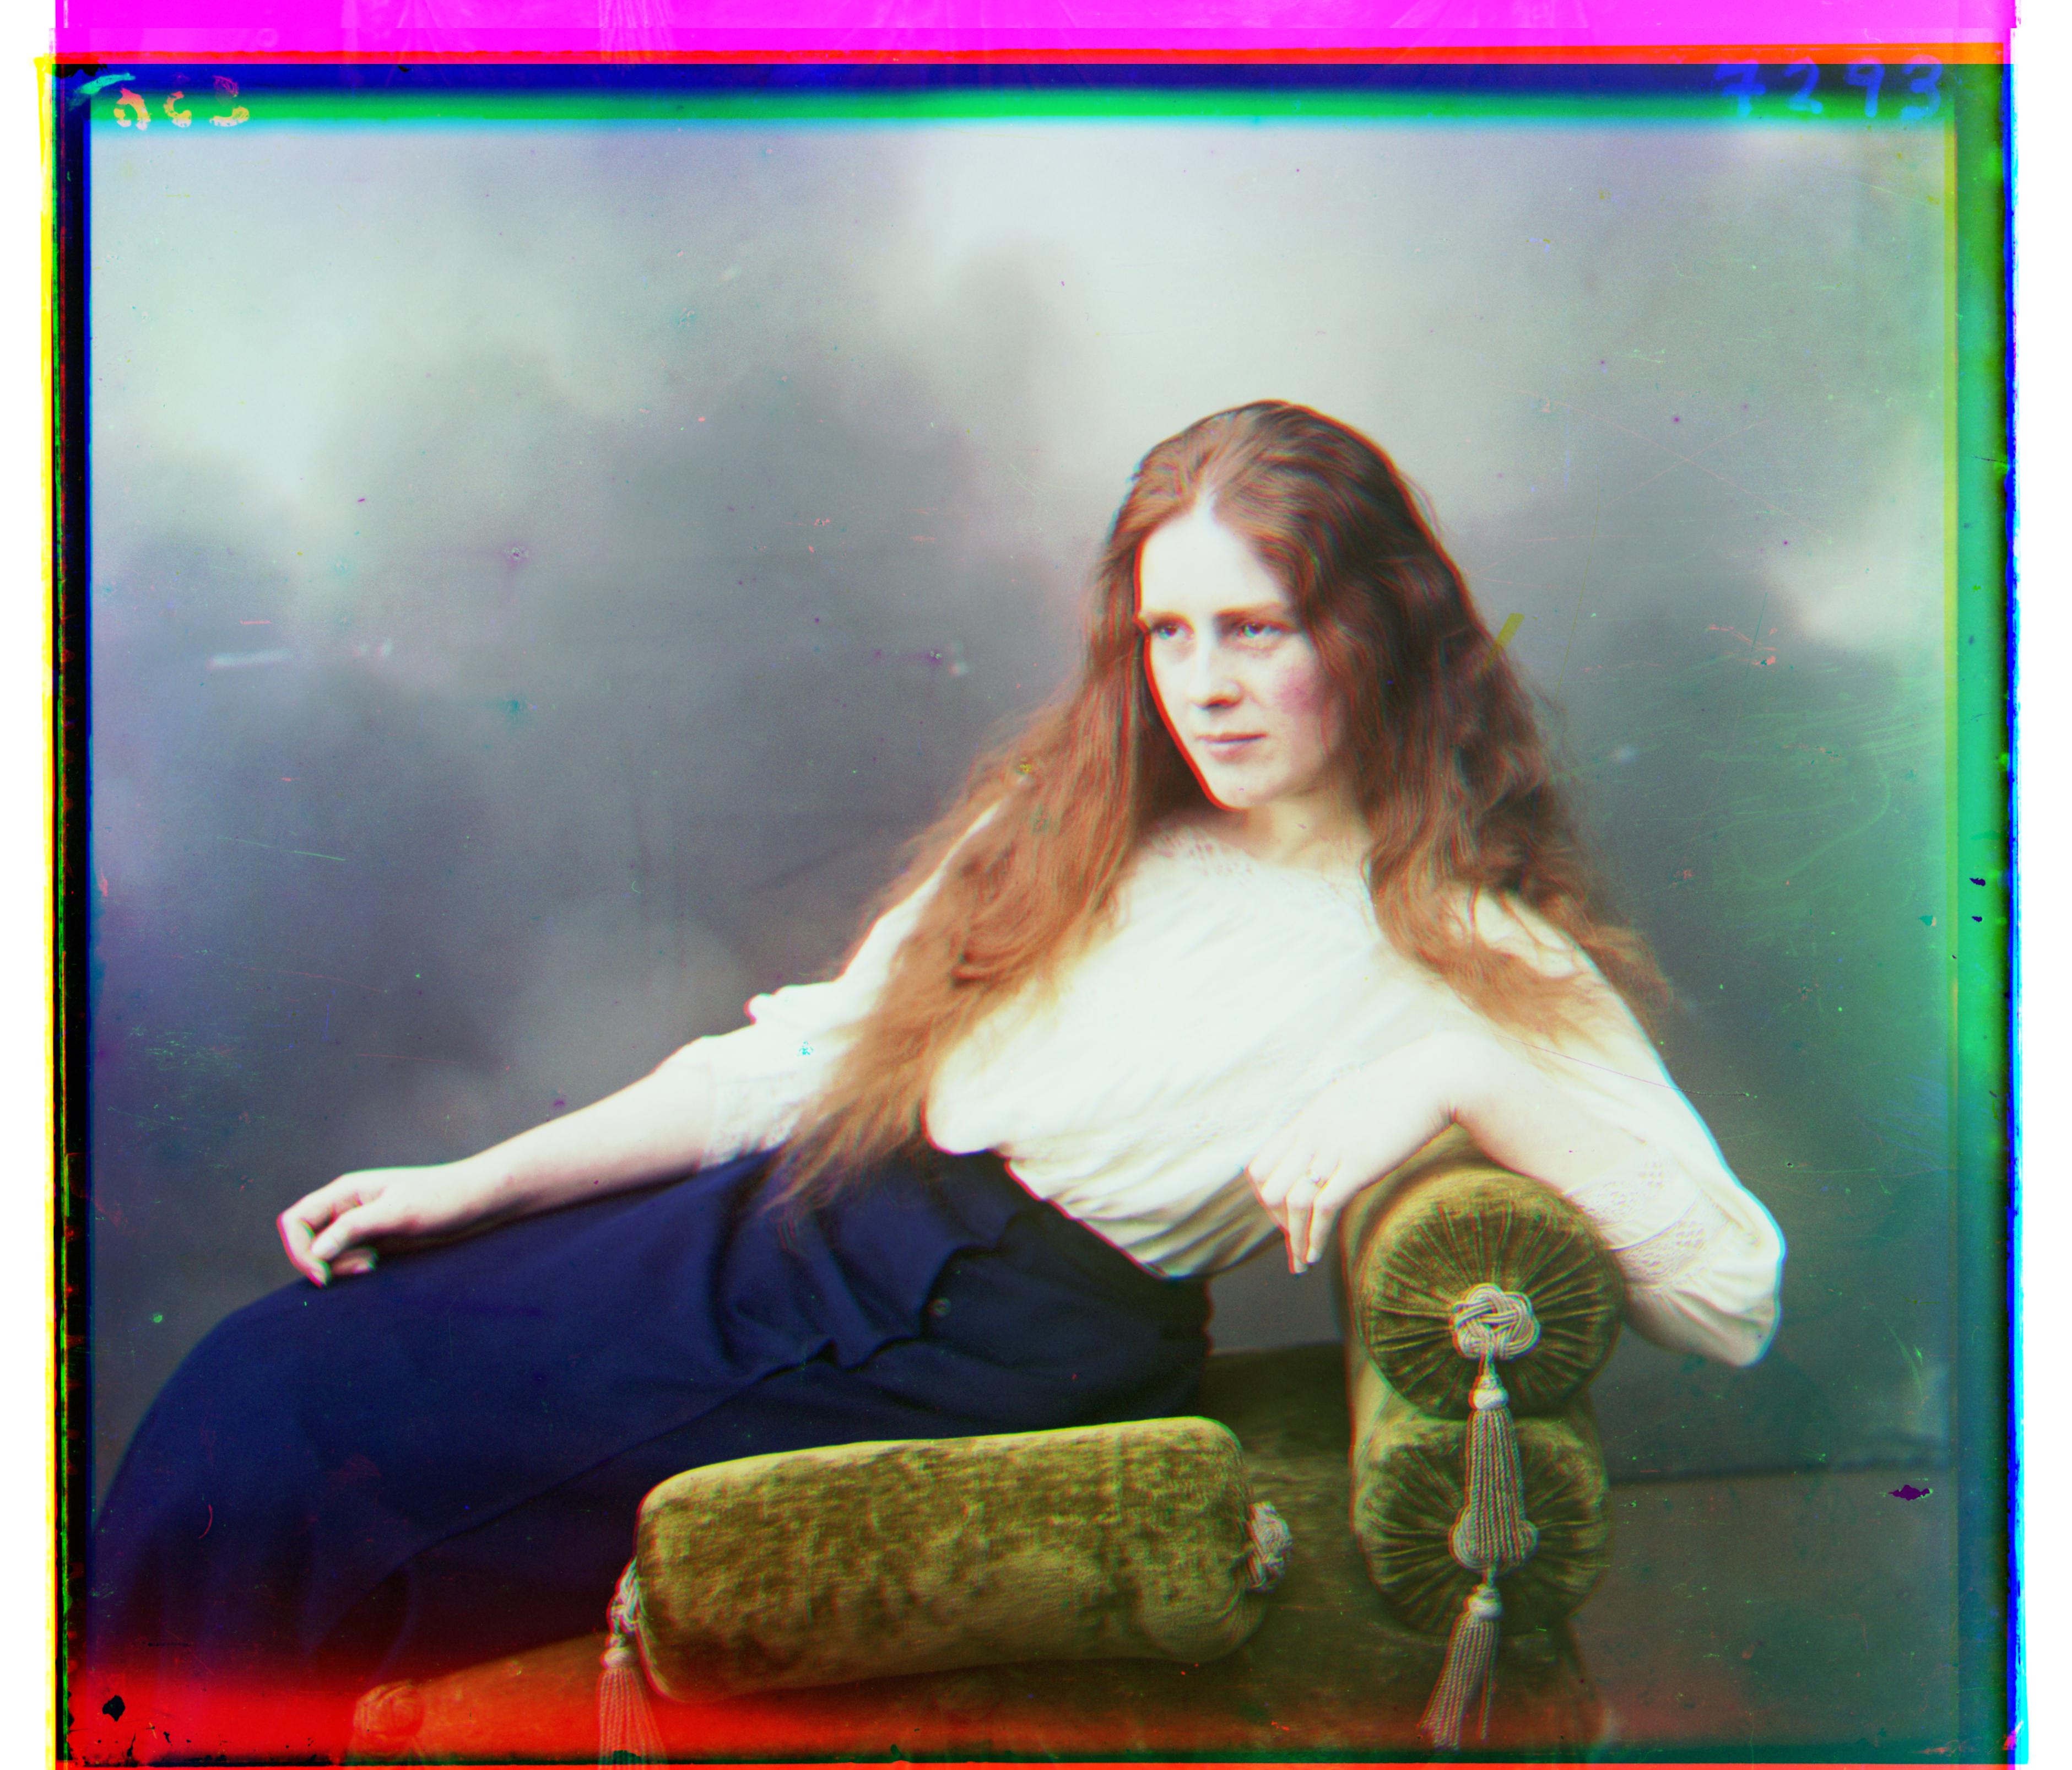
Note: The original images have been equalized |
Note this was implemented using the skimage libraries provided