CS 194-26: Image Manipulation & Computational Photography
Project 3: Face Morphing
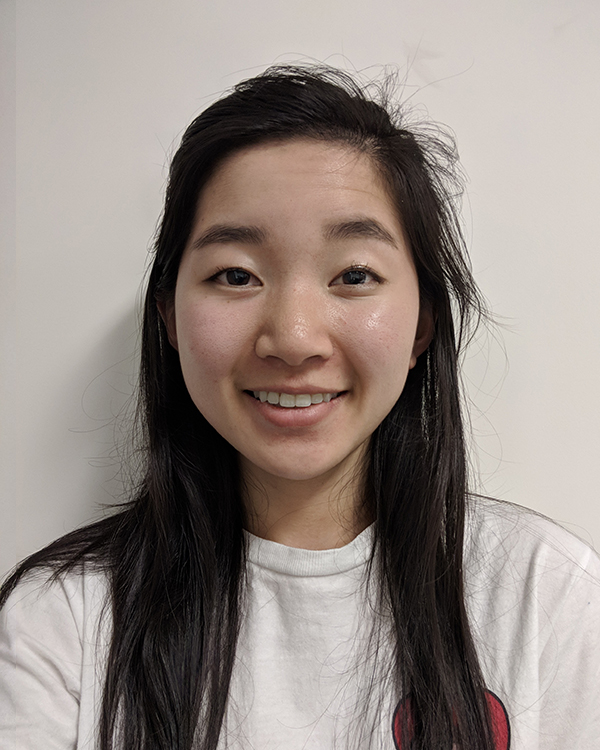
Blending between my faces and theirs
Barbara Yang, cs194-26-aar
Project specs
Course website
Results
Defining Correspondences
Procedure
To create usable data sets across two images, I saved a list of coordinate points on each image, making sure
to keep a consistent order of where I clicked at which index. I saved this list to a .json file so
that
I did not have to re-configure every time I ran my code.
Source data
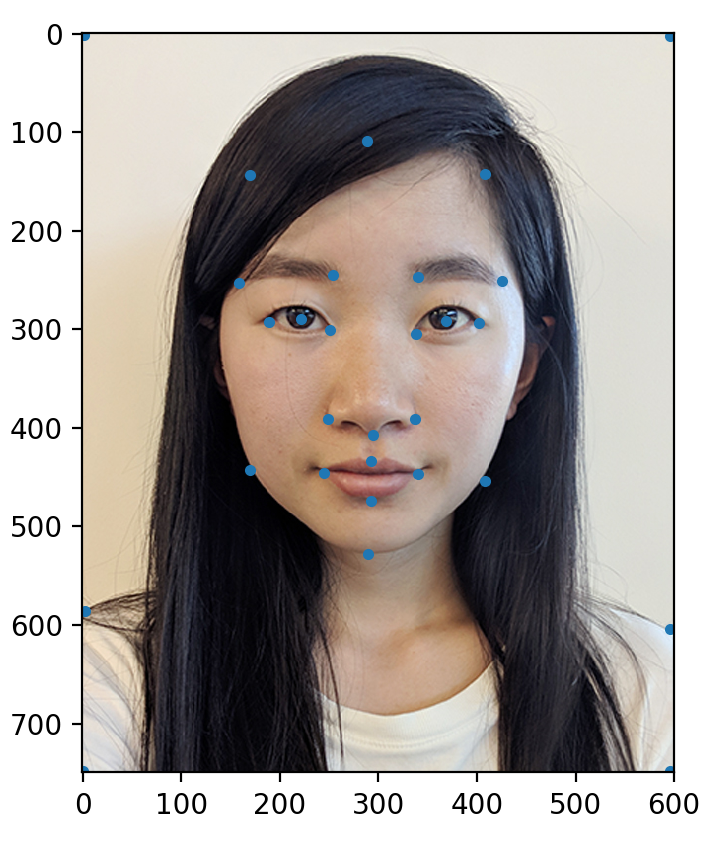
Image 1 points
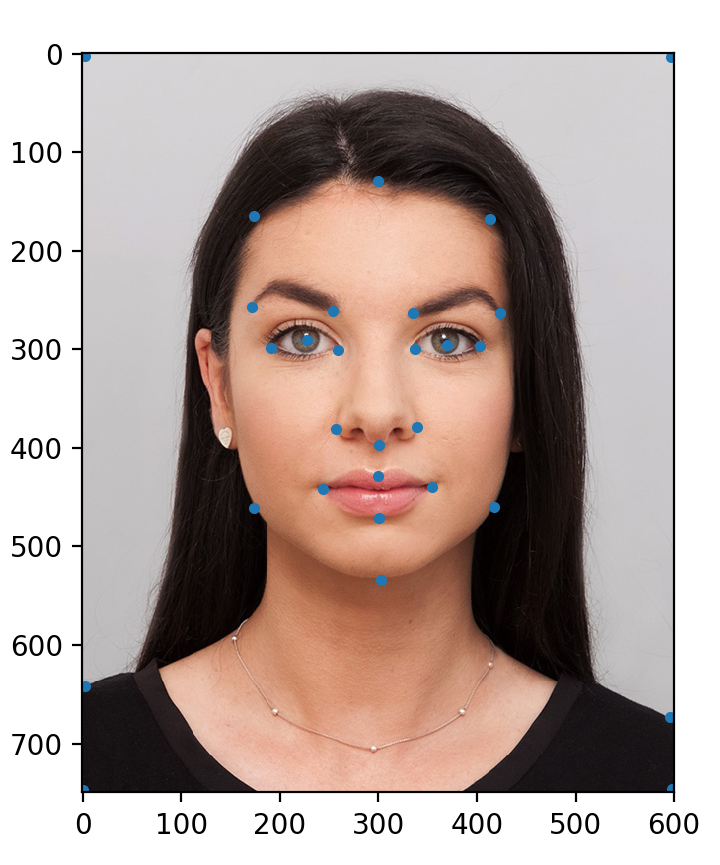
Image 2 points
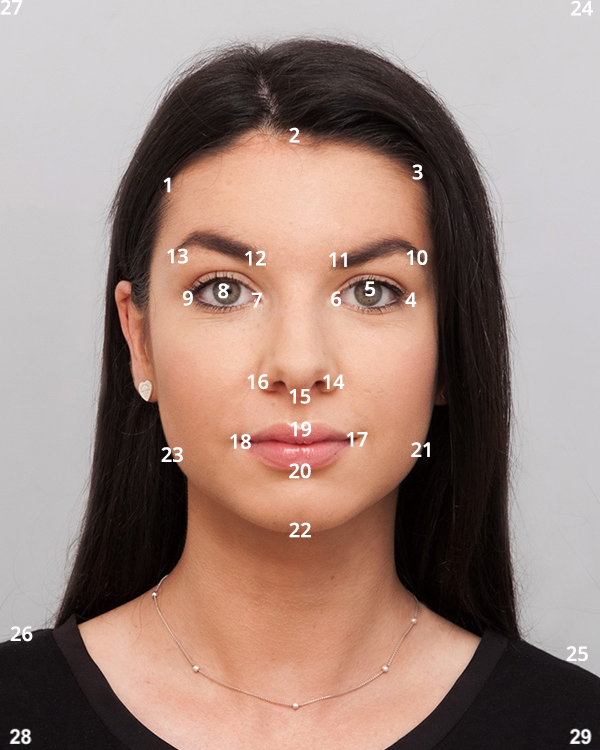
Ordering of points
Computing the "Mid-way Face"
Overview
With a list of correspondences (i.e. coordinates) ready, I could create a triangularization using scipy.spatial.Delaunay.
This created a "grid" that enclosed each pixel in a triangle. However I did not just triangularize either list of
points. First, I had to find the average or mid-way grid between my source images.
Delaunay returns a list of simplices for each triangle, which represents the vertices of each triangle
using the index of the coordinate from the inputted lists. For example, a triangle would be represented as [12
23 19] which meant its vertices were the 12th, 23th, and 19th coordinates in the input list. Since the
correspondences are consistent, we can use these indices to find the corresponding triangle's vertex coordinates in
each source image.
We're interested in an affine transform that relates the "mid-way" triangle to a "source" triangle. Using linear
algebra, I found this affine transform matrix. Then, looping over every triangle in the mid-way grid, I can apply
the
two affine transform matrices to every pixel. This gives me a pixel coordinate inside both source image spaces.
To find the color at this pixel in the mid-way grid, I take the average color between the mapped pixels in each
source image.
Procedure
- Load two lists of
N consistent correspondences for two images
- Find the average coordinate between each corresponding pair, creating a new list of
N points
- Create the Delaunay triangularization of the "mid-way" points list
- Initialize a blank image
mid
- Loop over every triange
tri in the mid-way triangularization
- Find the affine transform matrices from
tri to the corresponding triangle in both source images
- Loop over every pixel in
tri
- Use the affine transform to find the color at the corresponding pixel in each source image
- Average the colors from both photos and set it at the pixel in
mid
Result

Image 1
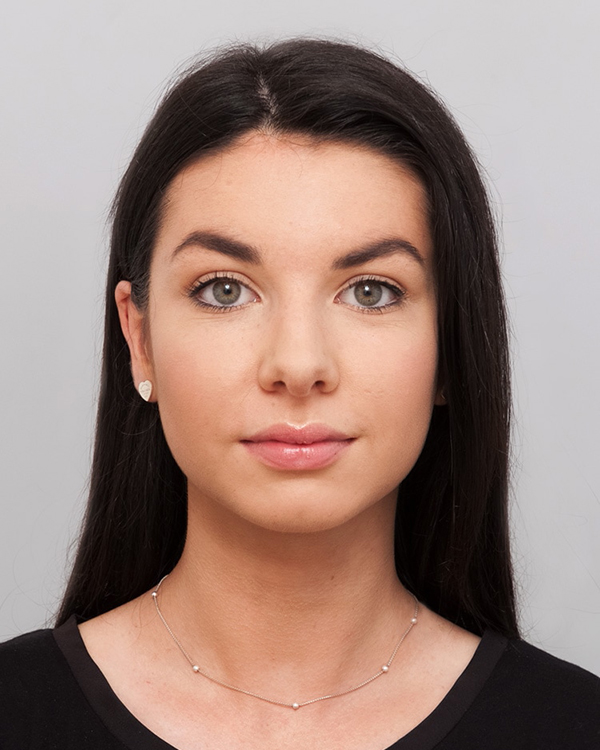
Image 2

Halfway morph
The Morph Sequence
To create a smooth sequence from image 1 to image 2, we can use some parameter frac between 0 and 1.
This allows me to linearly interpolate the structure (i.e. correspondences points) and color between two images. In
this resulting animation, I have 45 images that linearly interpolate between my start and end images.
Morphing between Image 1 and Image 2
The "Mean face" of a population
To find the average face in a data set of multiple faces, I can find the average shape by adding together all the
correspondences and dividing by the number of faces. (This is just an arithmetic average of coordinate points).
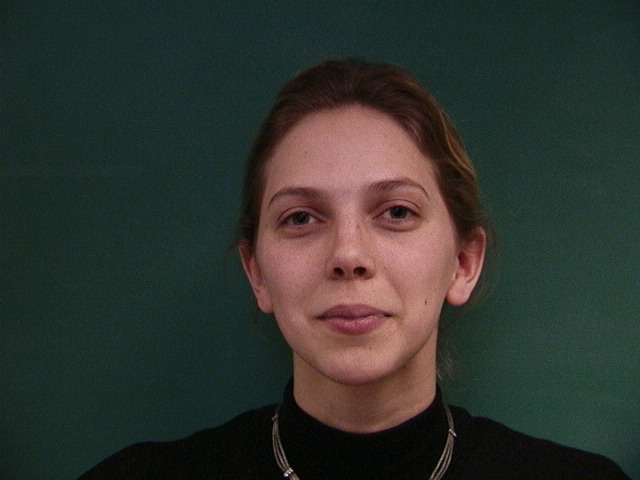
Thankfully, there are annotated data sets available, so I used a set of 37 Danish scientists' faces.
We can find the average appearance by applying affine transforms to every pixel in the image, as before. (Each
triangle in the image has a different affine transform to the corresponding triangle in the average image.)
Average
Average across 7 faces
Transferring average
14-1f

14-1f => Average

38-1m
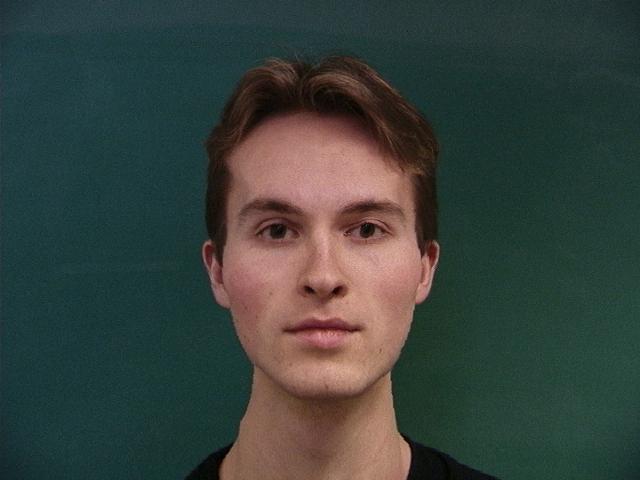
38-1m => Average
Transferring me and average
B warped with average
Average warped with B
Caricatures: Extrapolating from the mean
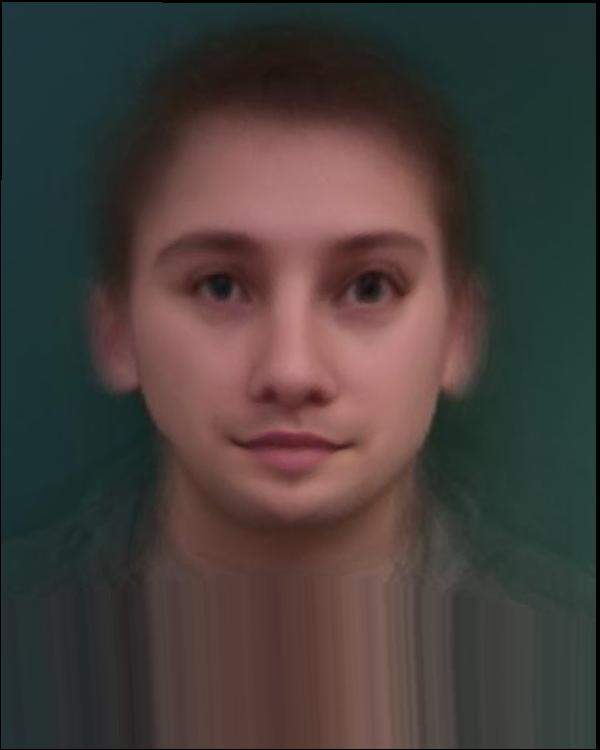
I can extract a subset of my Danish scientist image set — there is a limited amount of female scientists,
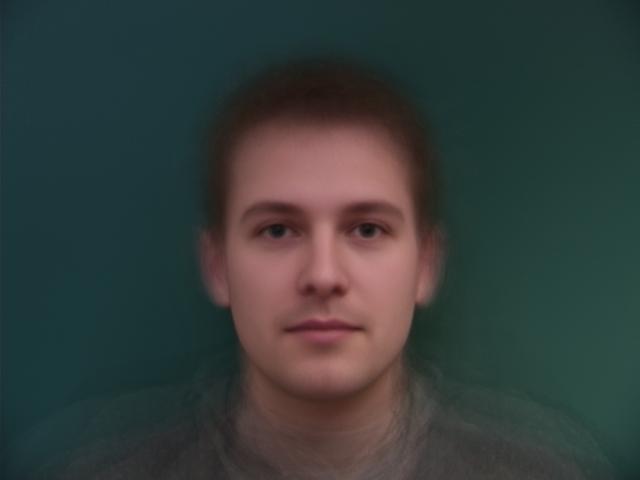
conveniently labeled as "1f". This creates an average *female* face. Notice the blurriness away from the face. Since
there are fewer data points, each outlier contributes more weight to the final image.
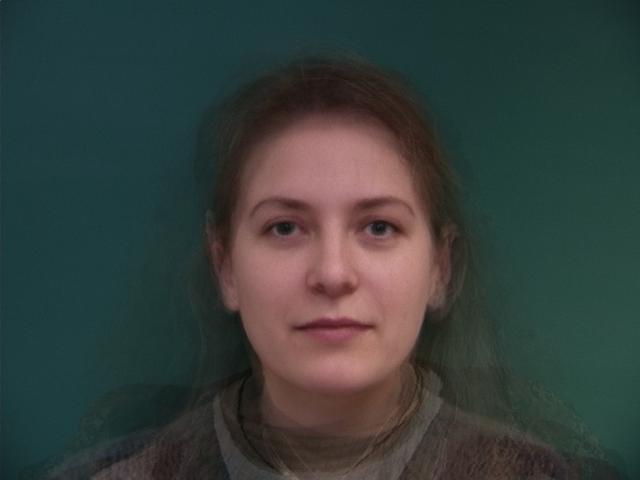
Comparing averages
Average across females (N = 8)
Average across all (N = 37)
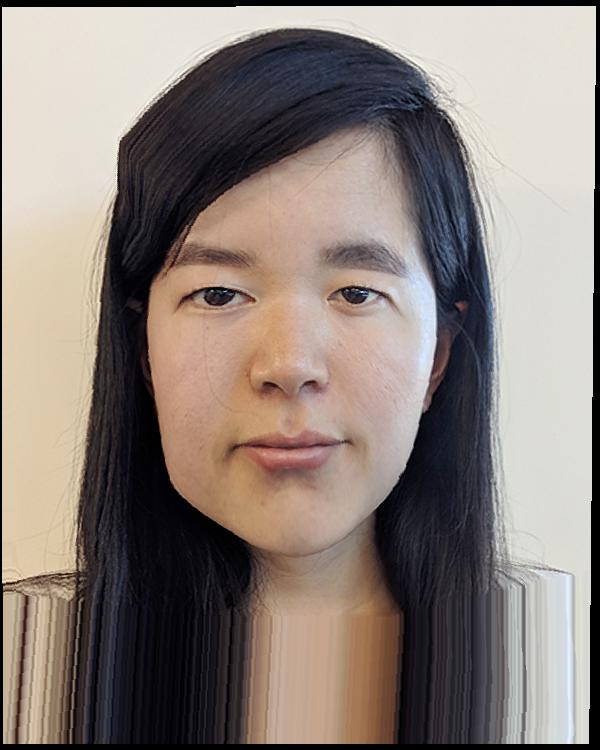
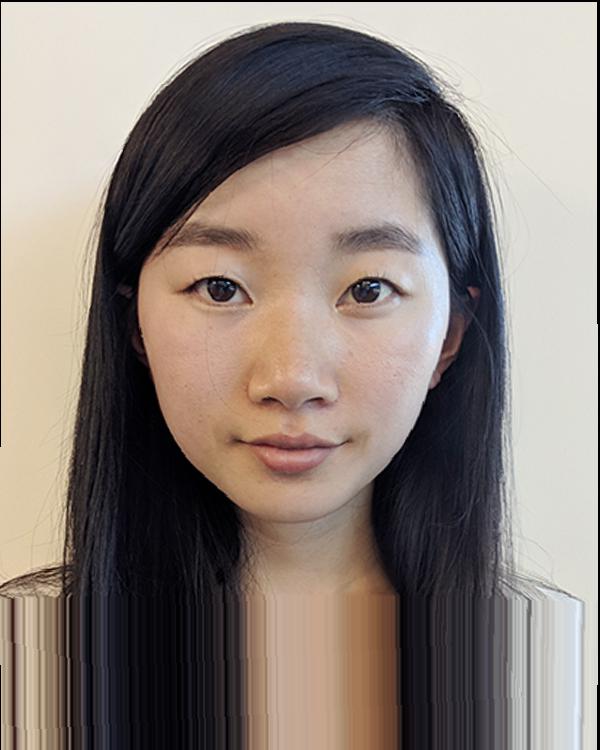
This average female image is closer to my own facial features. So, it provides a good candidate of comparison to
make a caricature of myself. I can create a caricature by creating corresponding points, just as before. Then, I can
find the difference between the corresponding points, im_points - avg_points, and multiply a constant
alpha. Then, we can add this difference to avg_points. This exaggerates the difference and
creates a caricuature.
Images

alpha = 1.0
alpha = 1.25
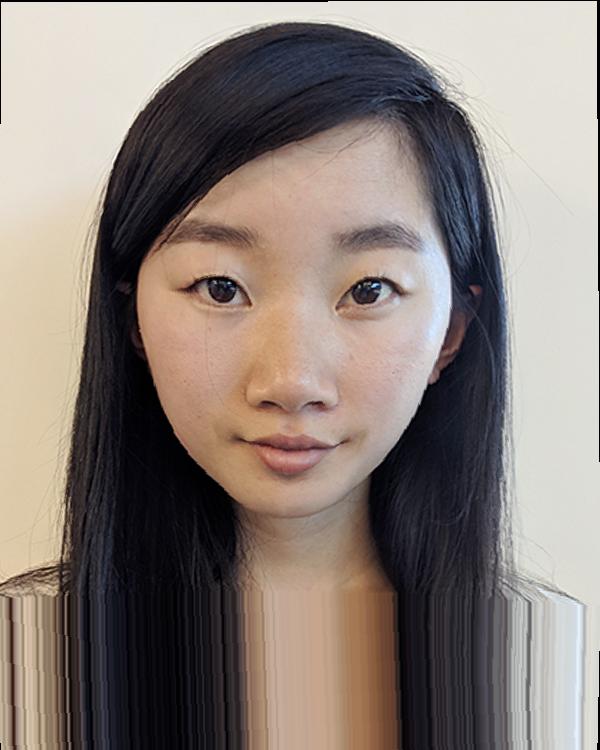
alpha = 1.5
alpha = 1.75
Bells & Whistles
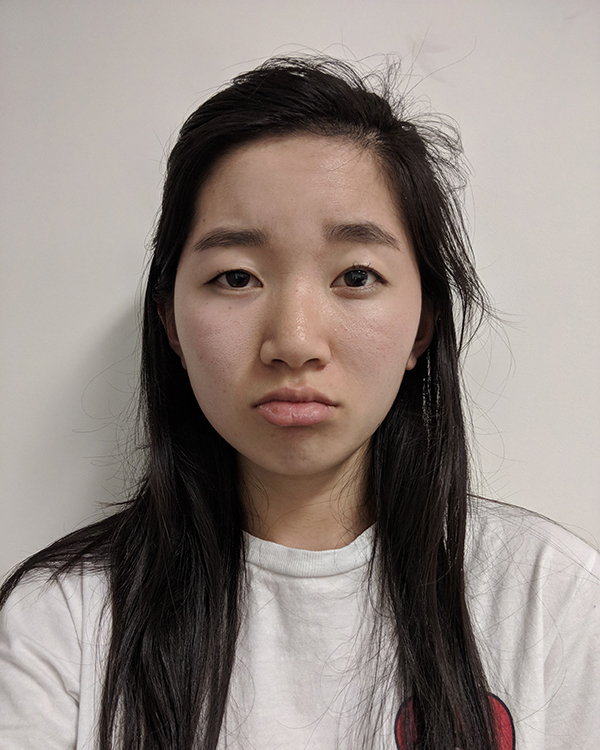
Changing expressions
Just for fun, I can animate my face from happy to pouty!
Results