Bells and whistles: Made gifs of series of images. Used distance measurements to compute field of view of camera at minimum and maximum zoom
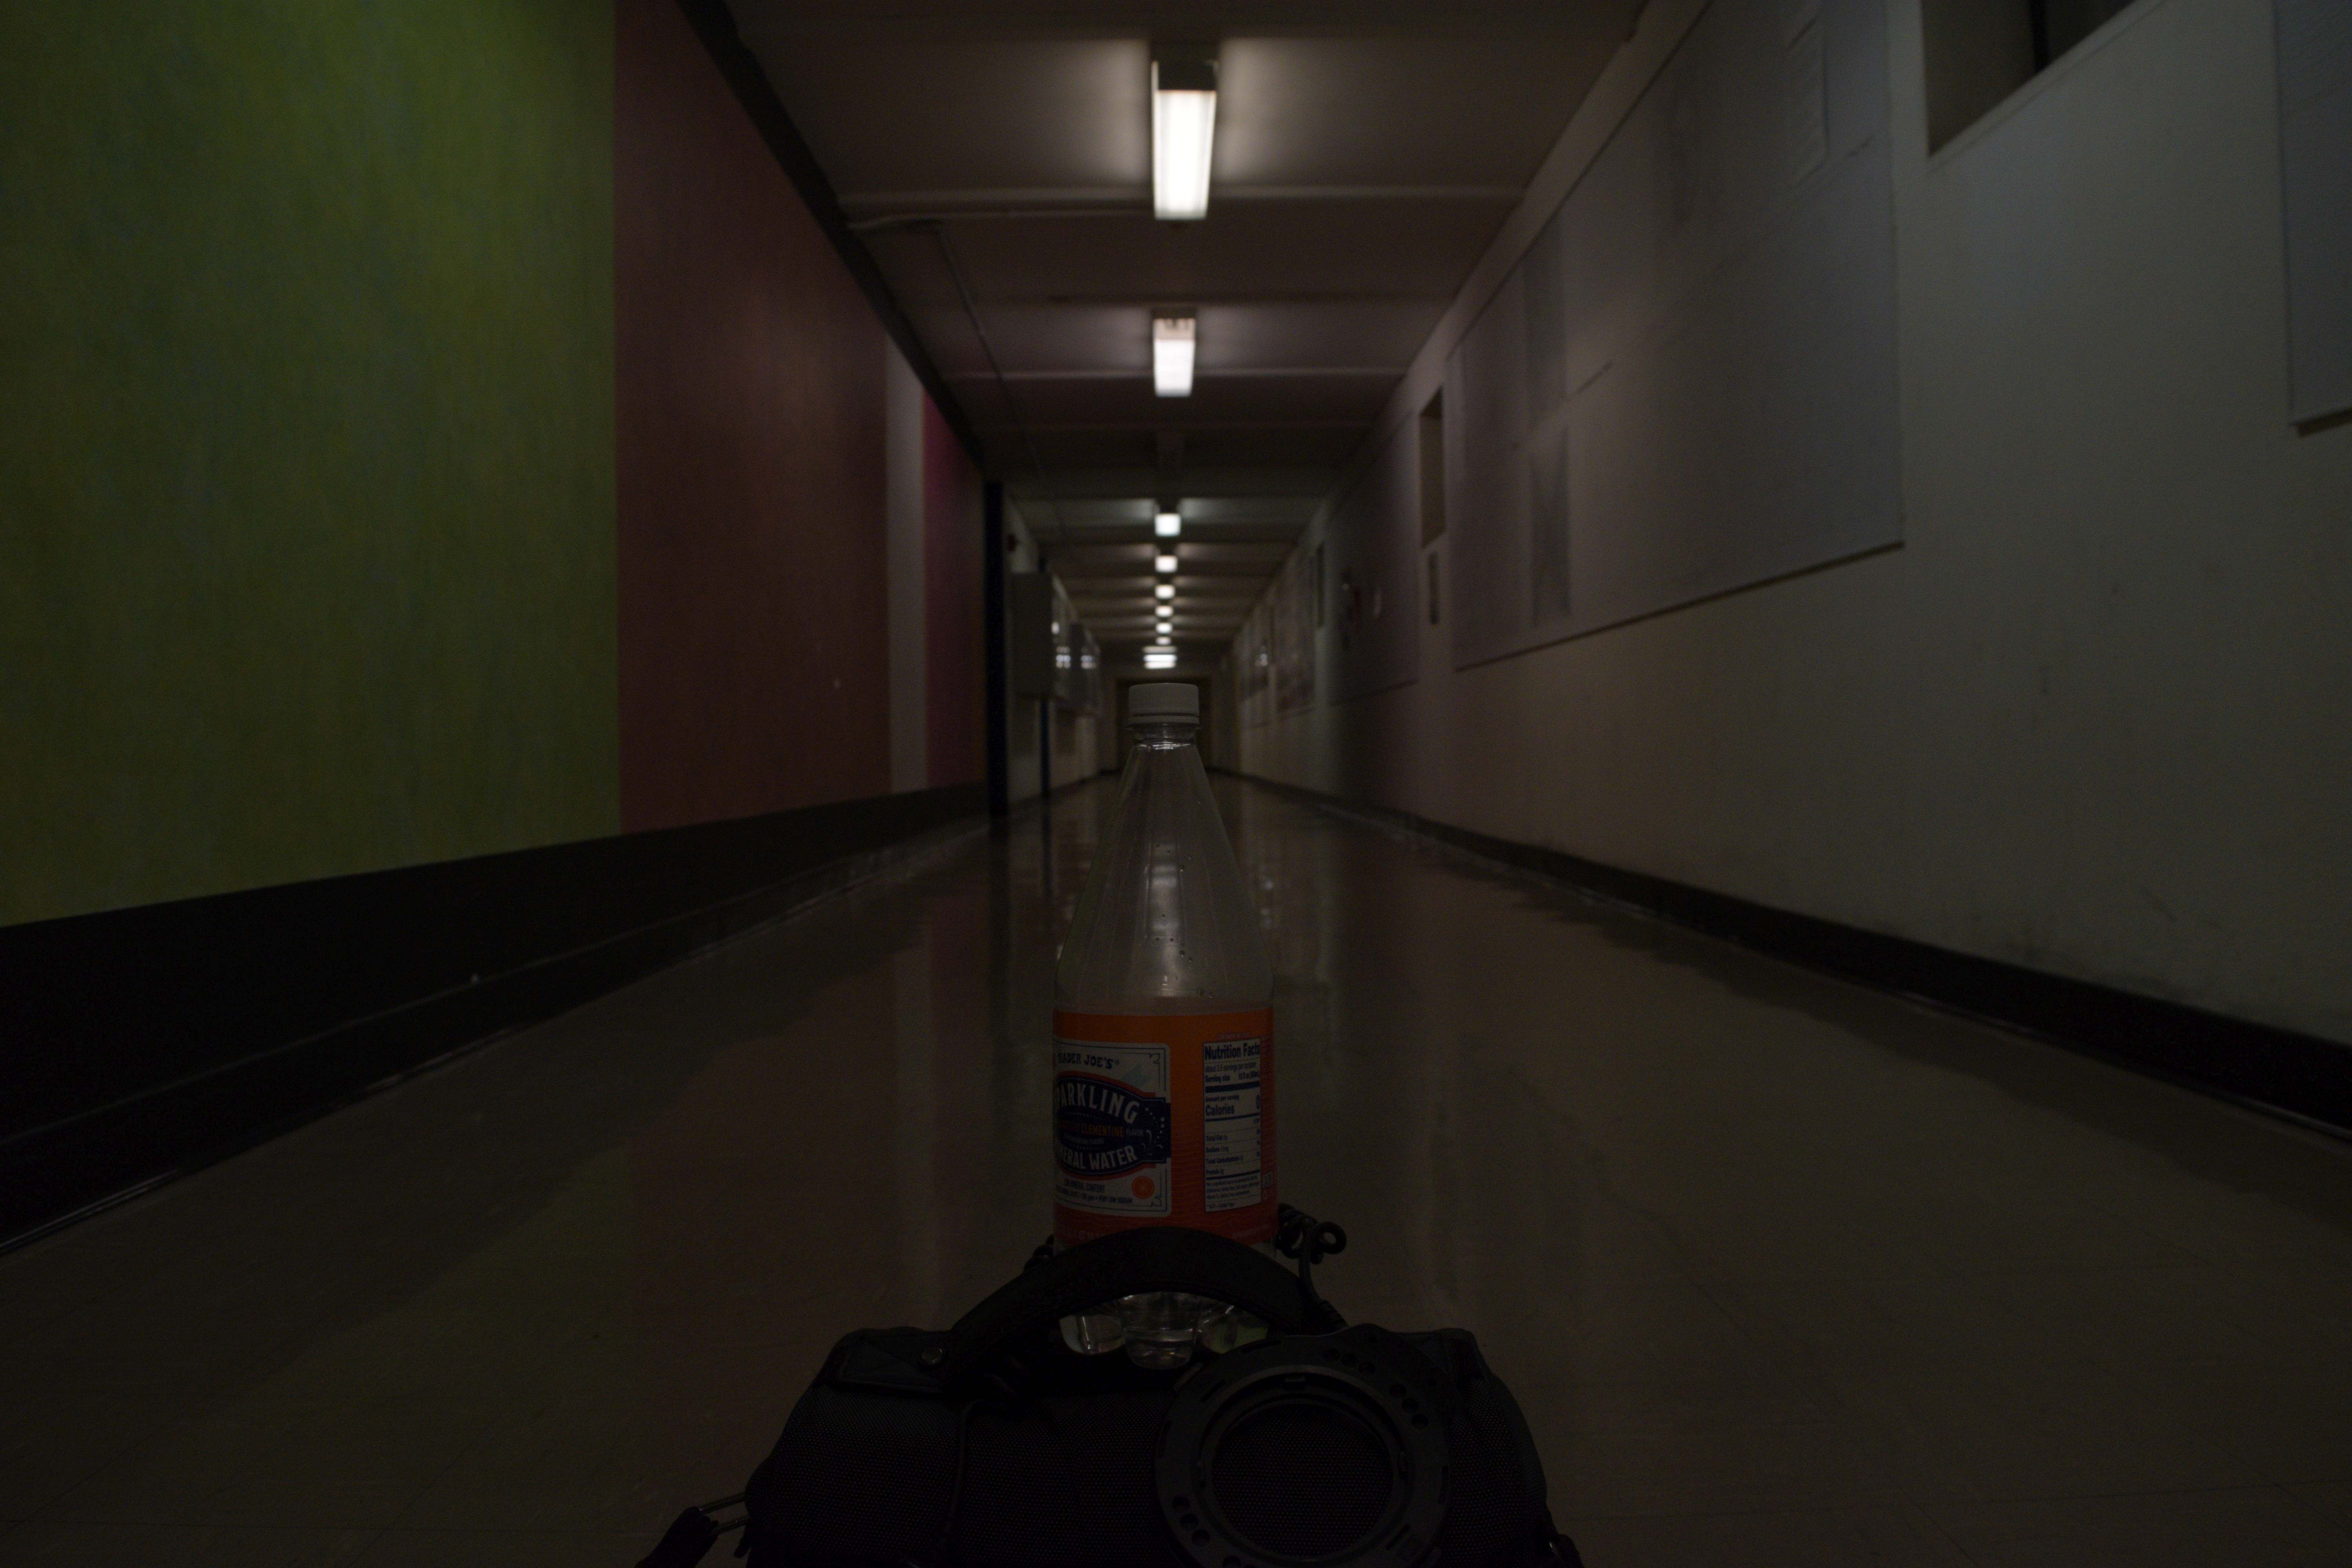
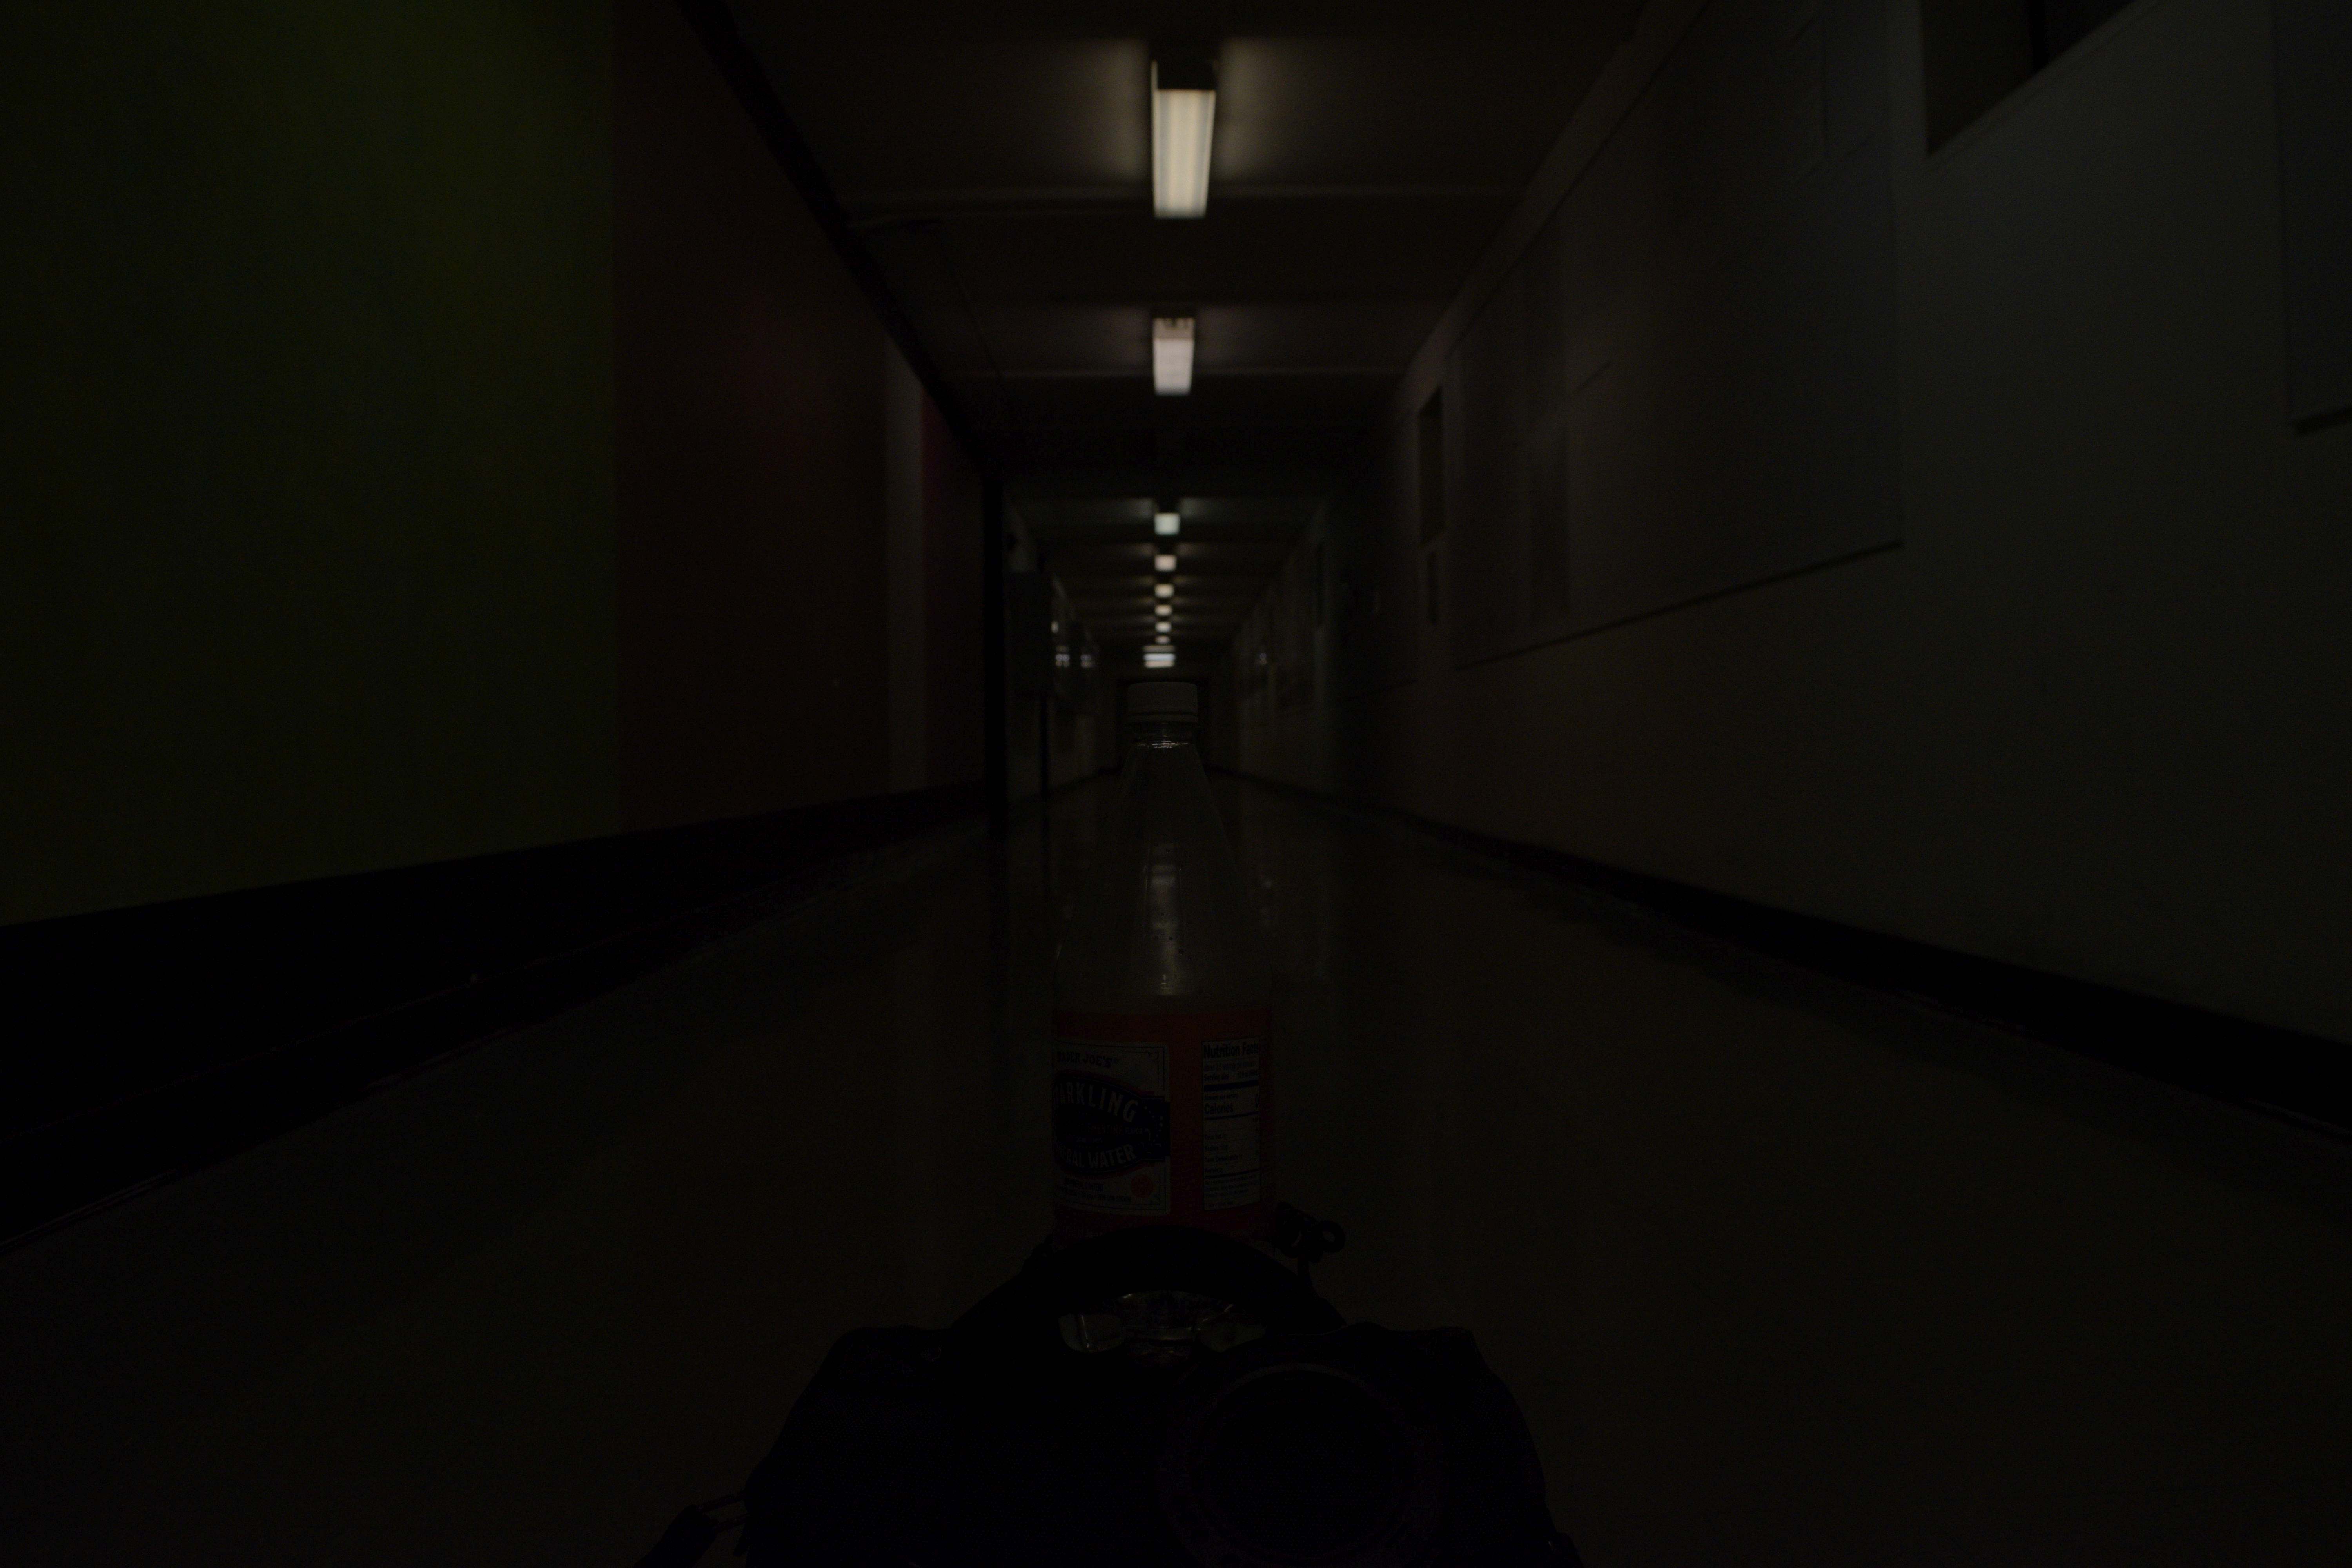
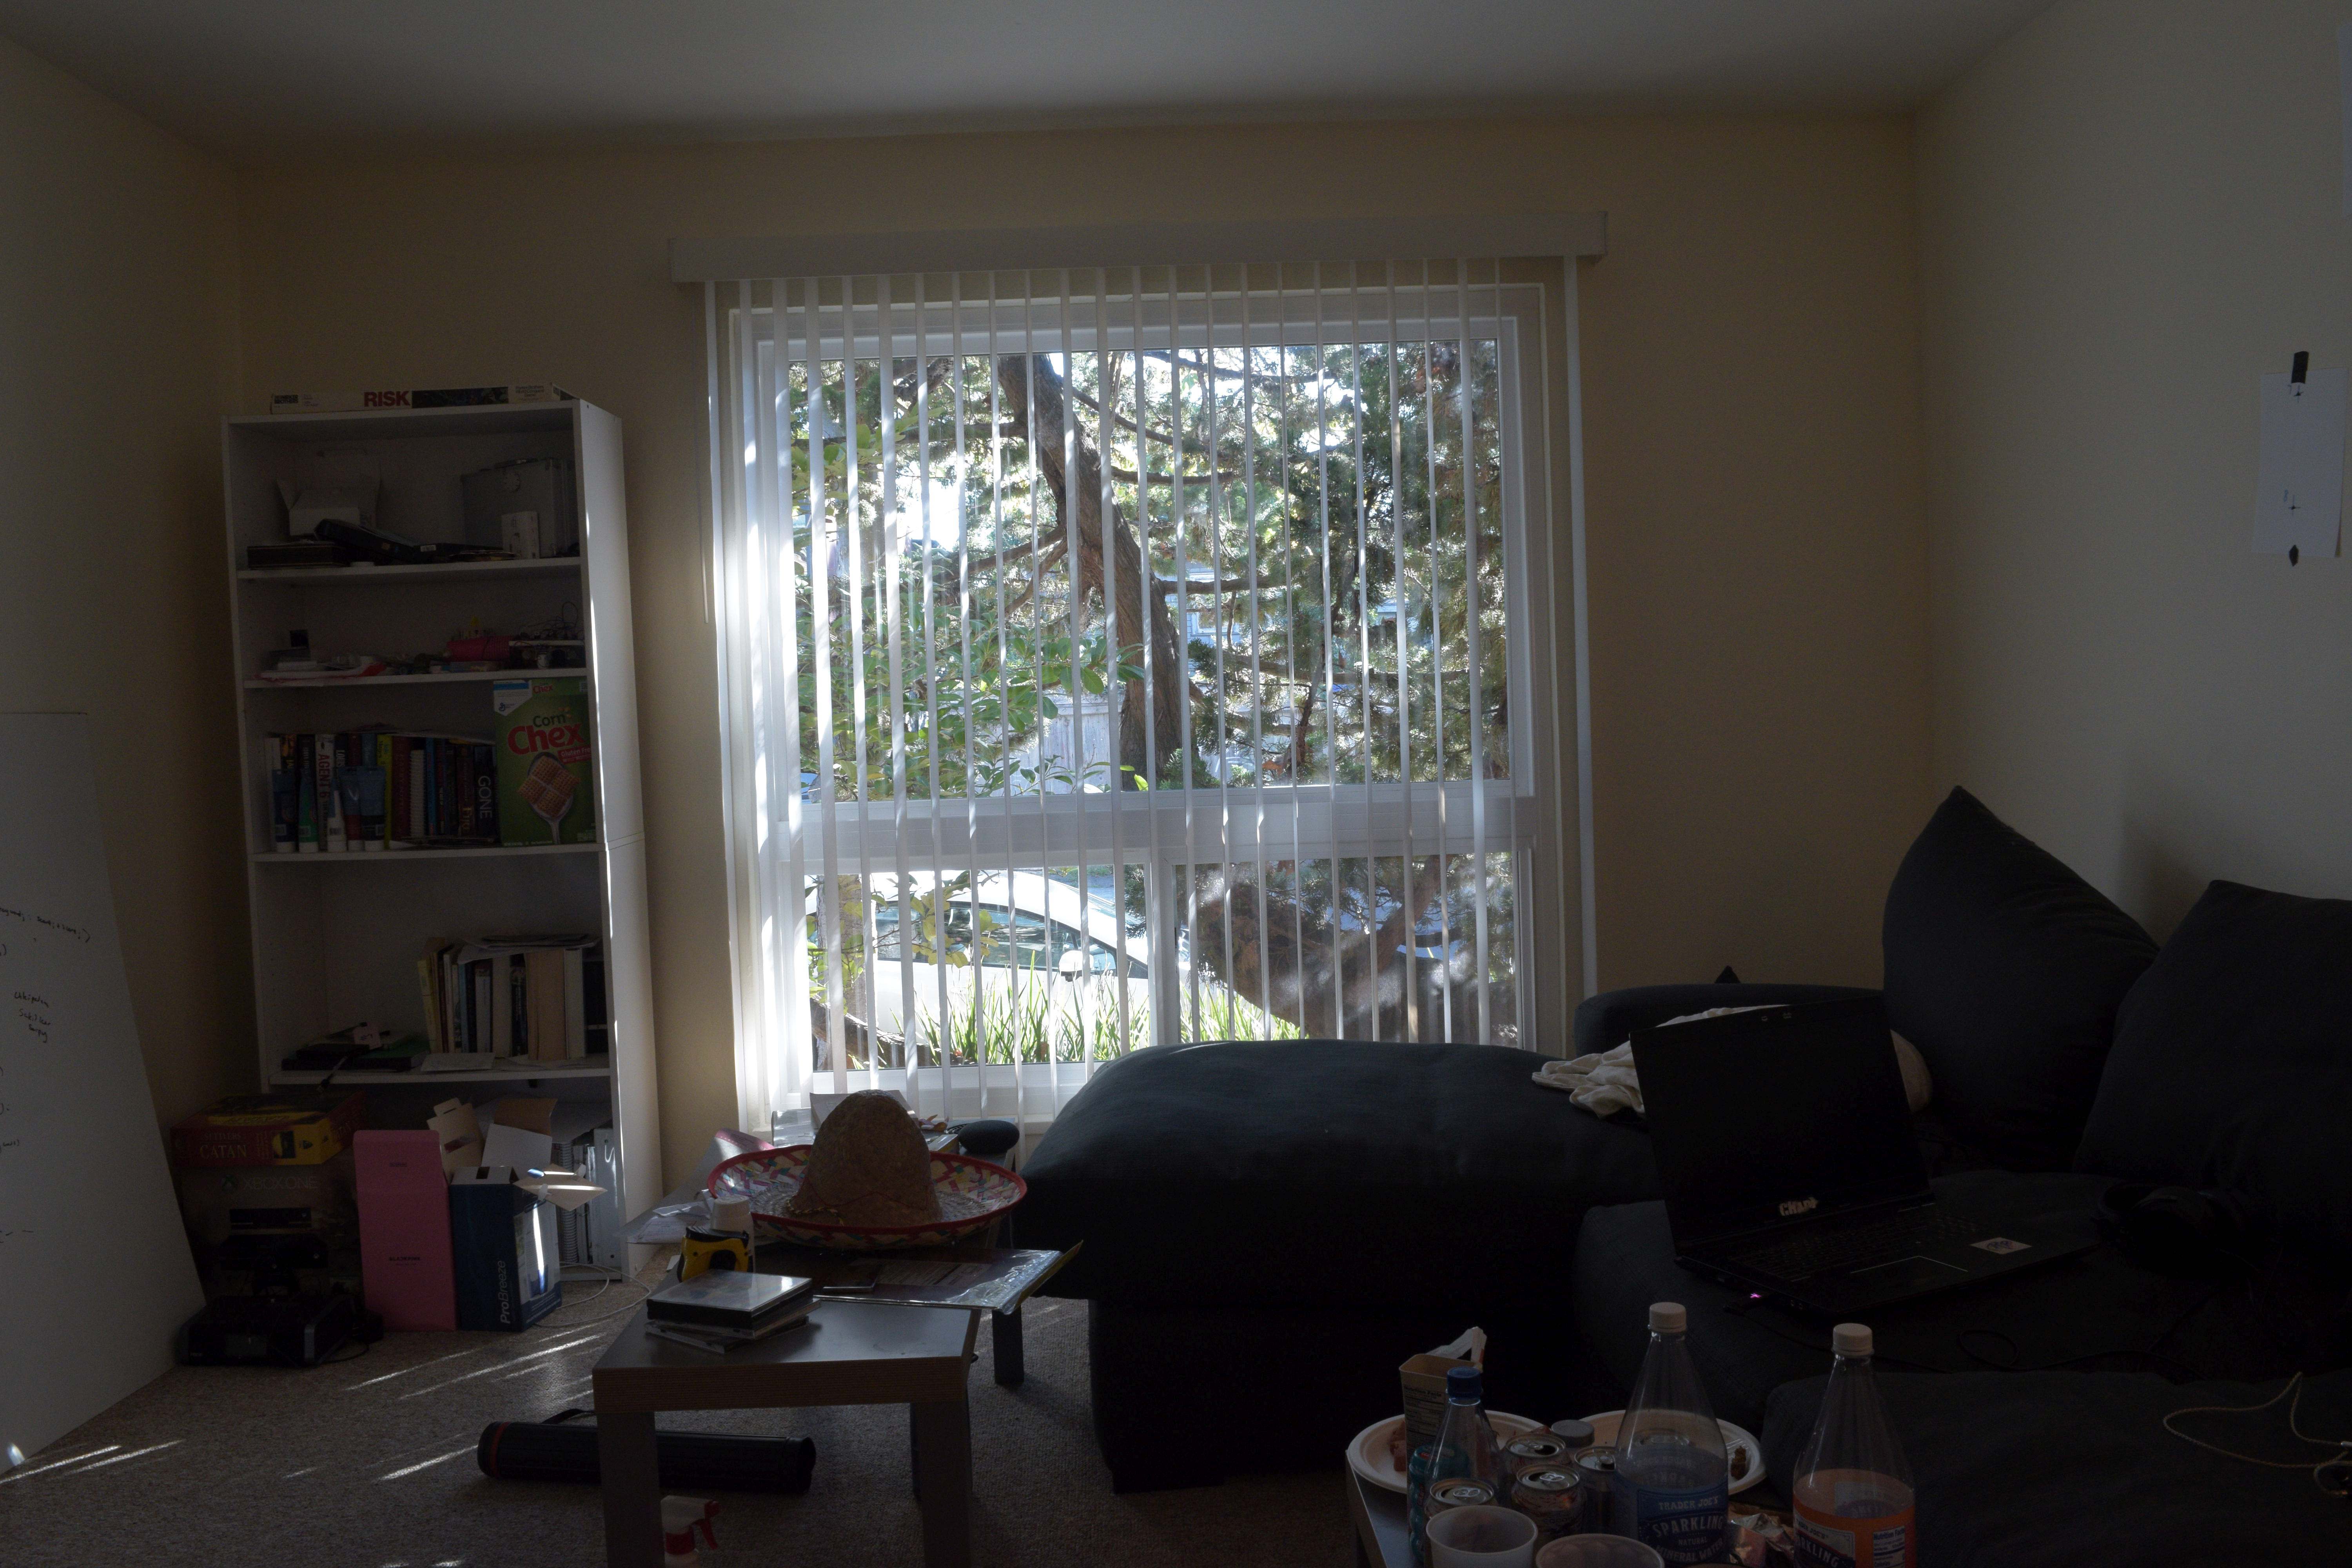
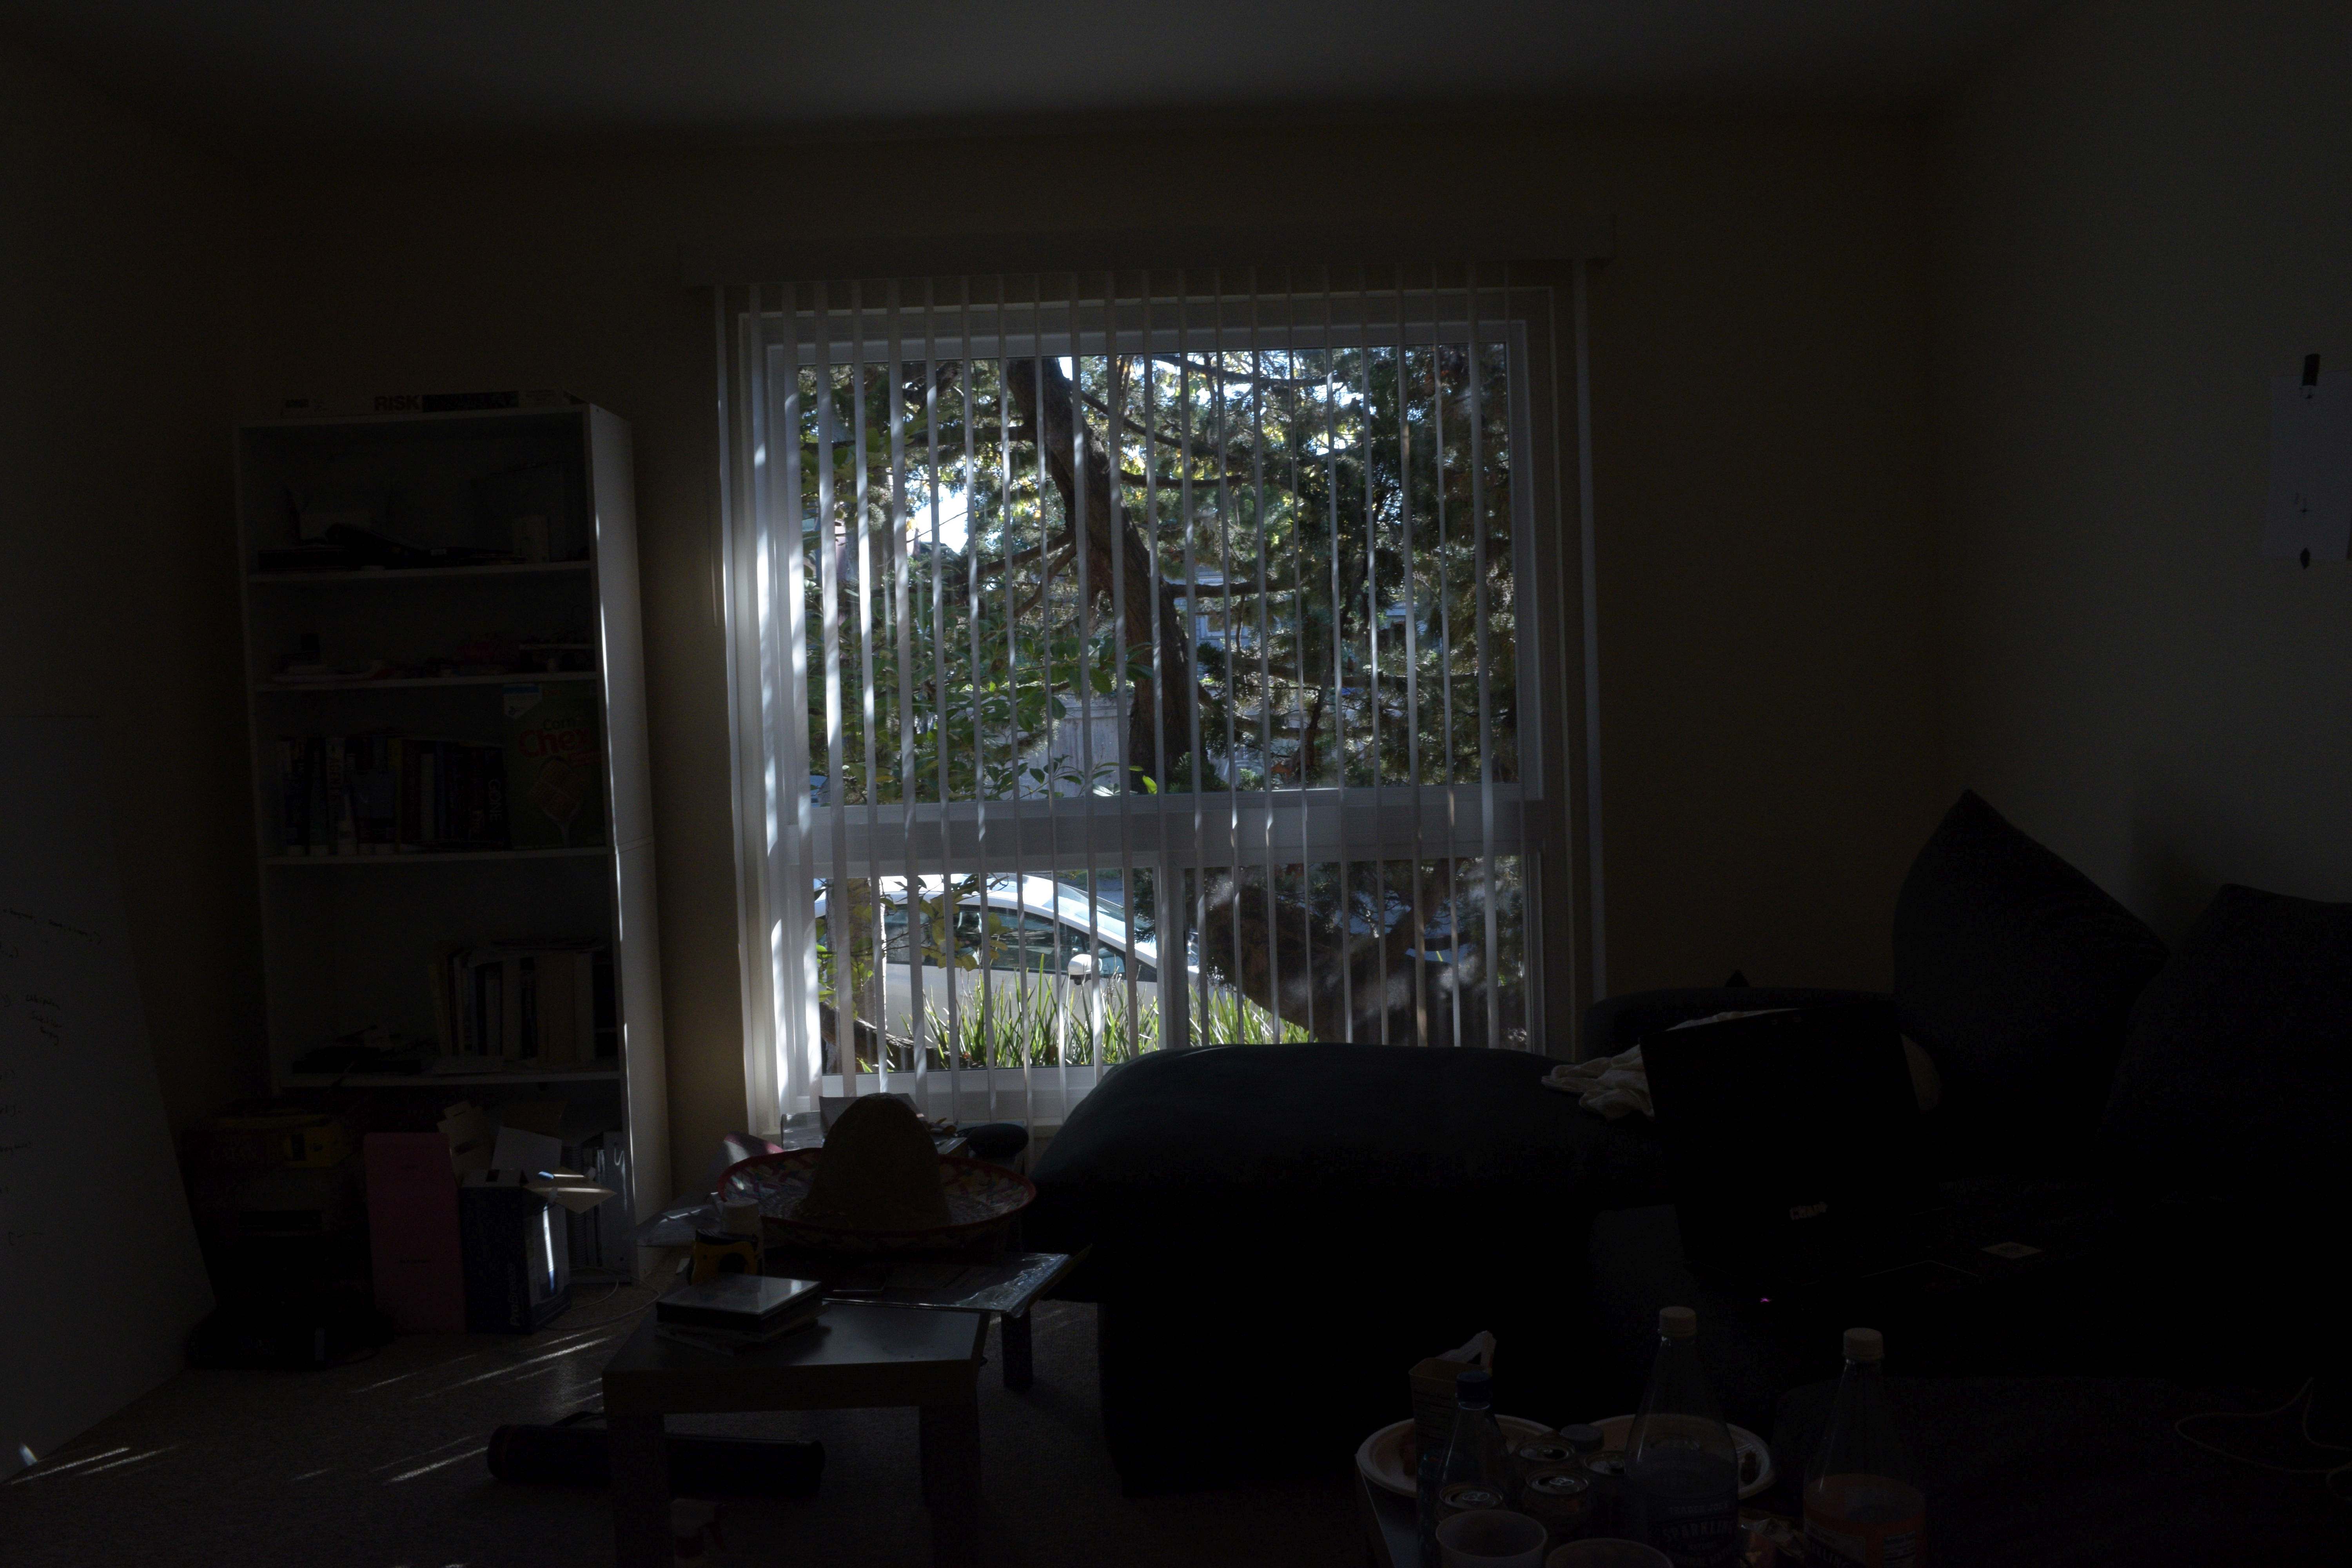
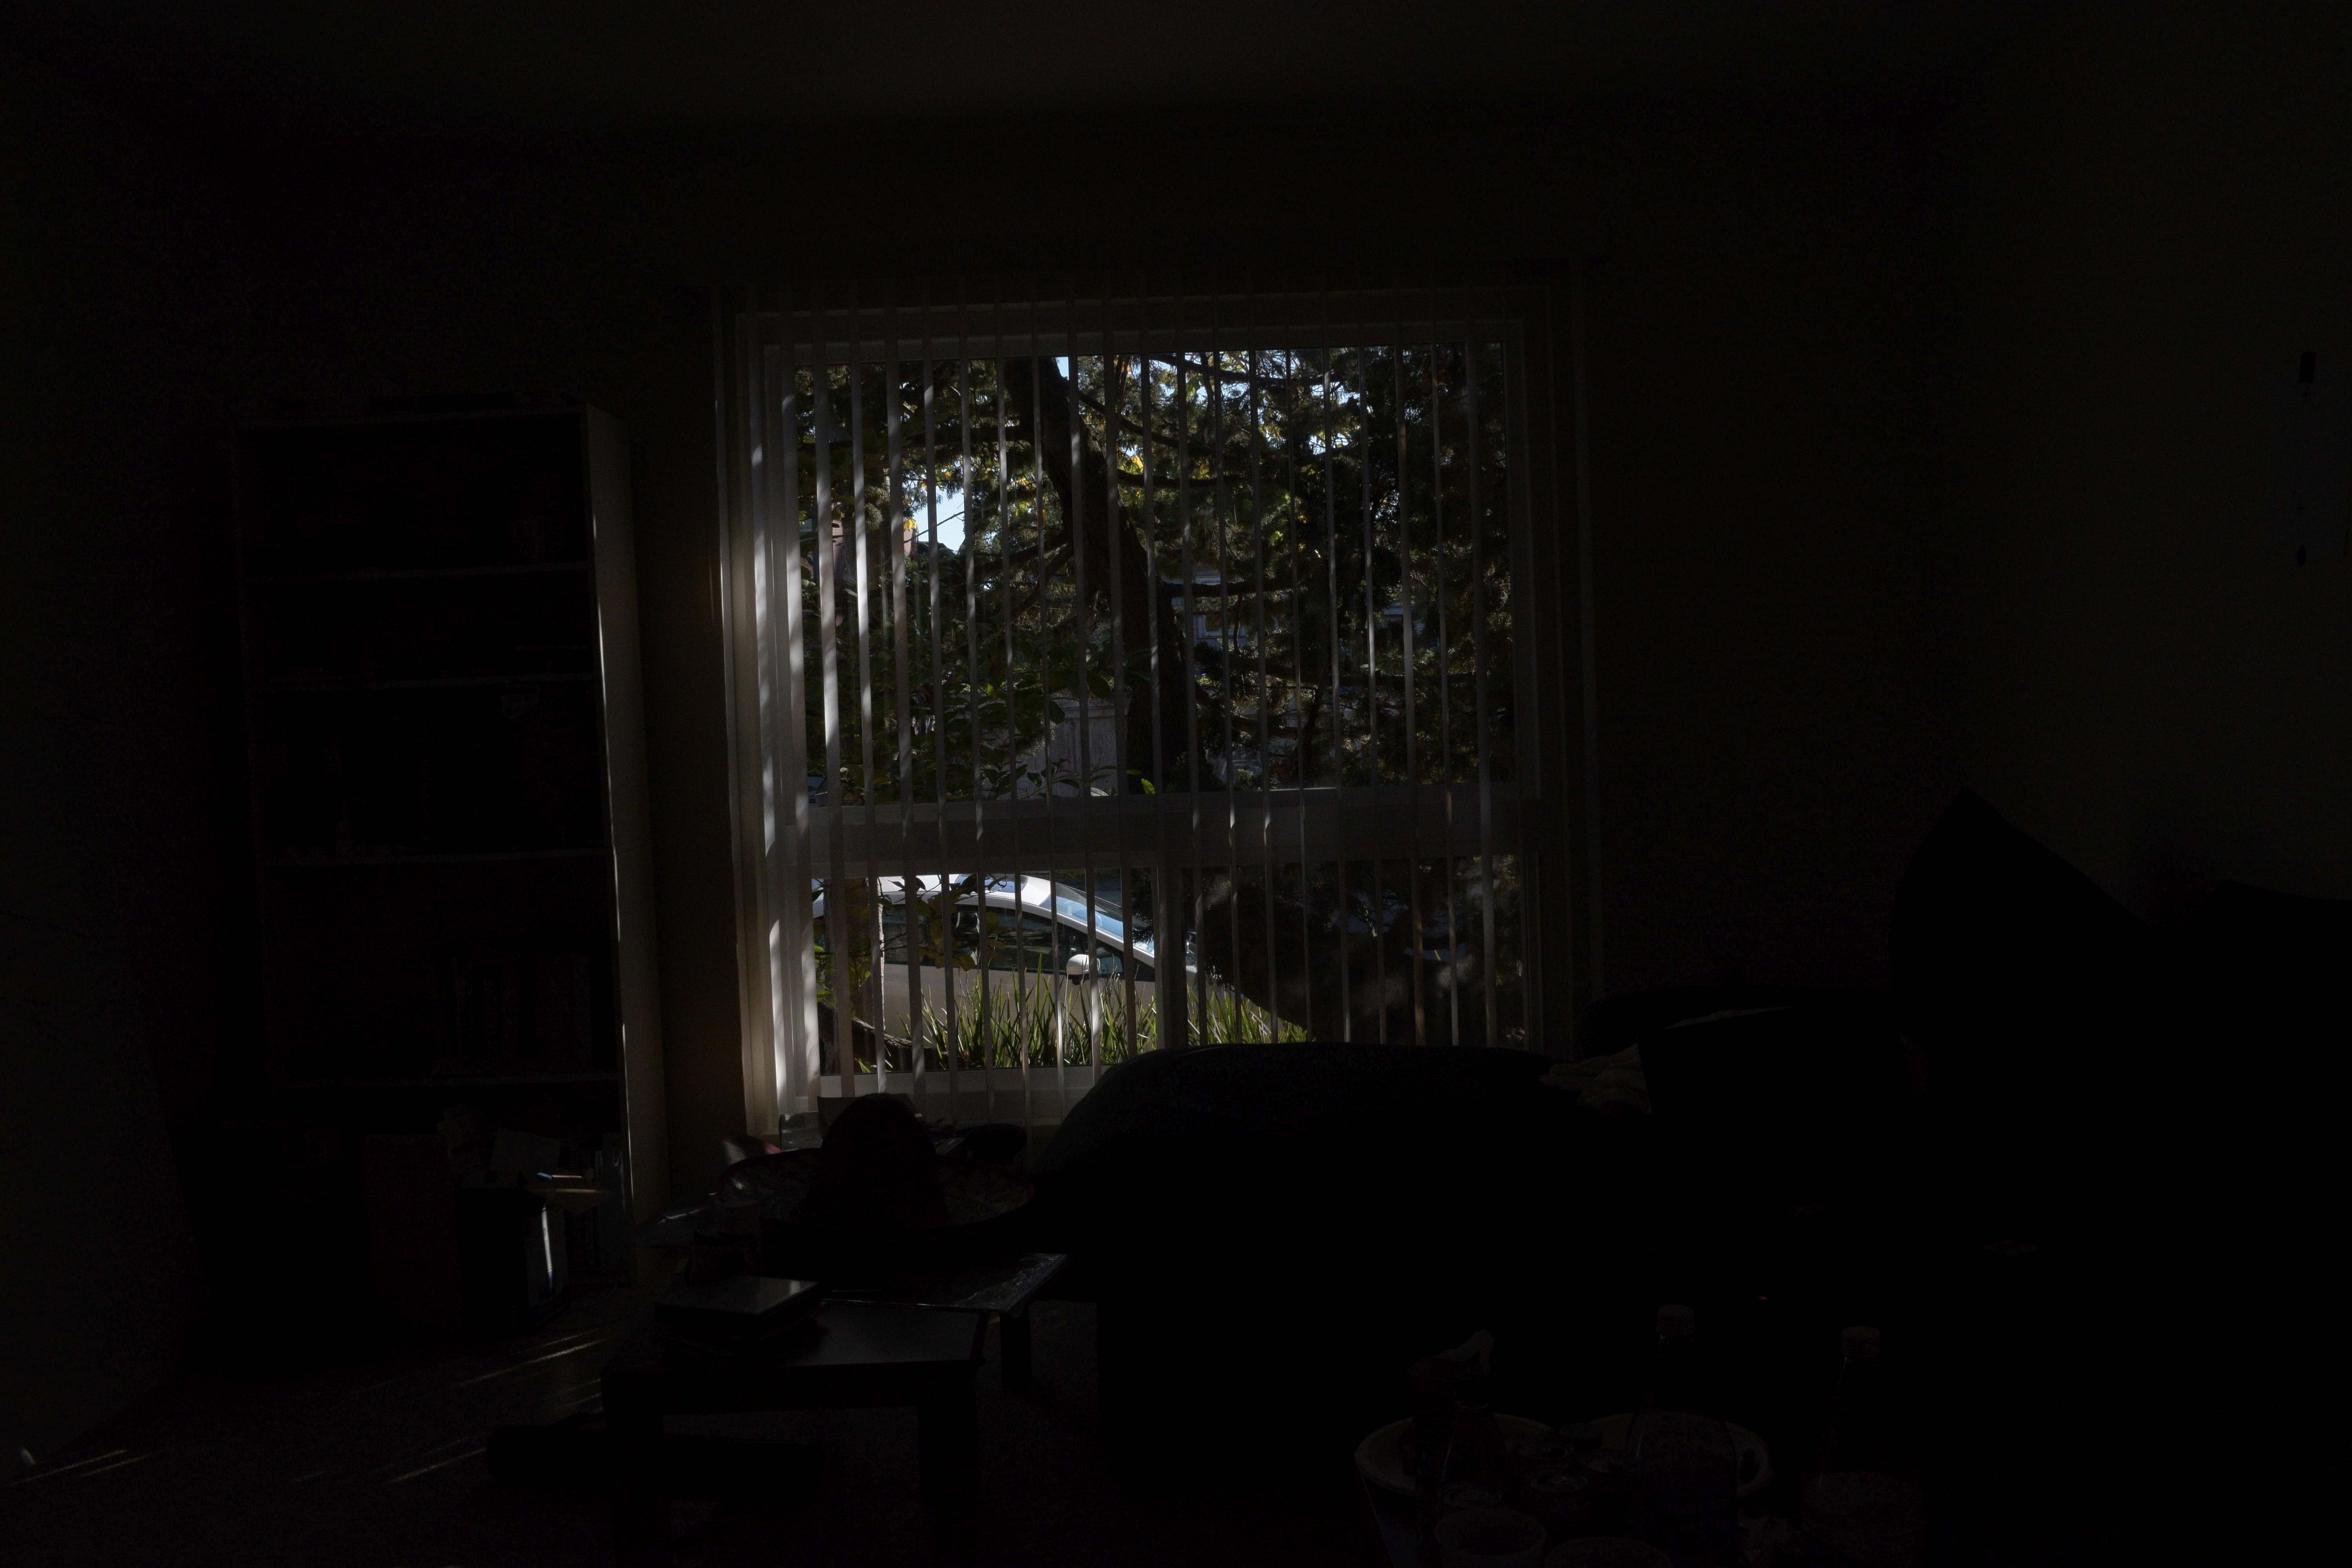
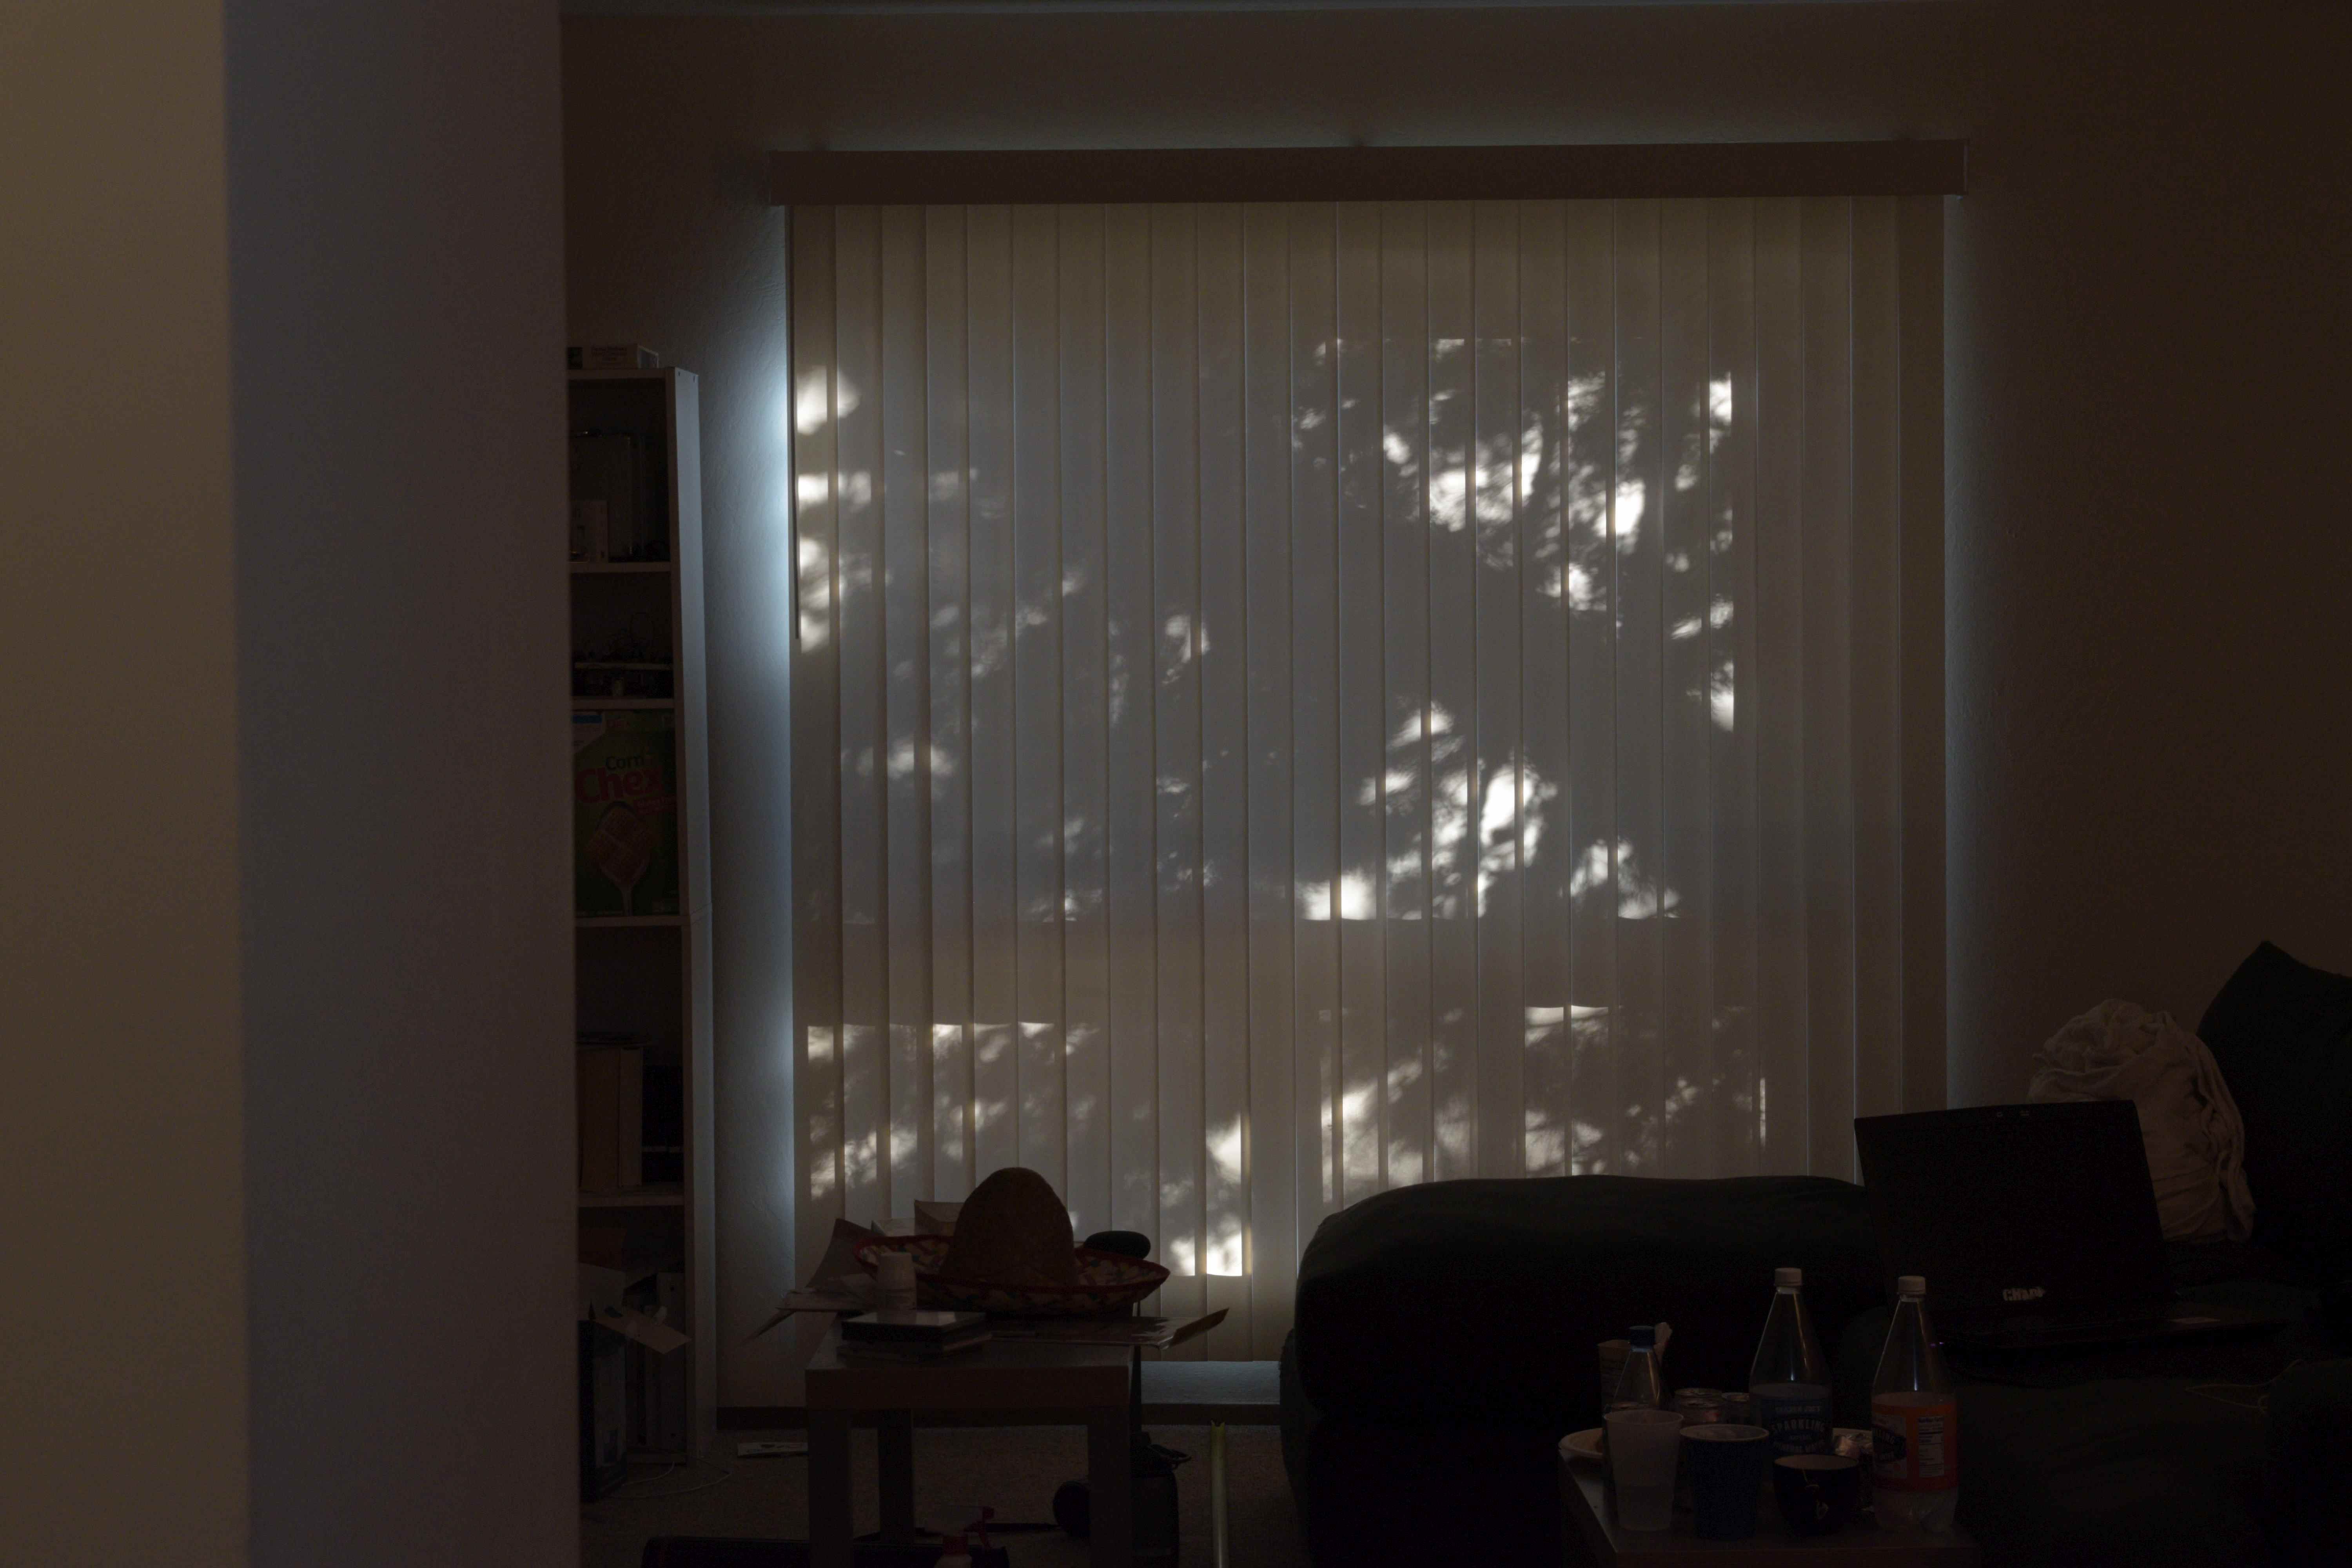
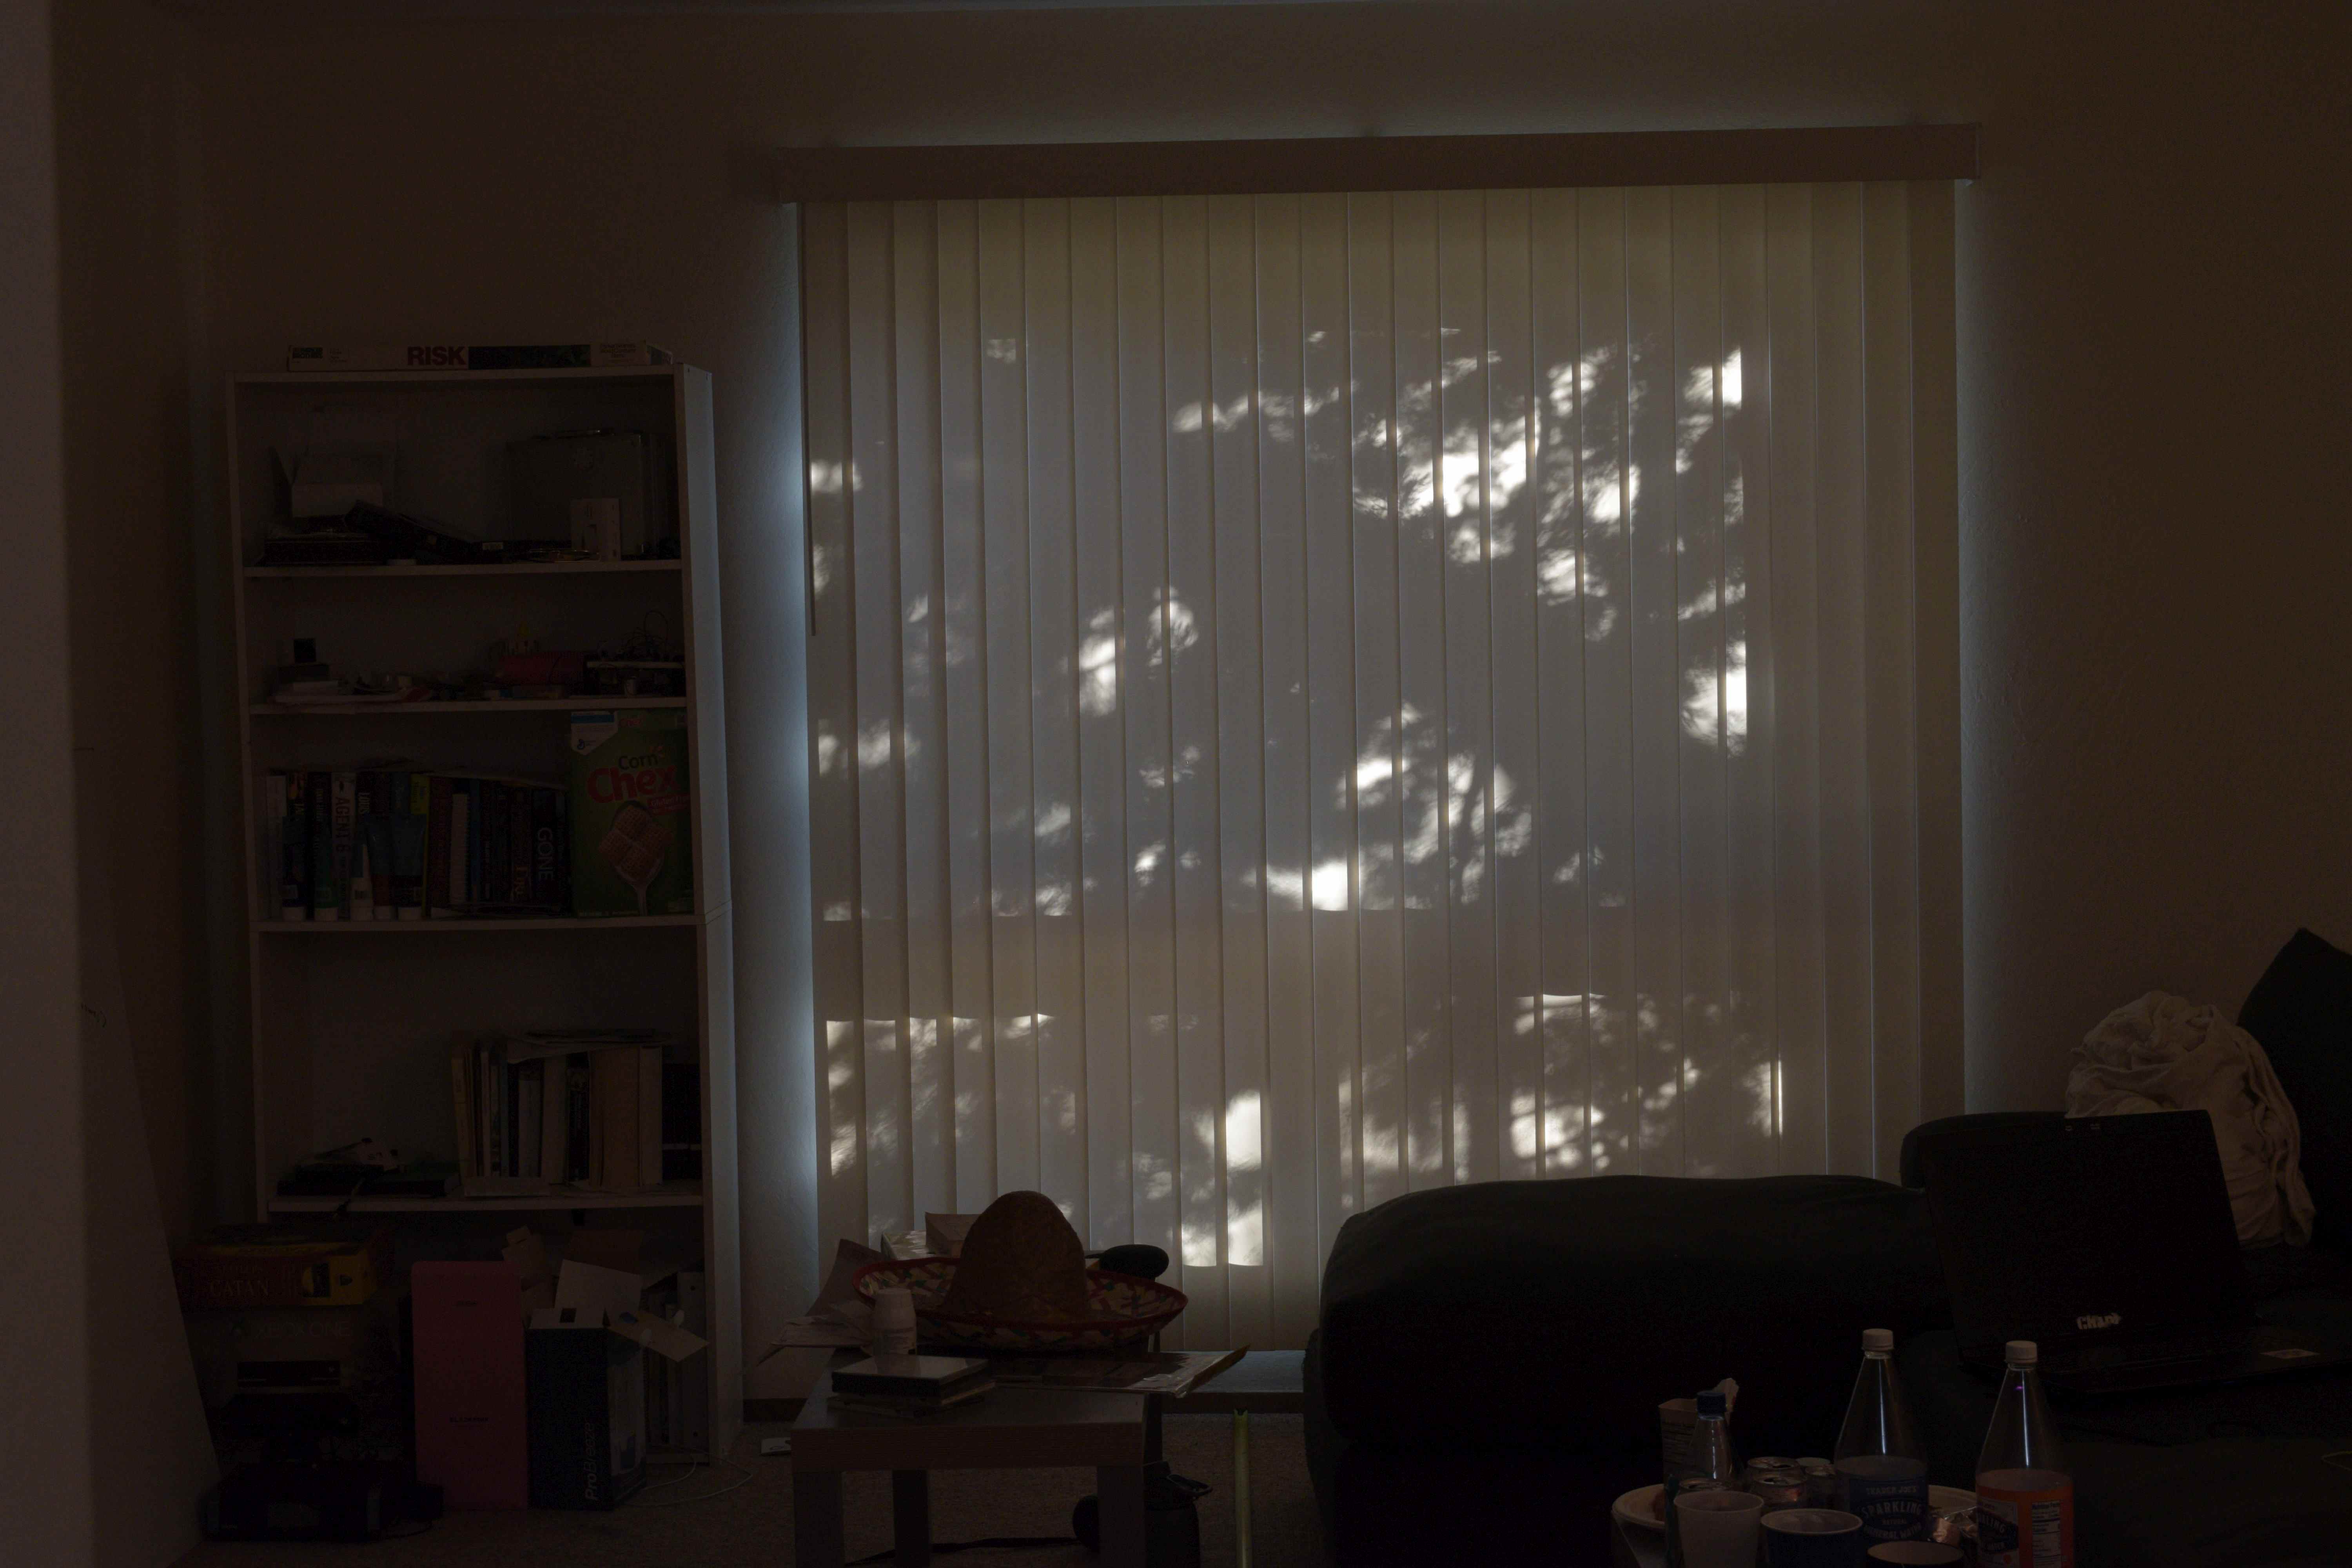
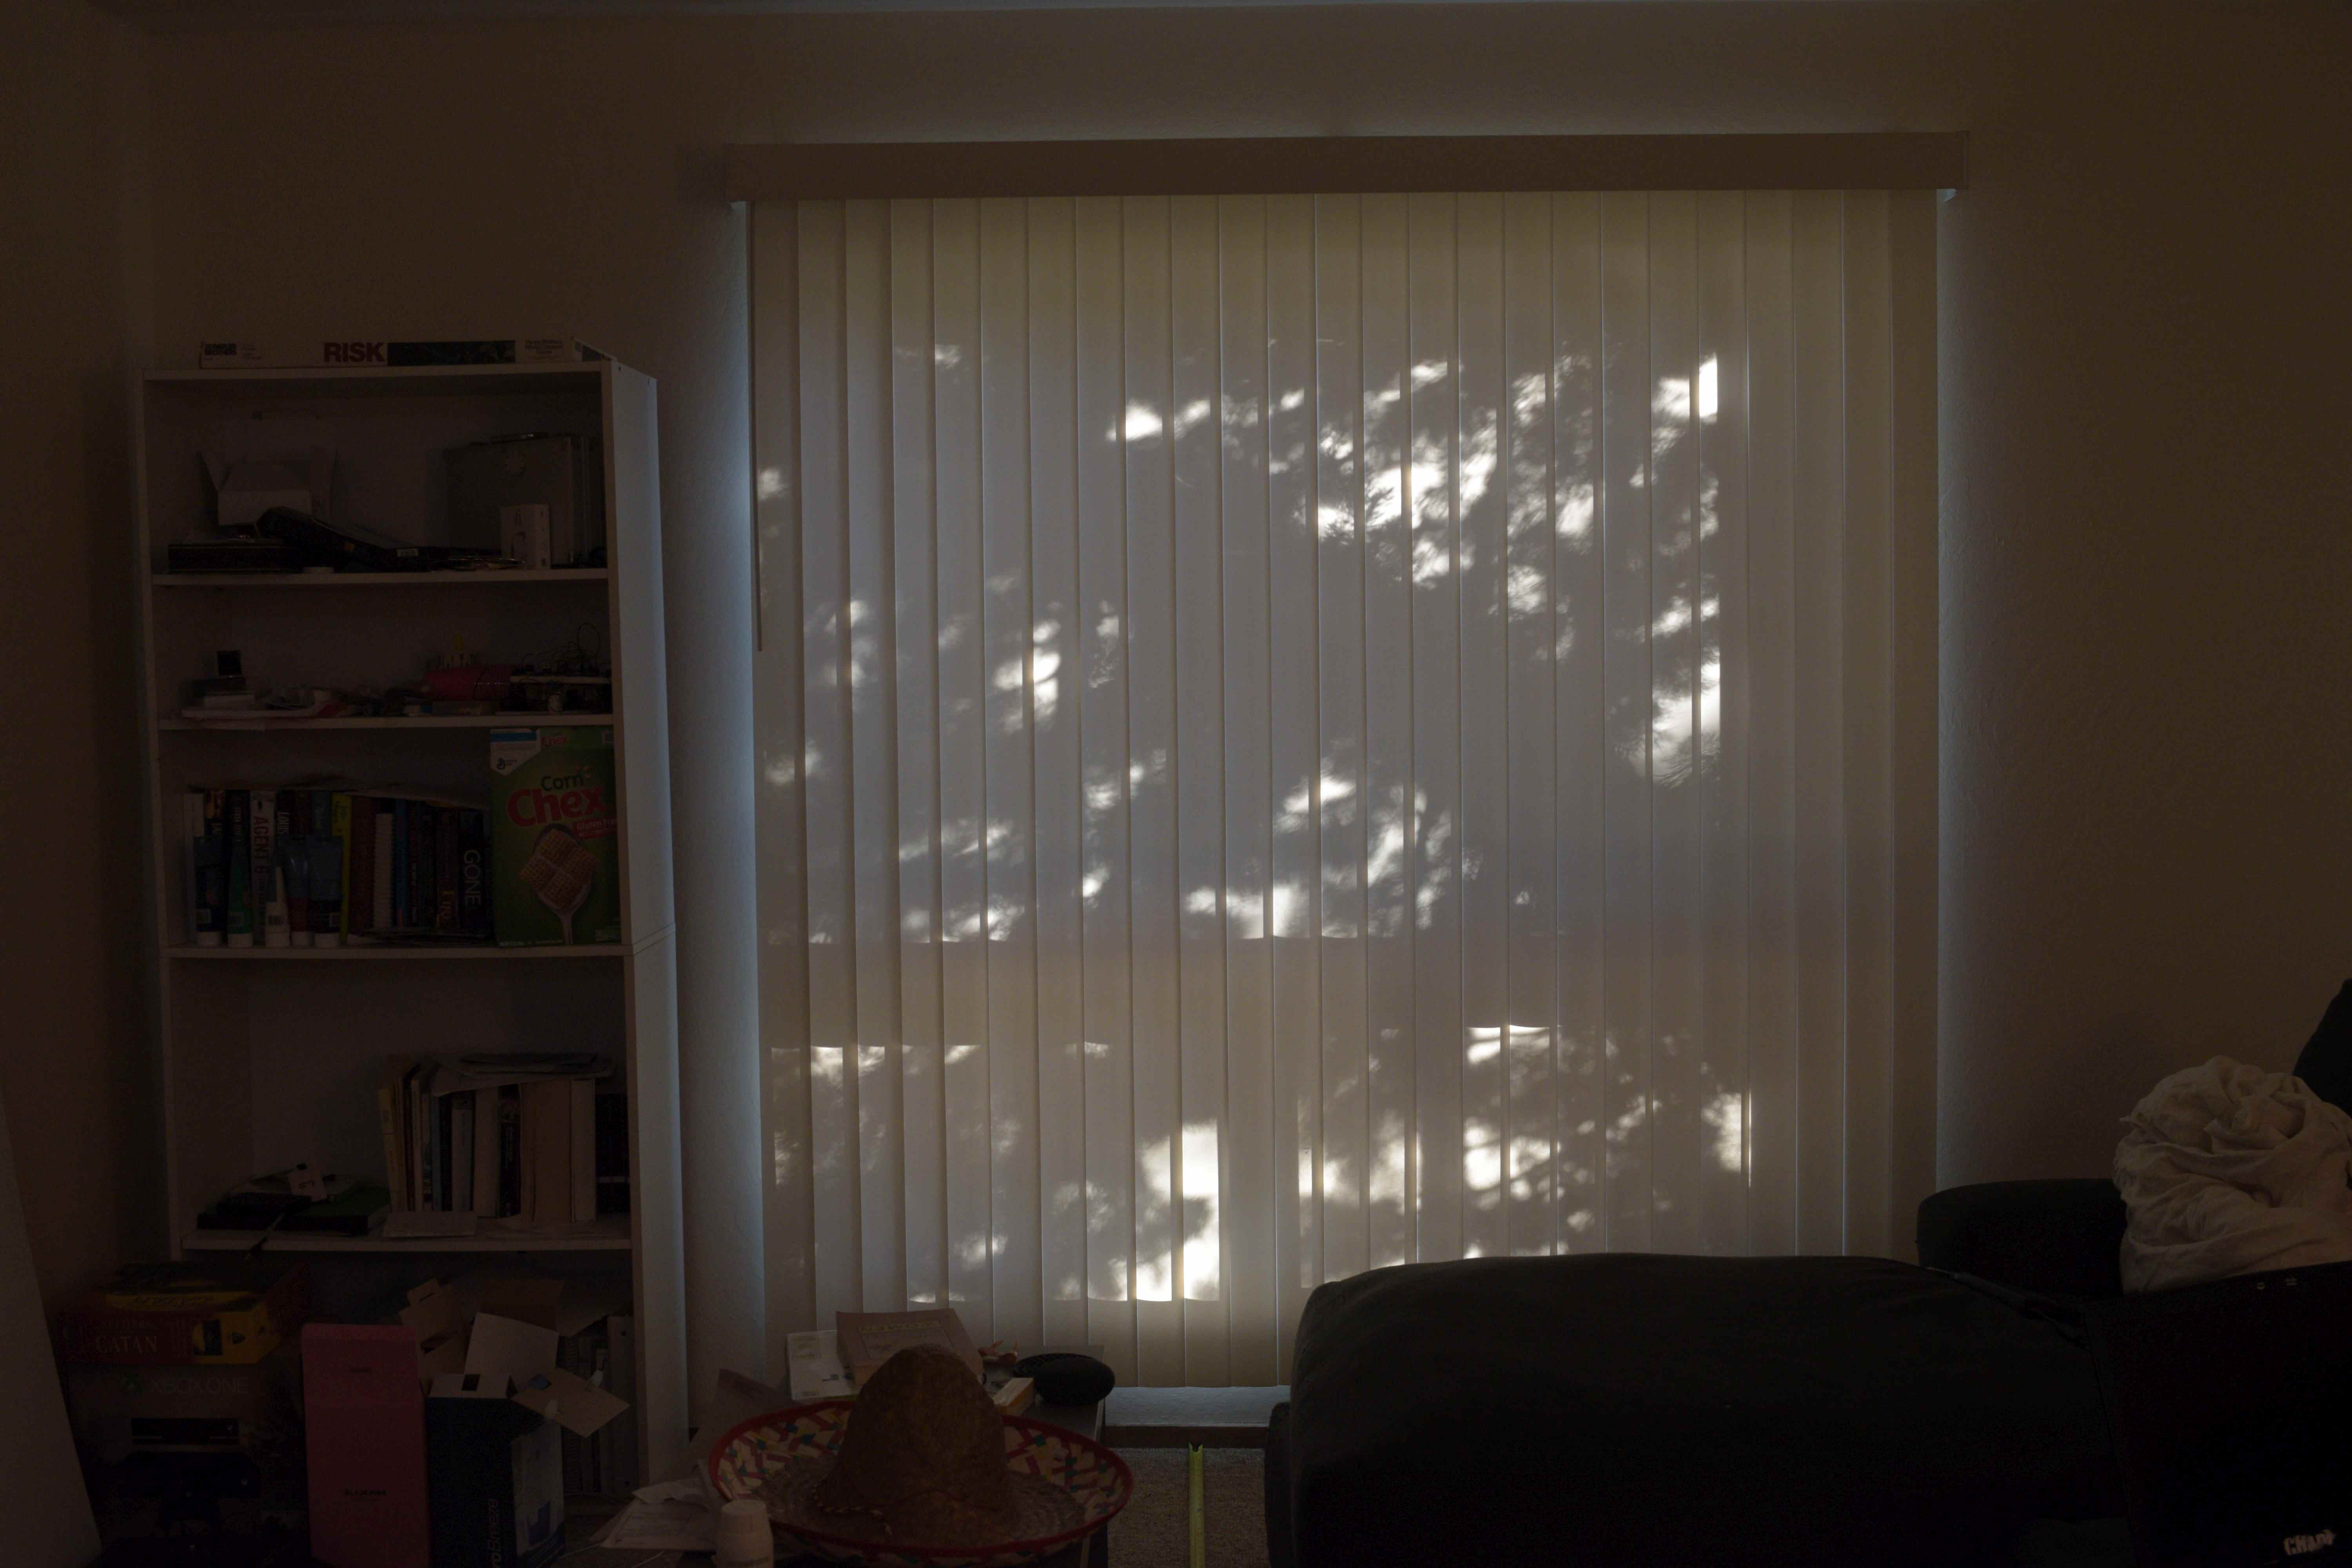
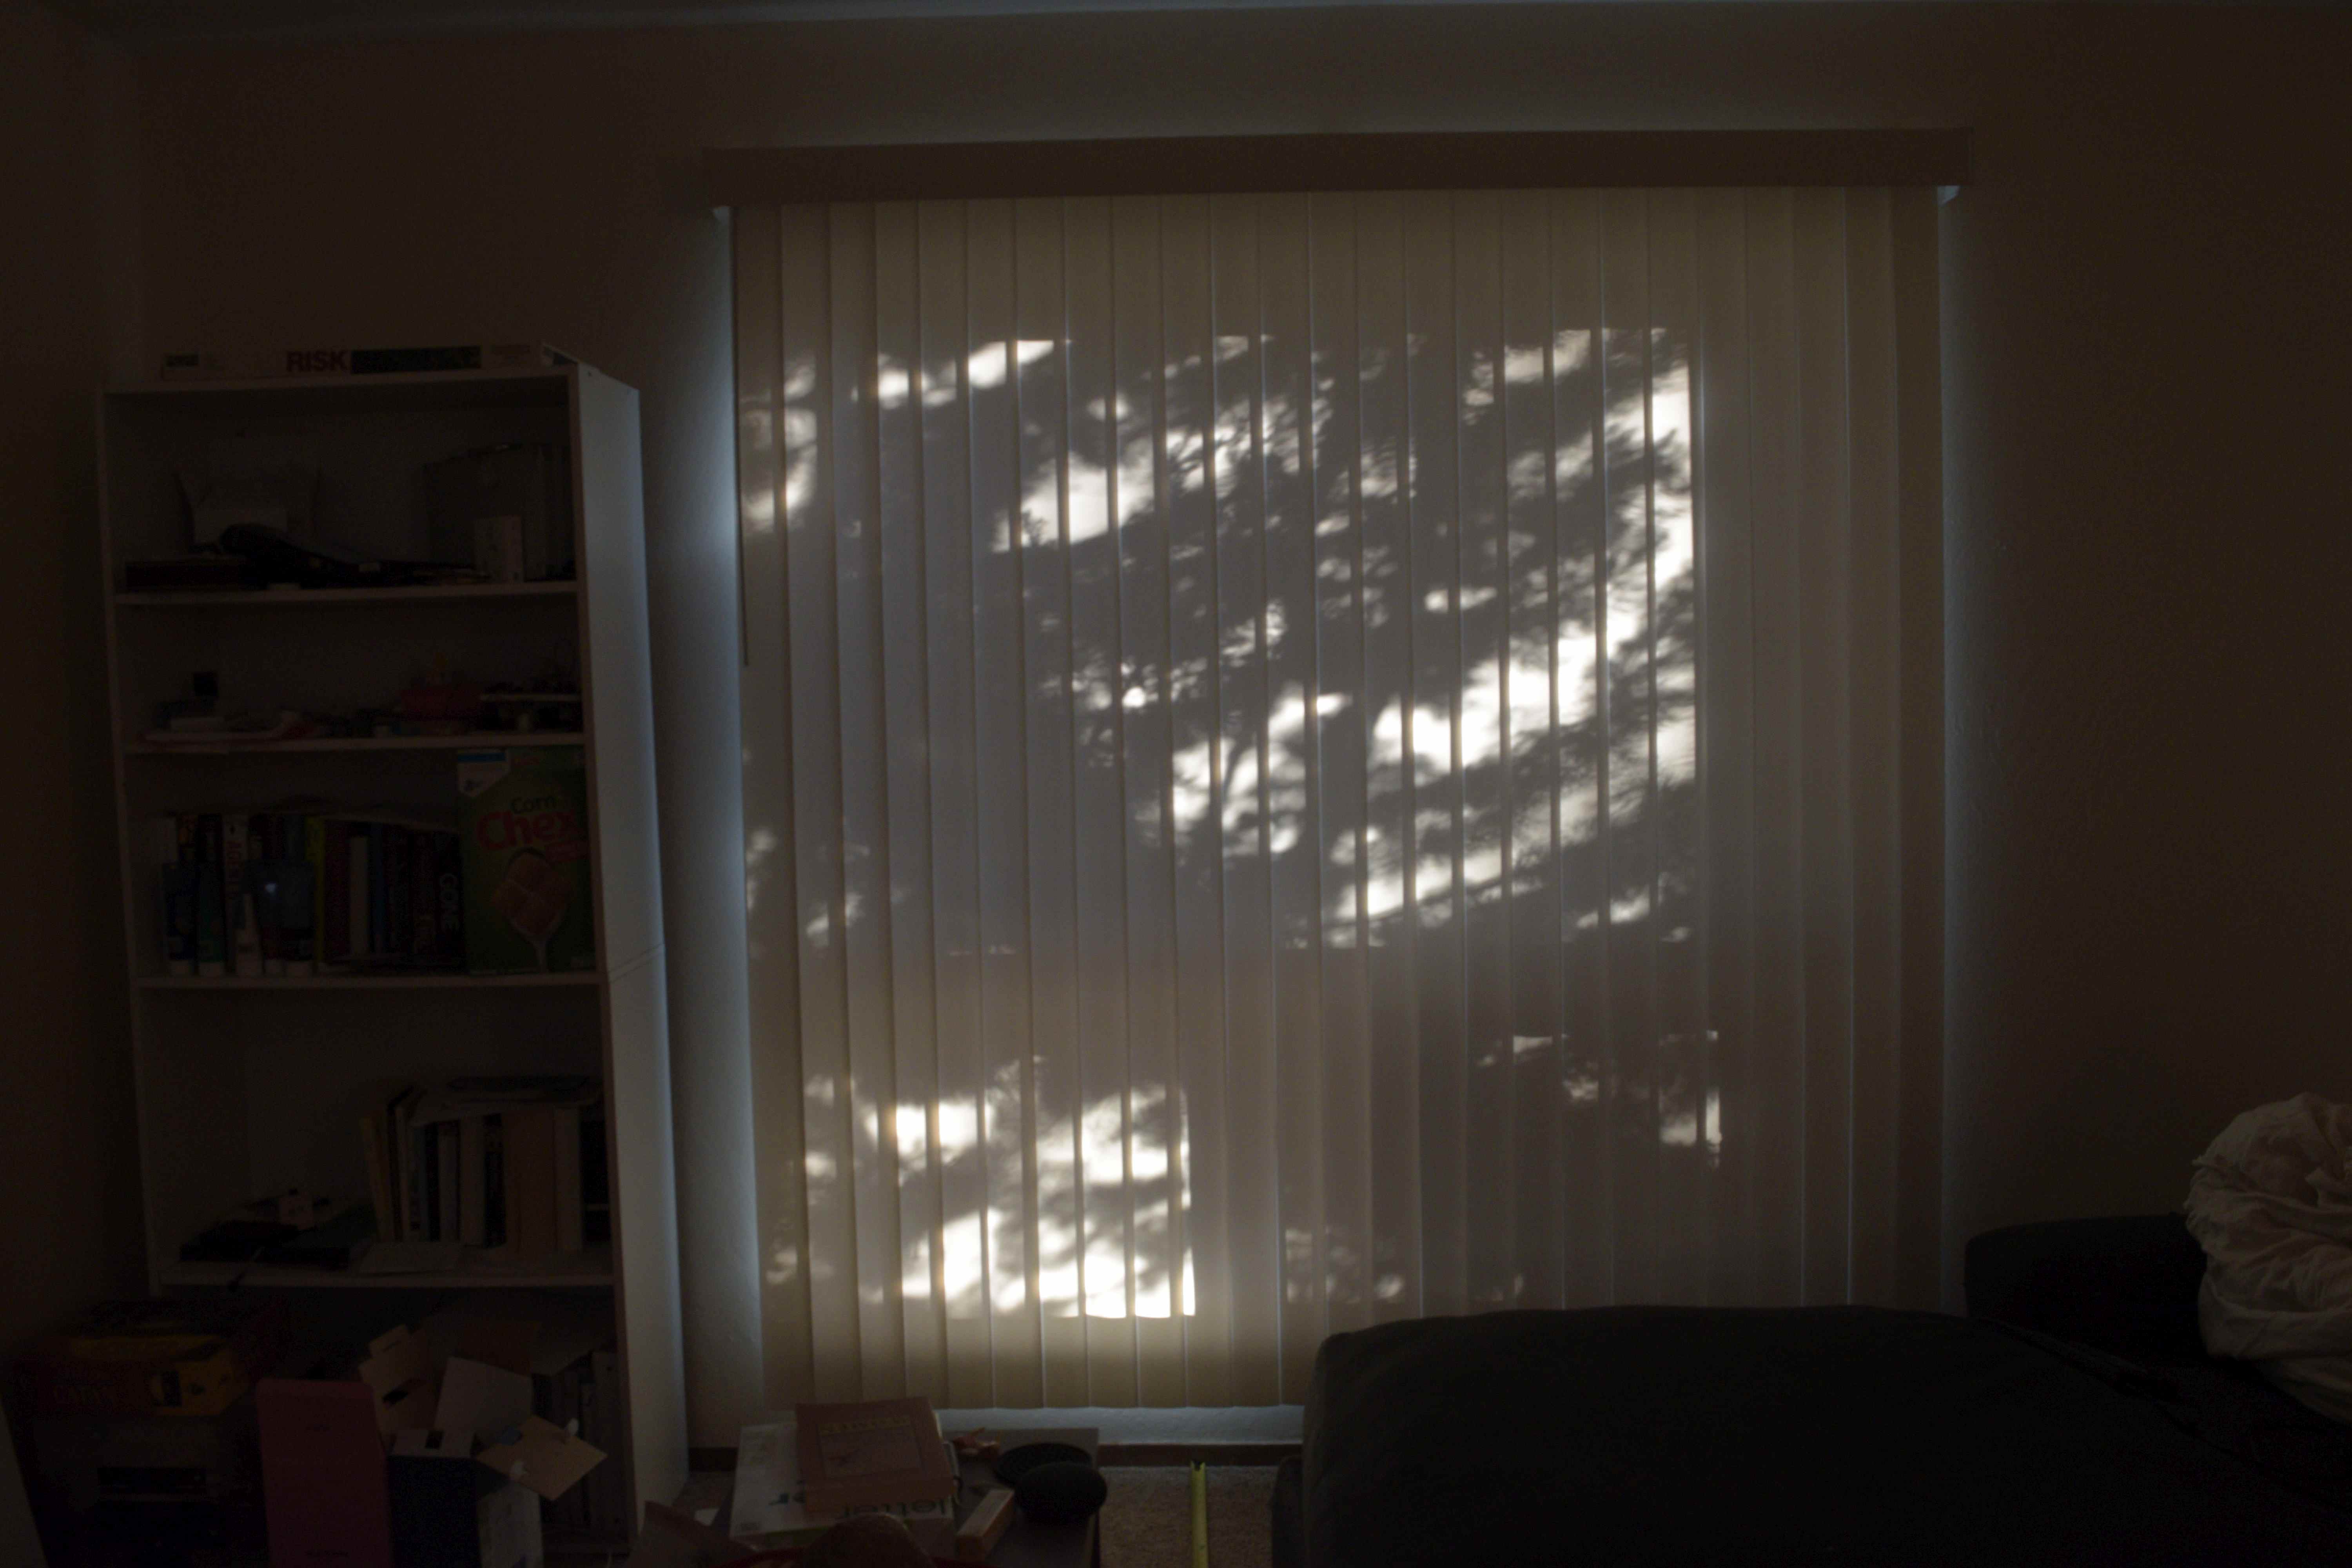
This project involved taking a series of images with different fovs while keeping a subject in the image in focus.
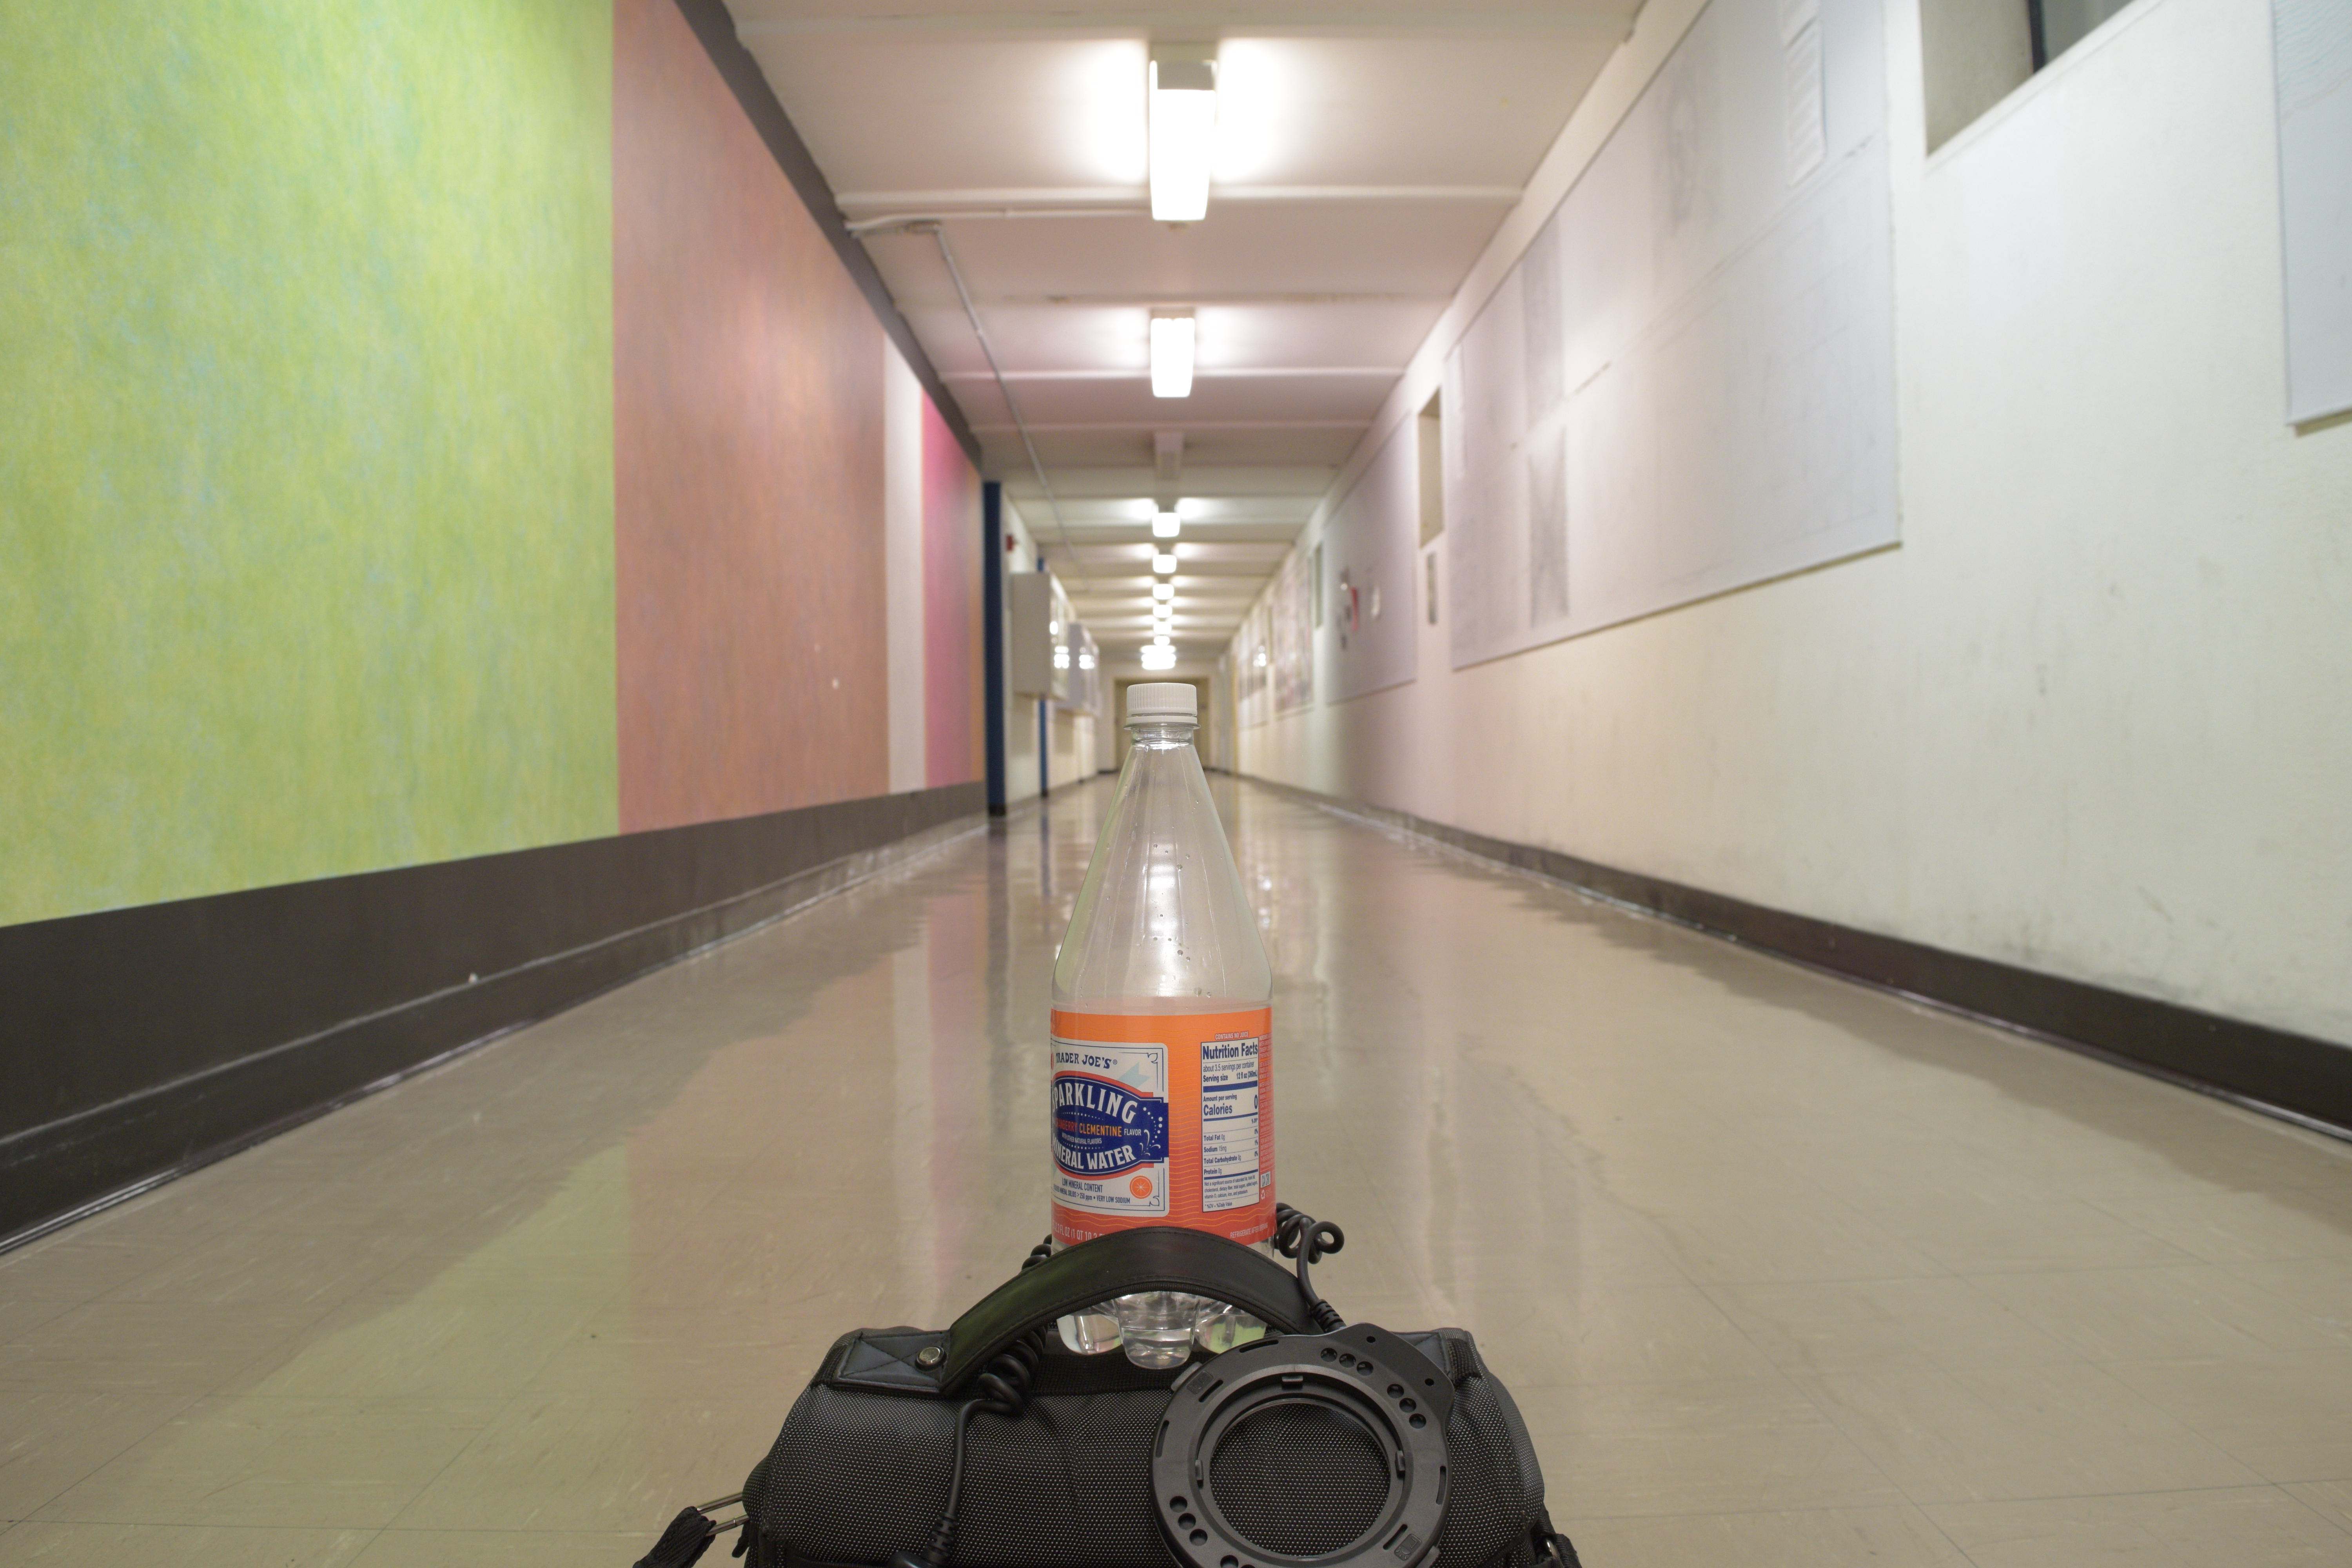
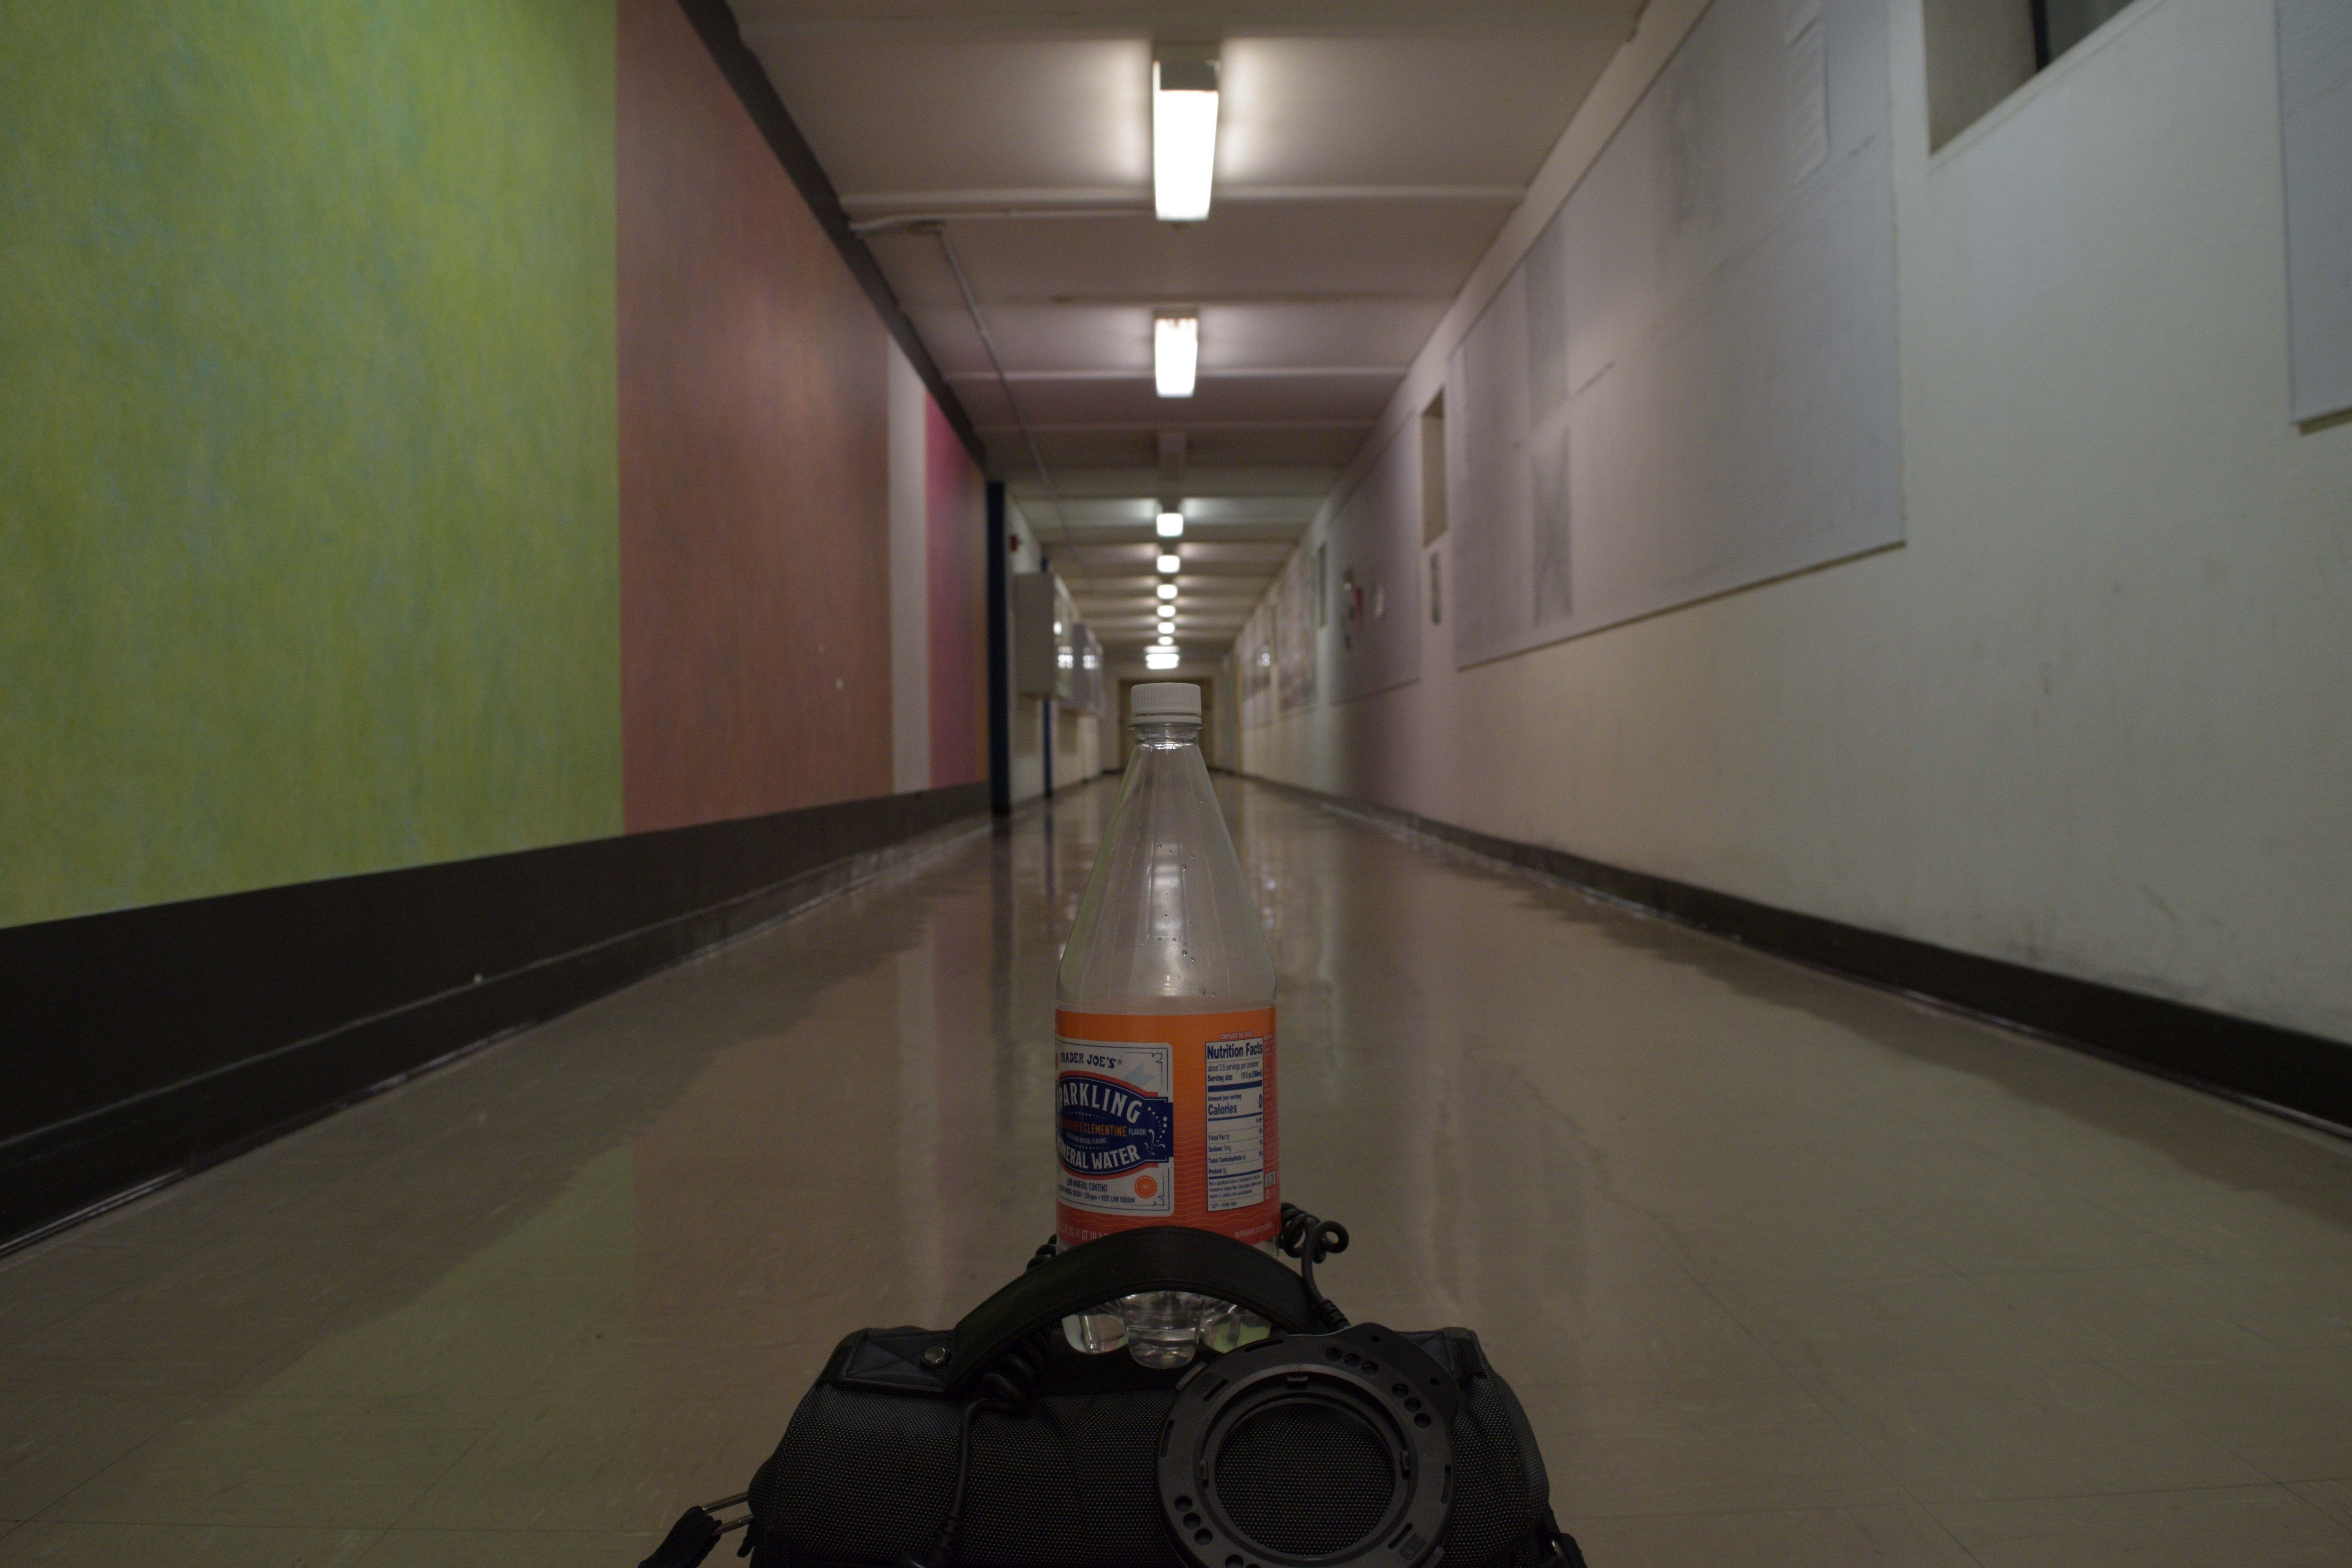
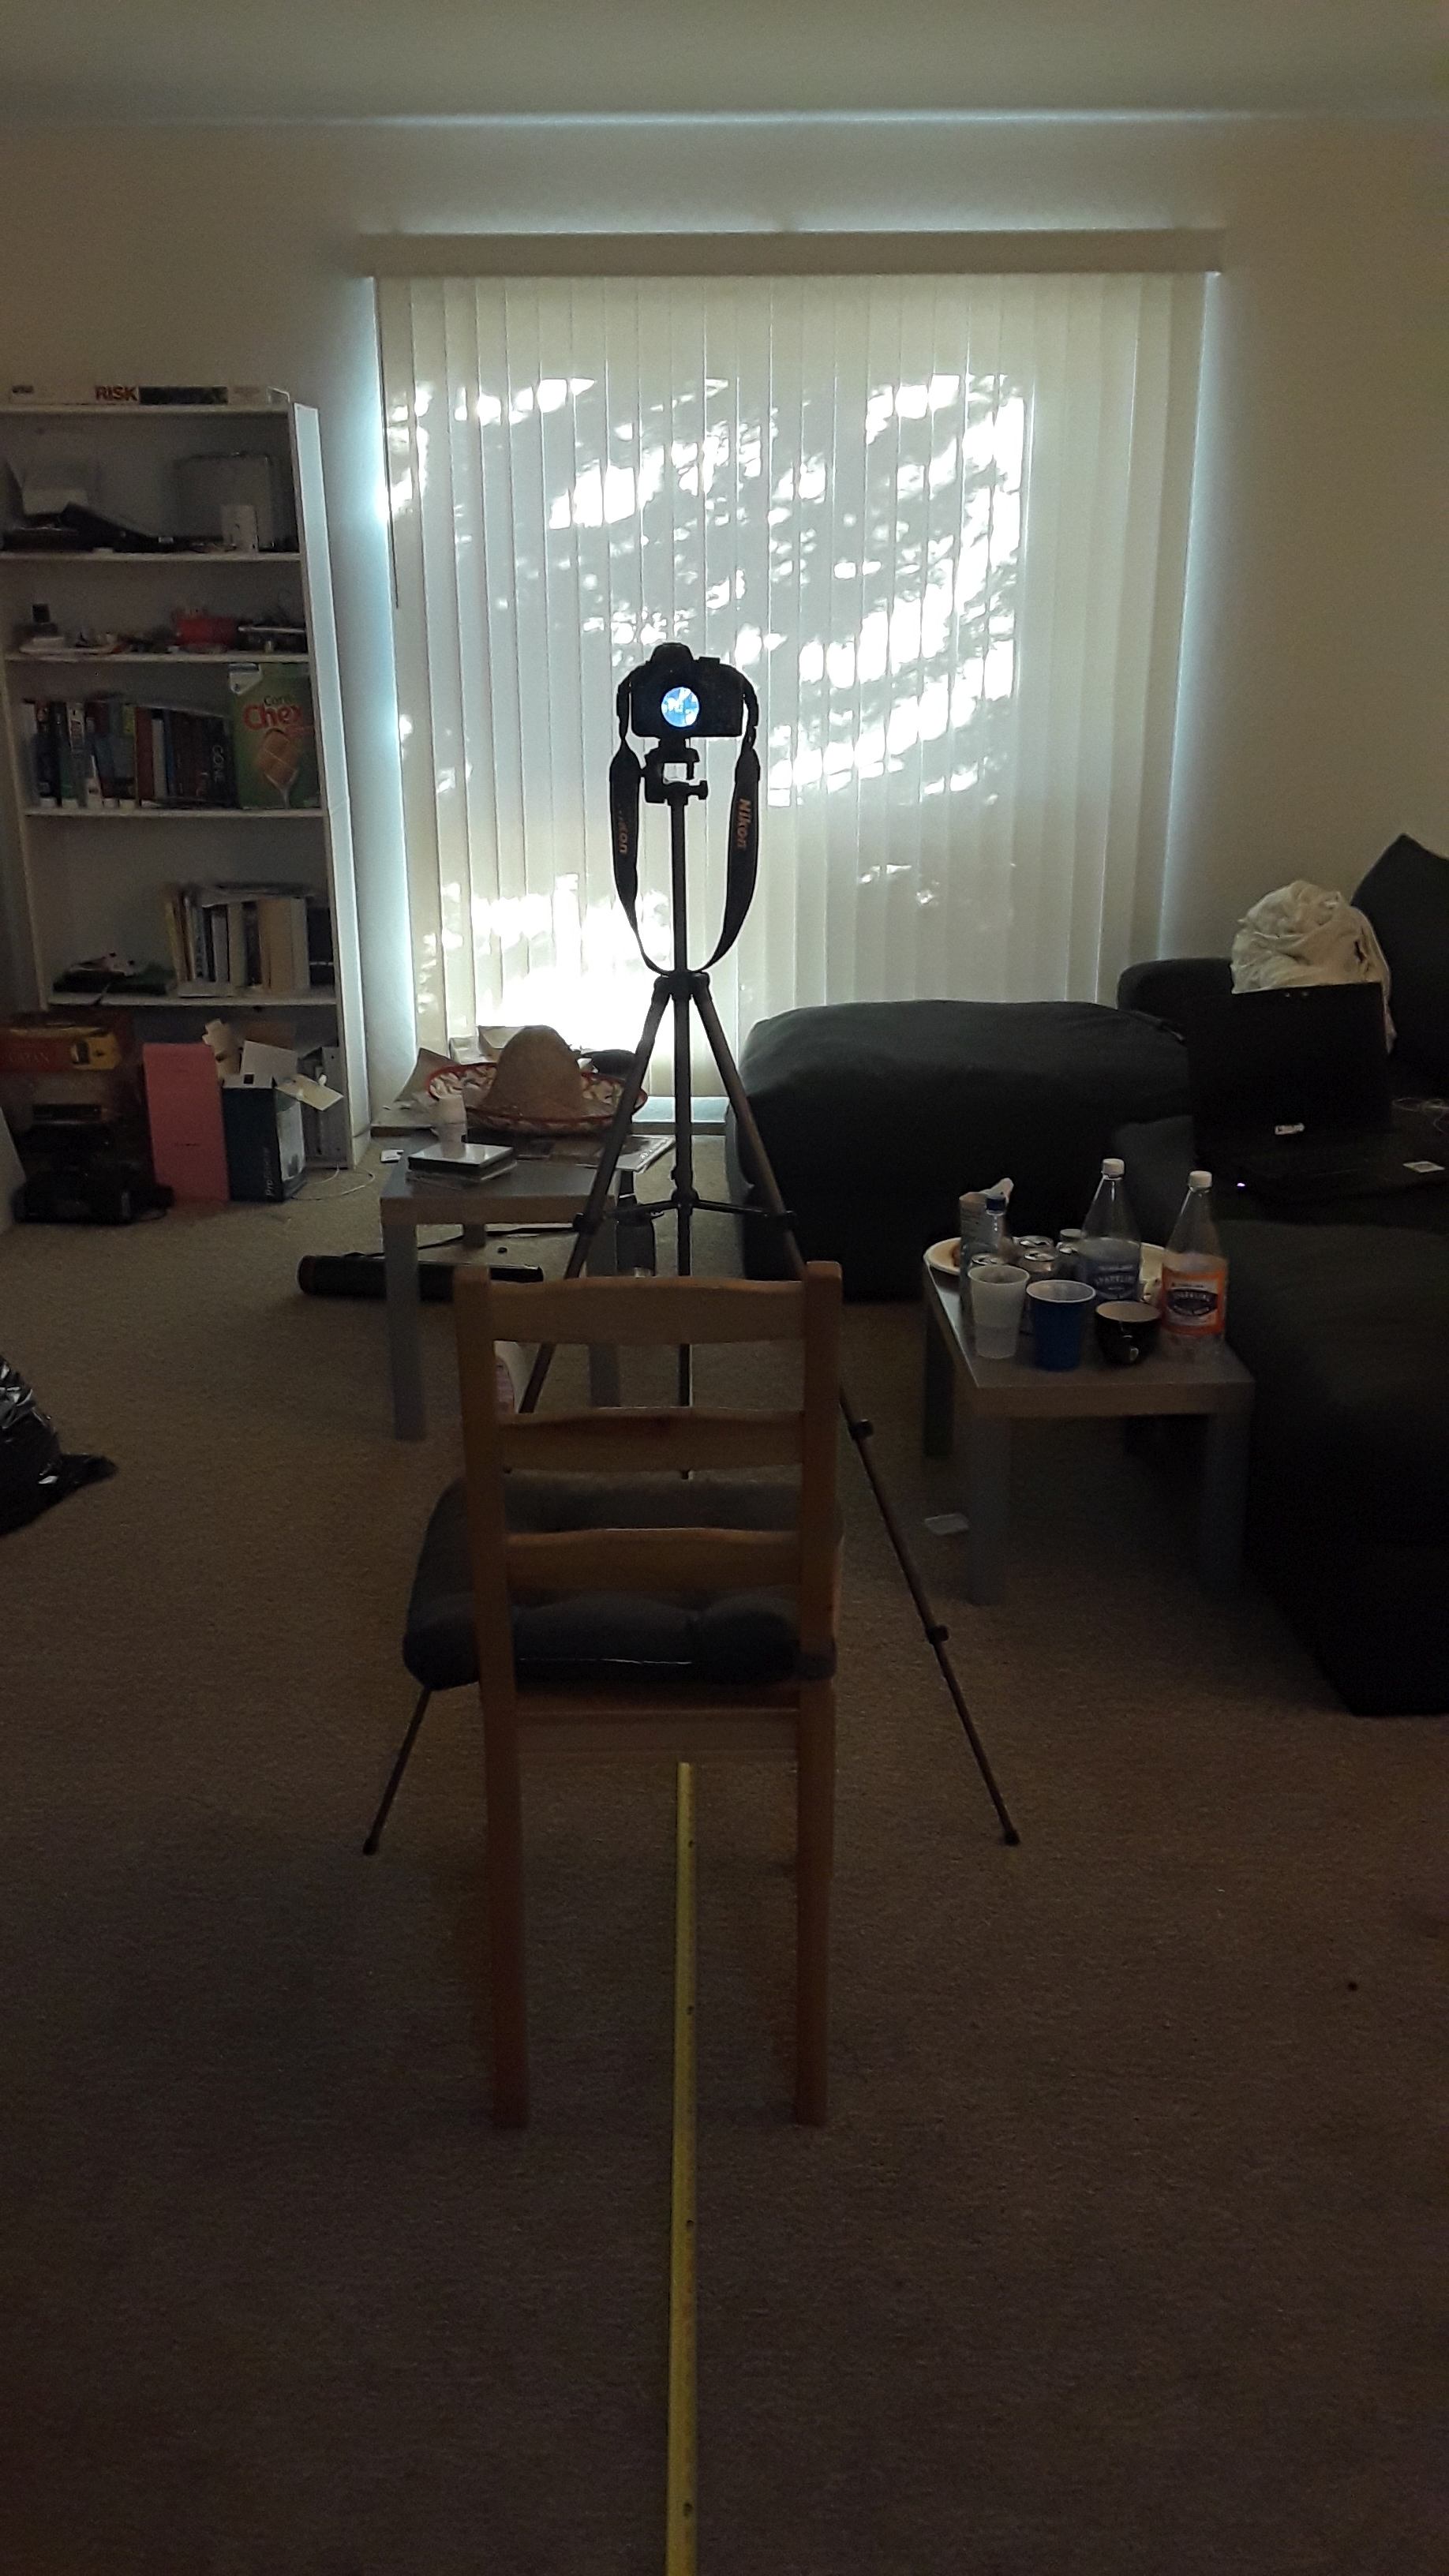
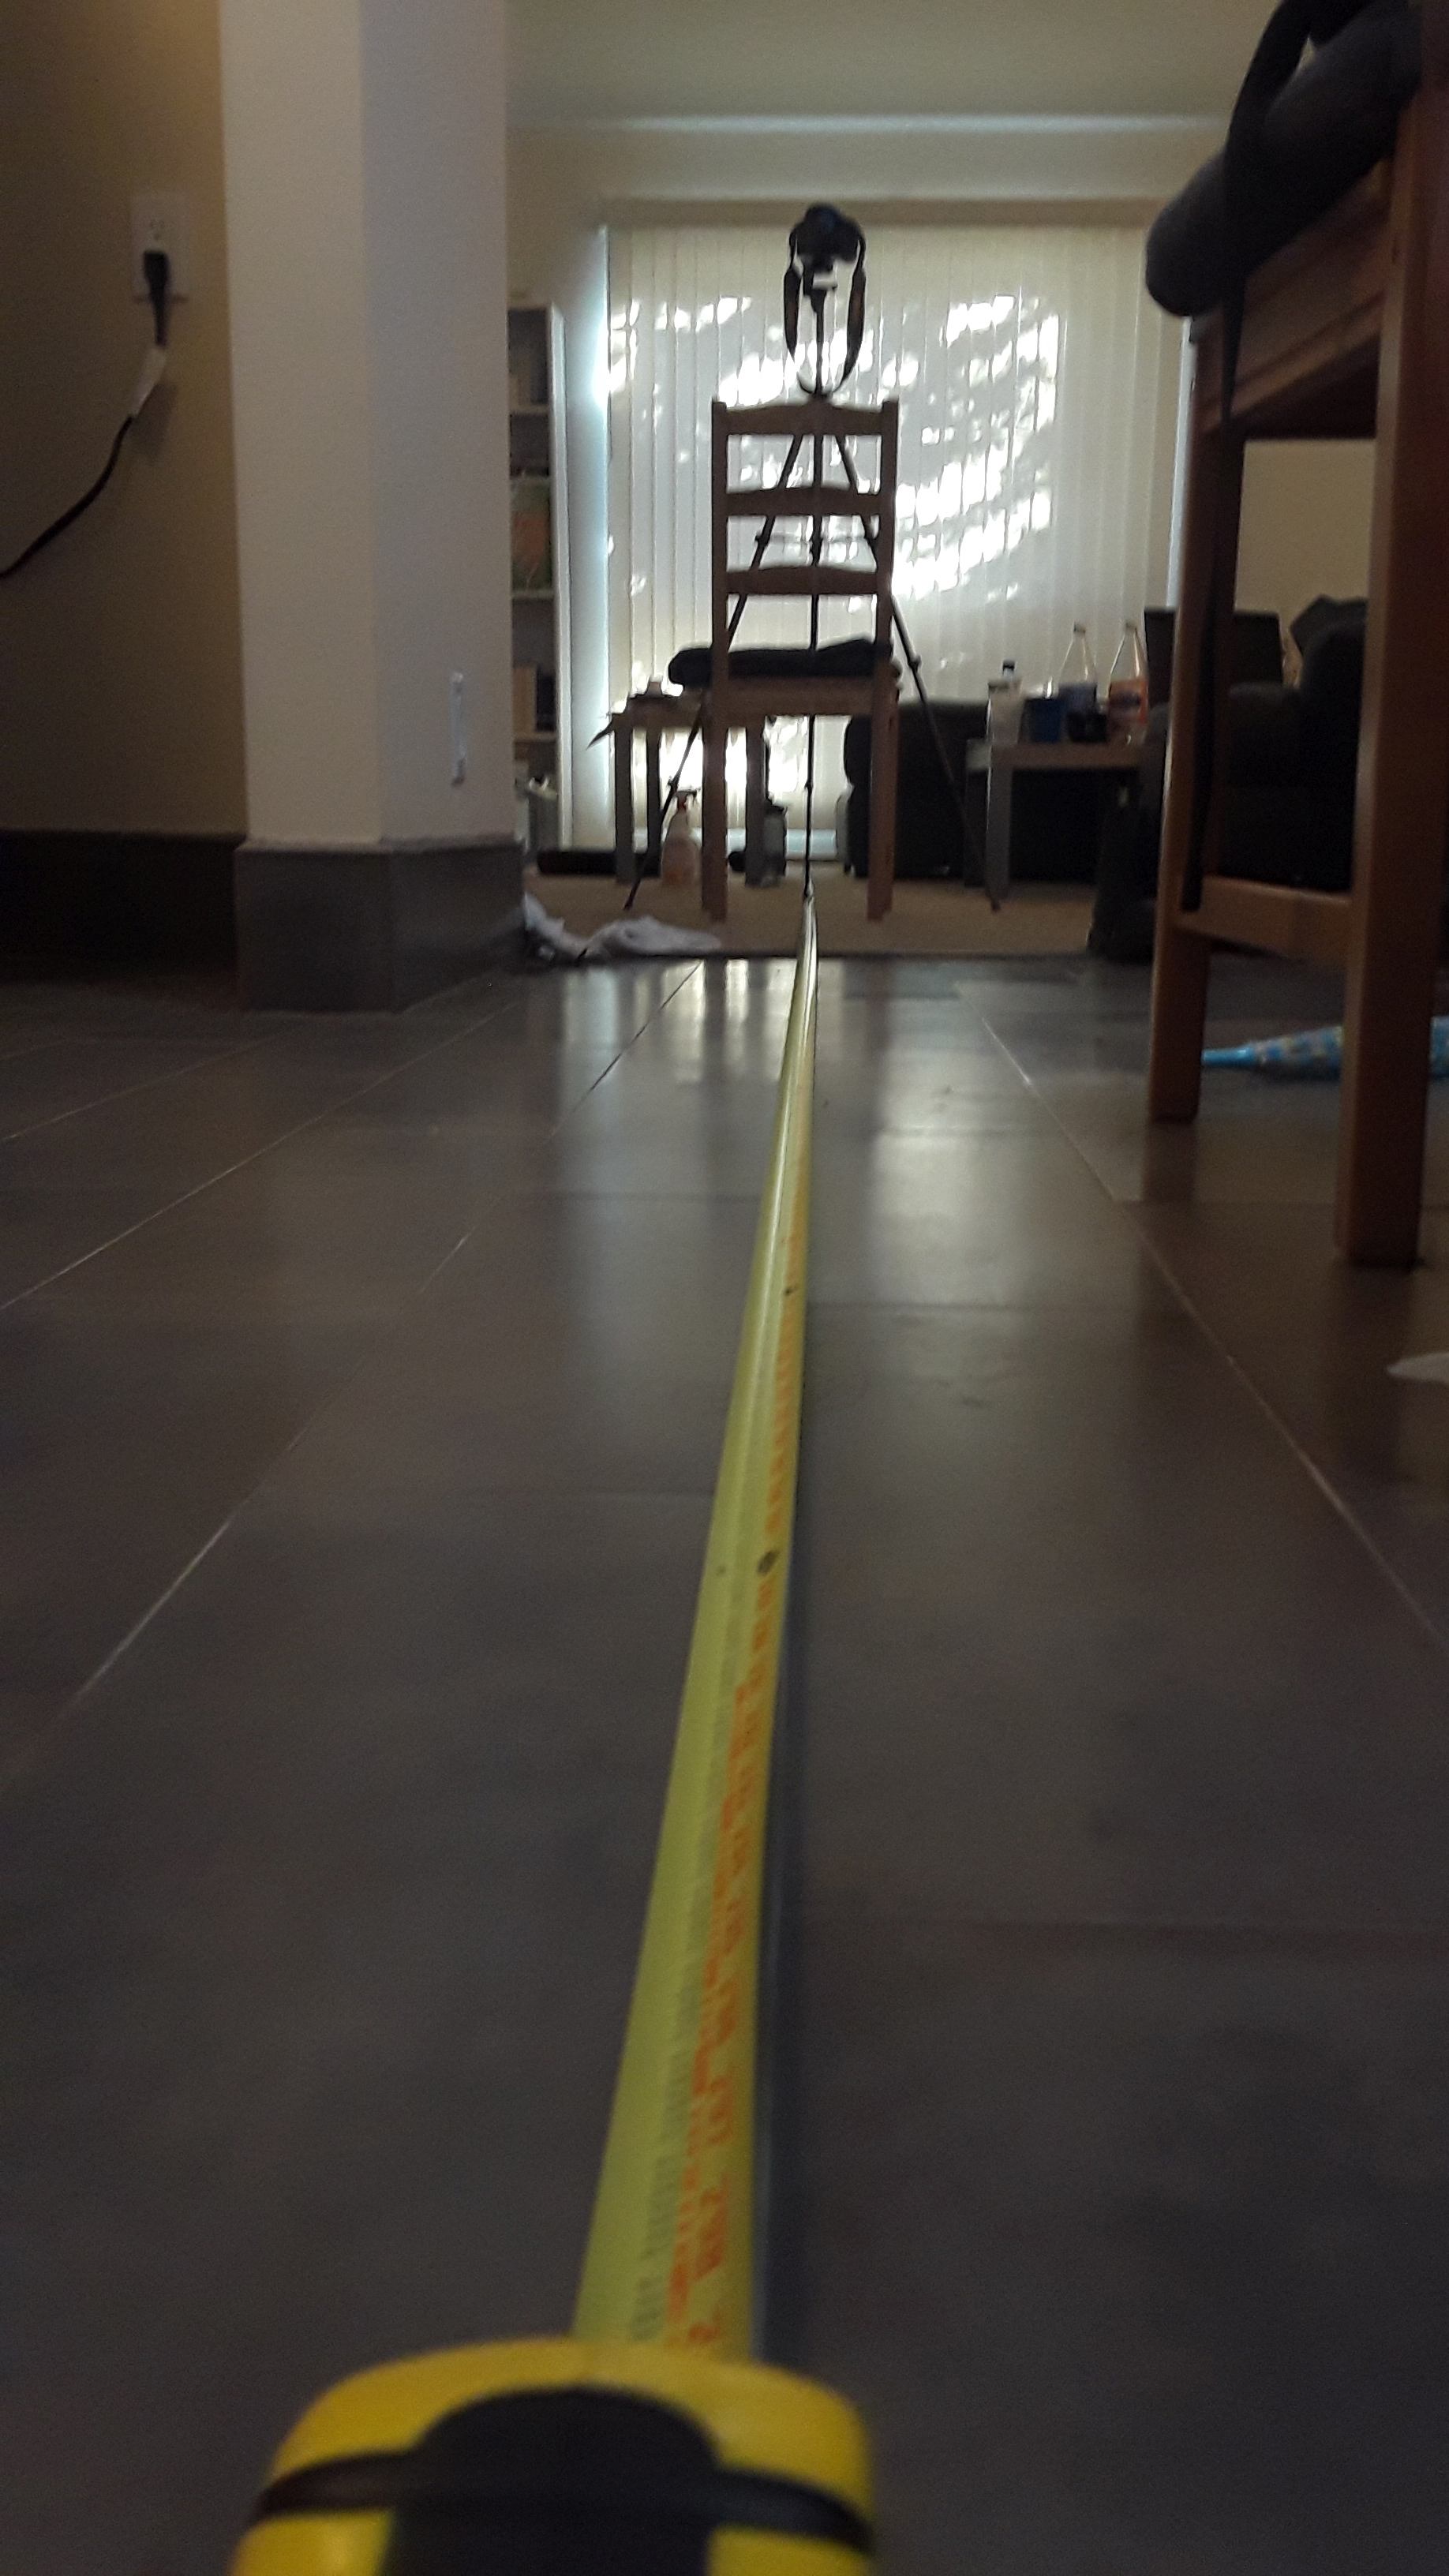
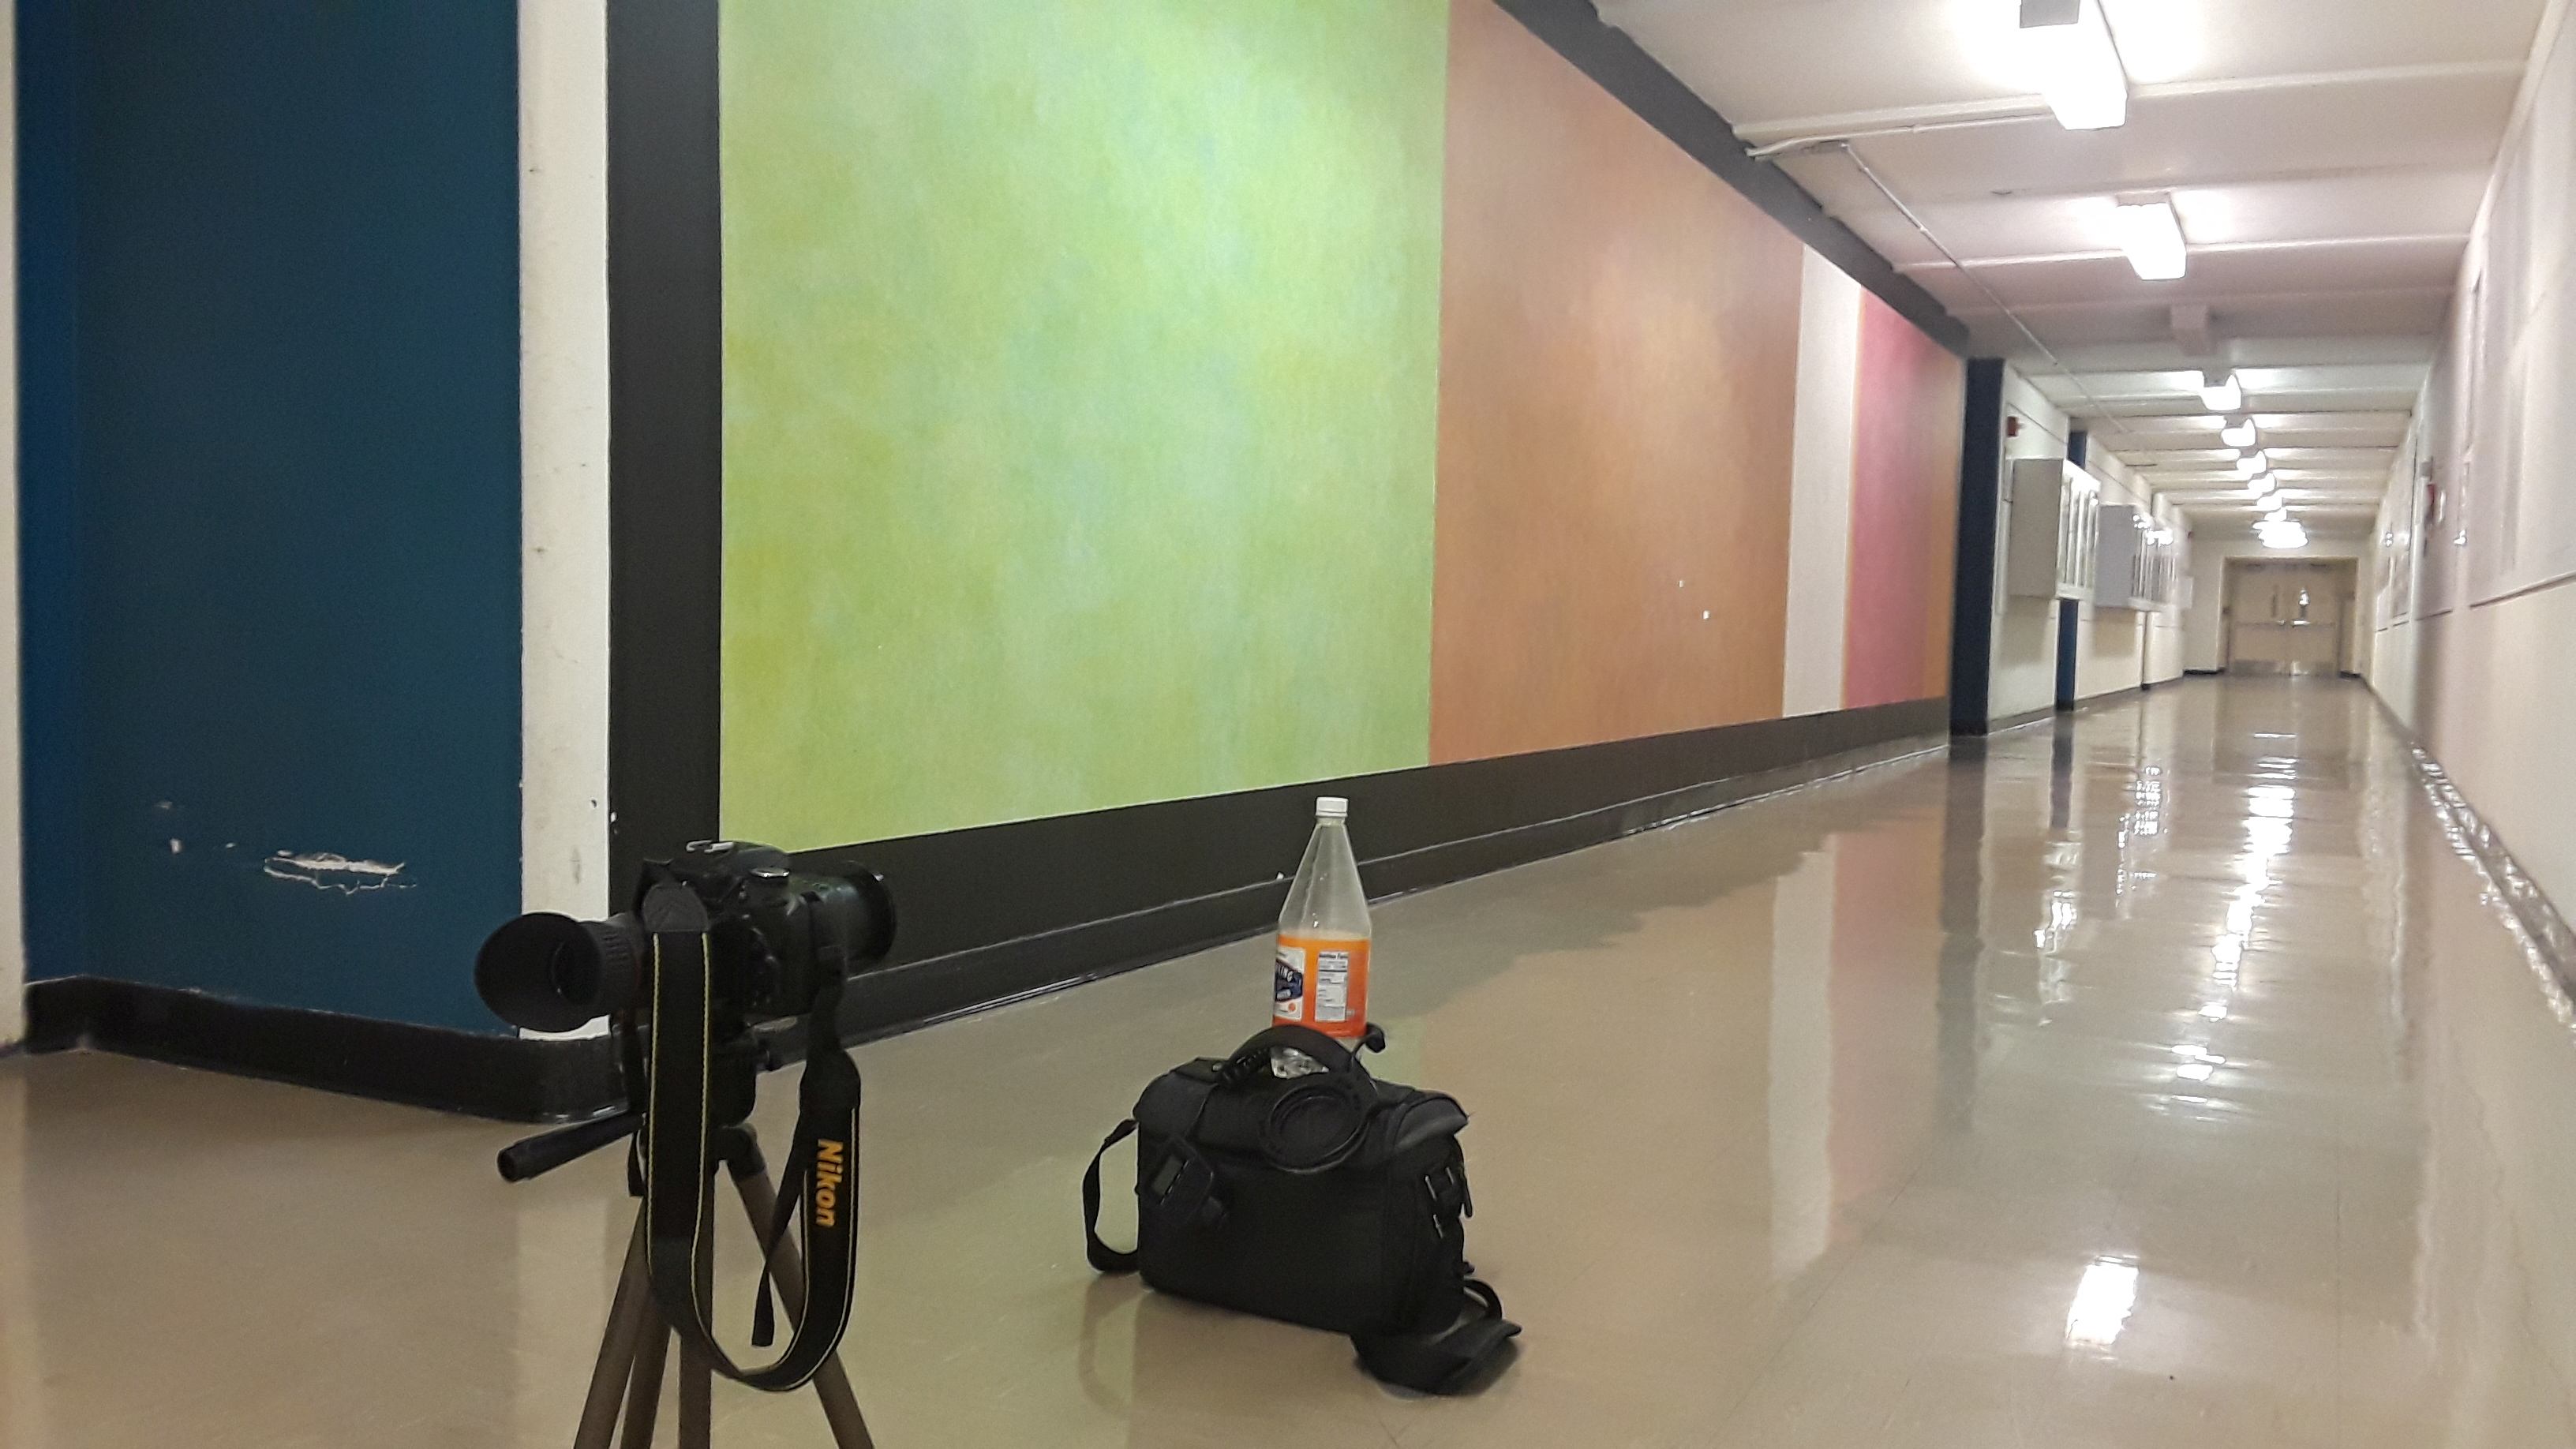
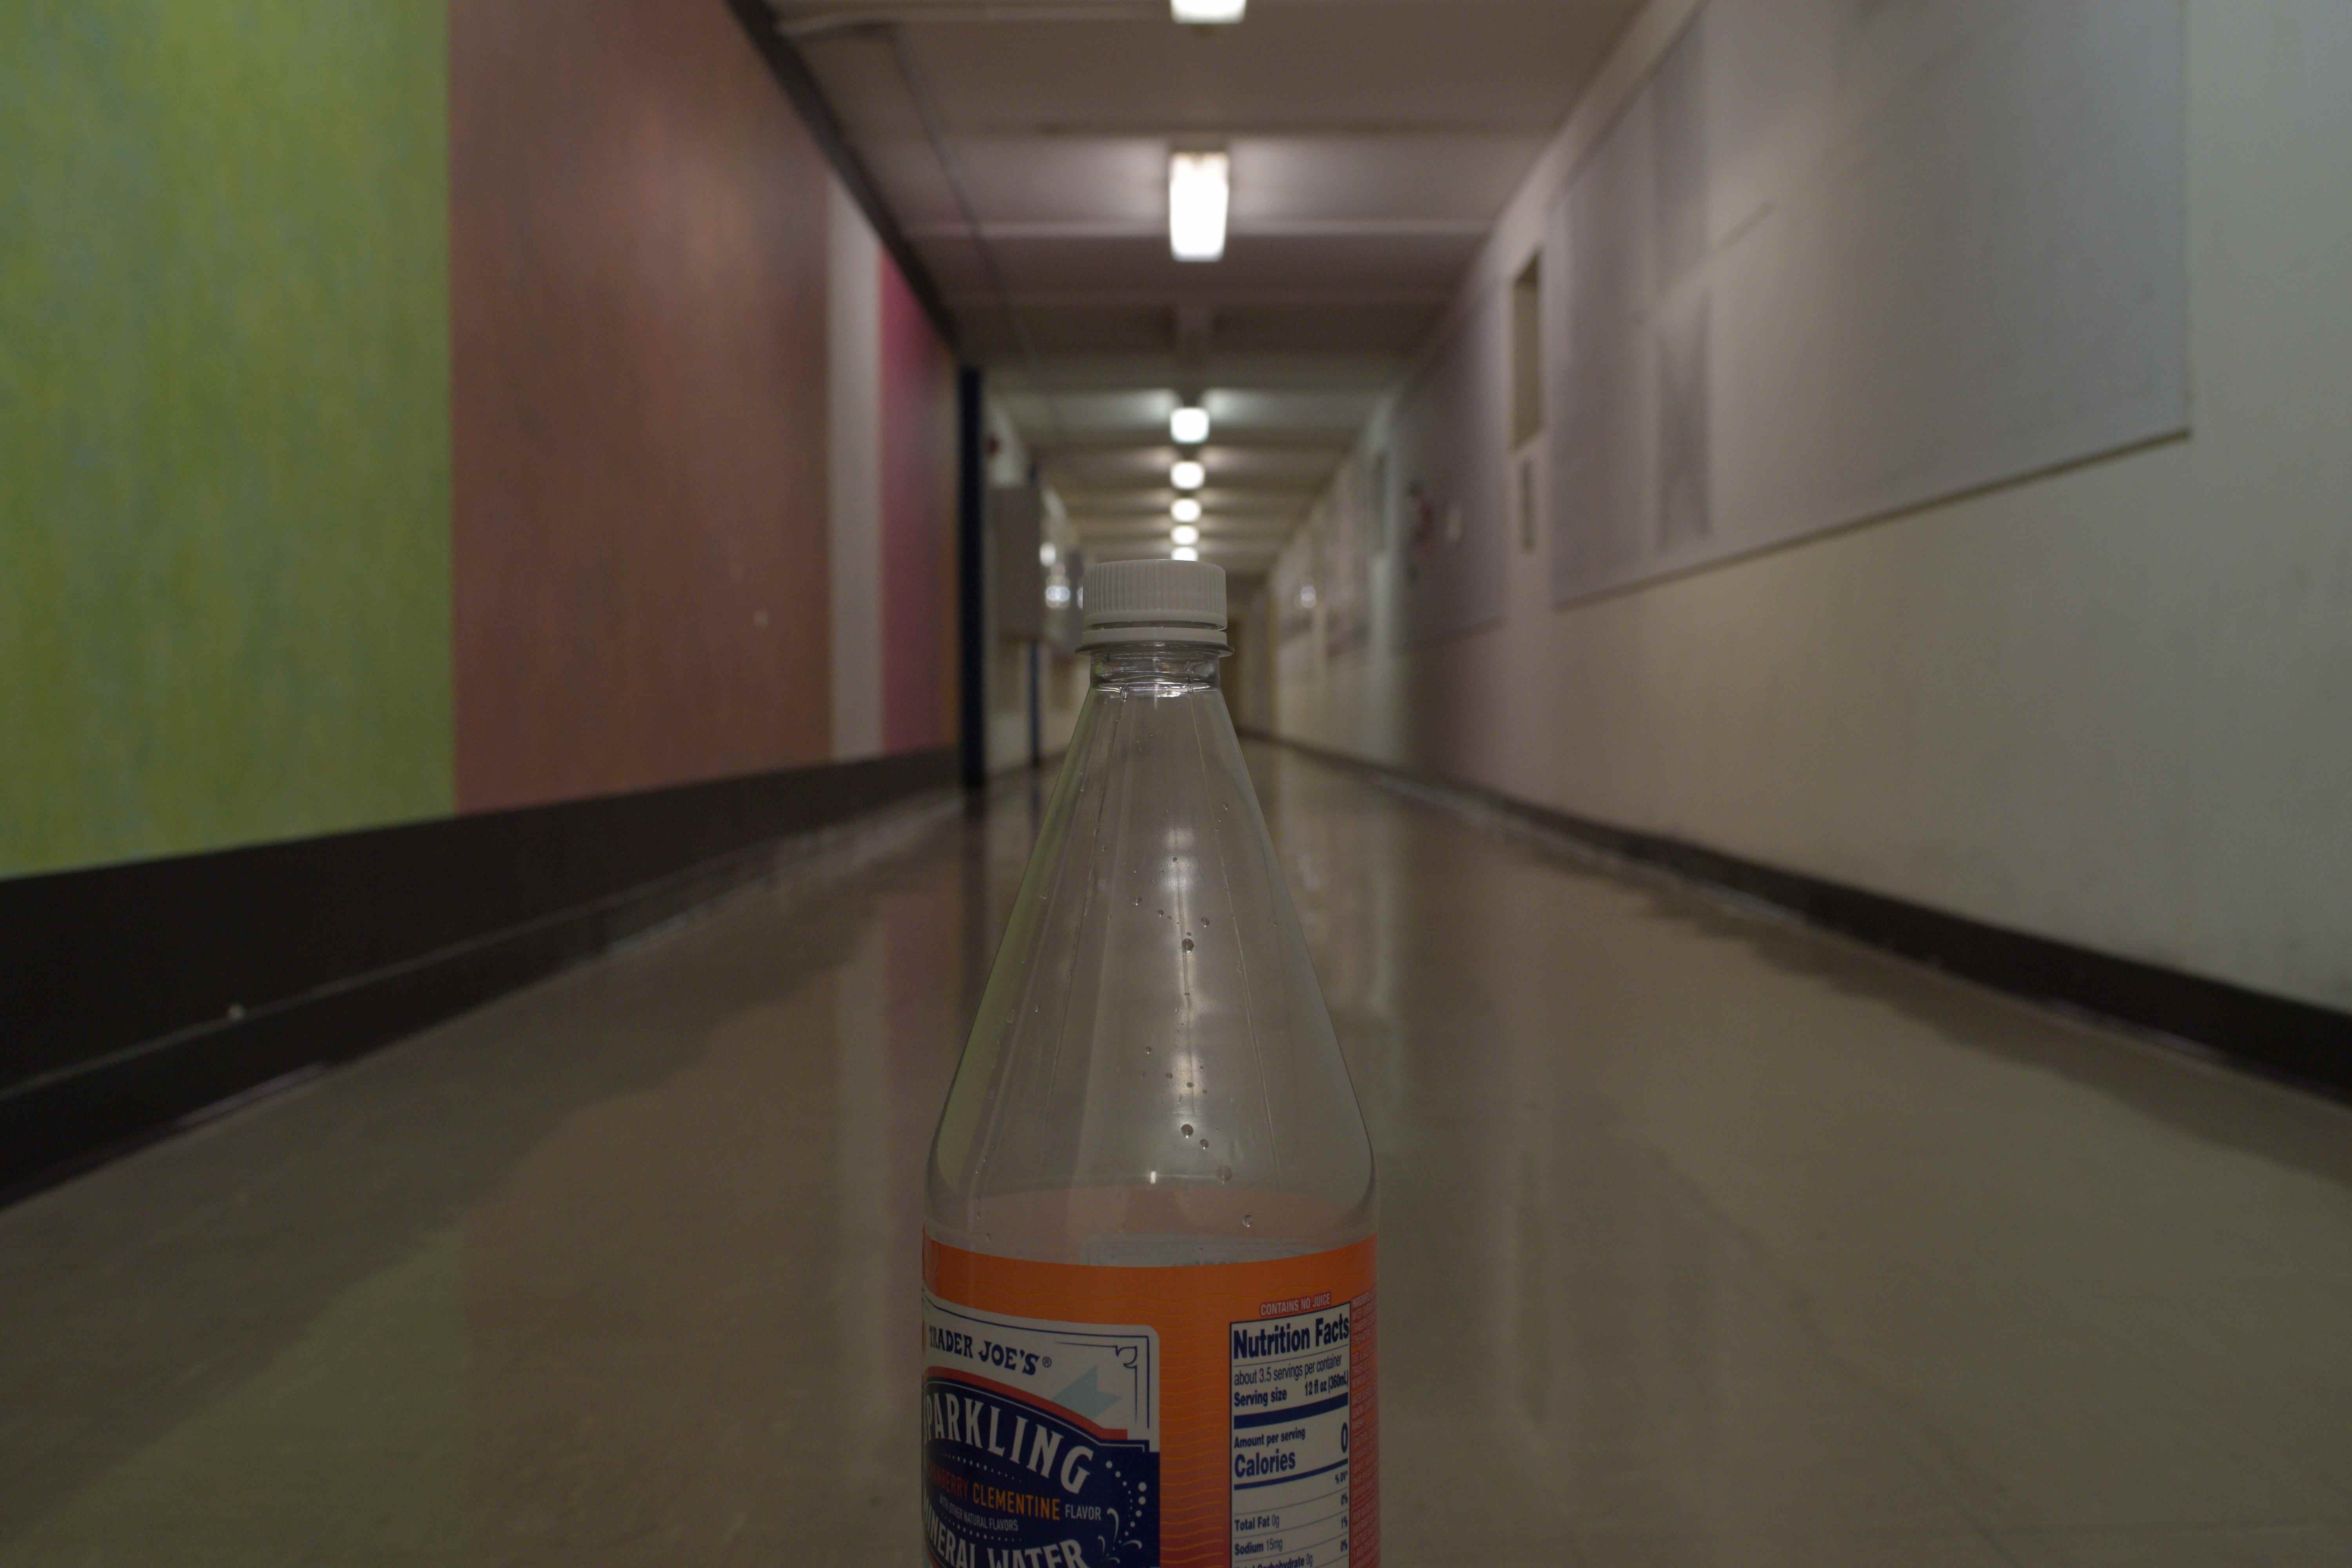
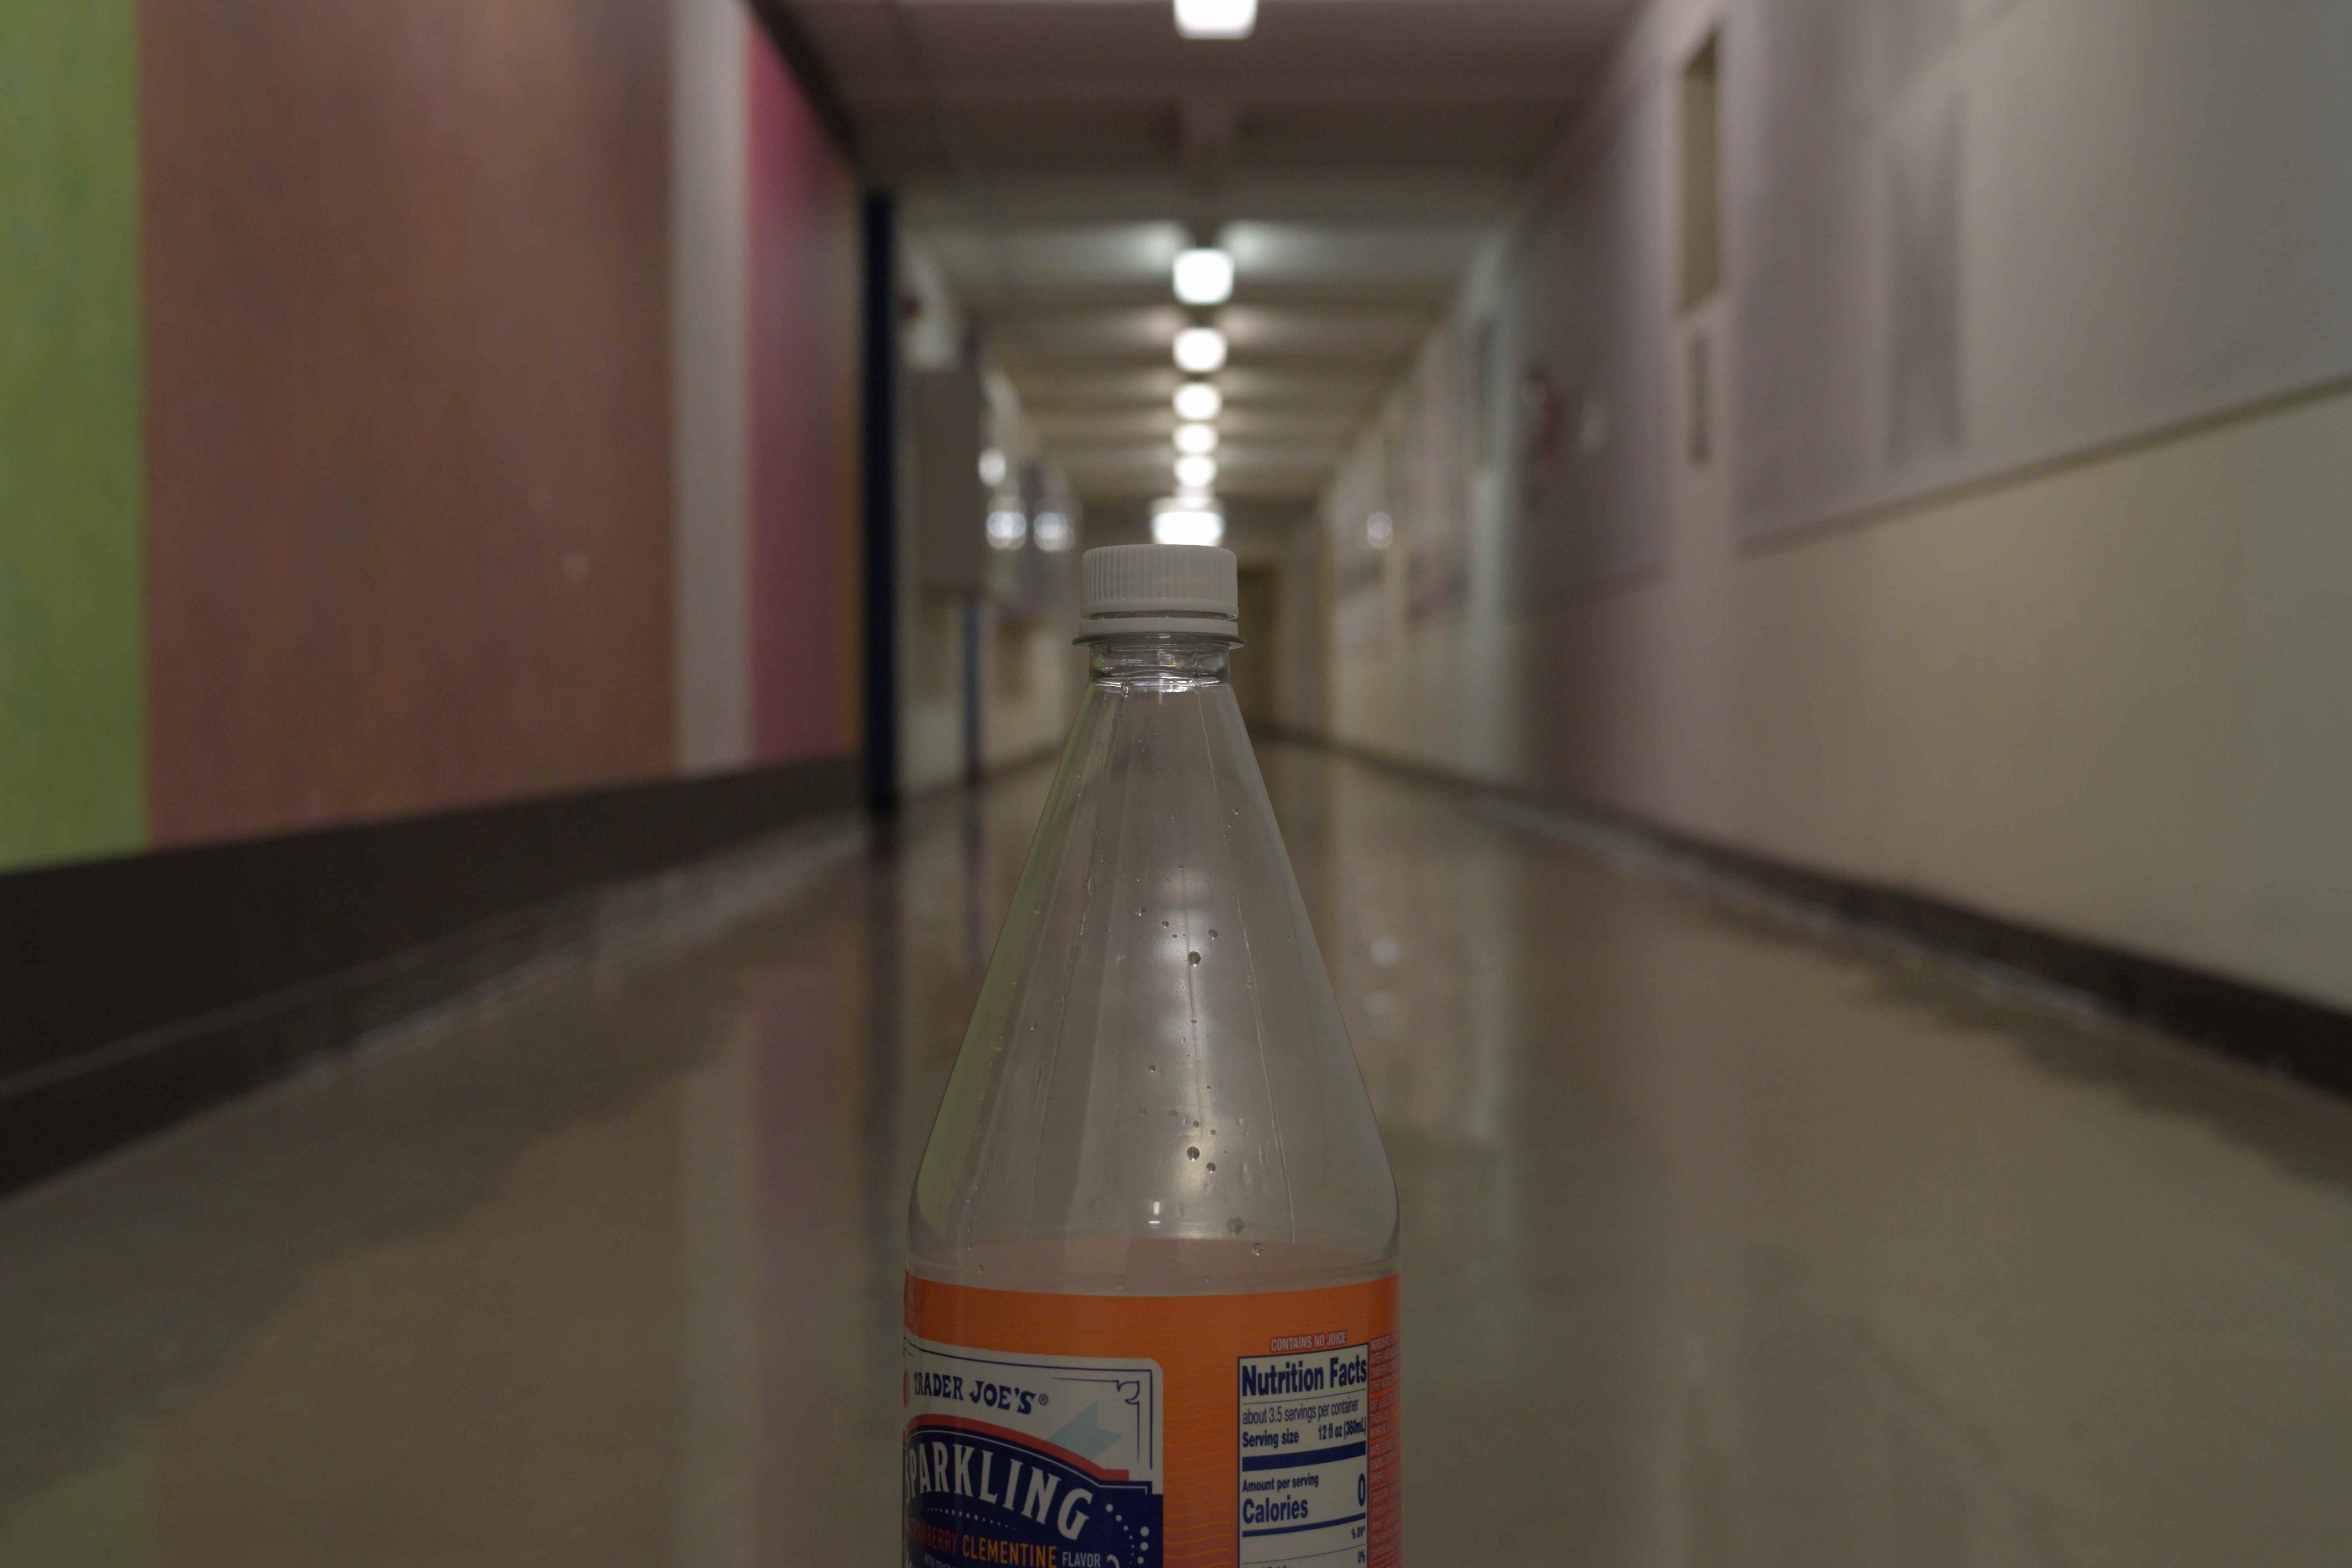
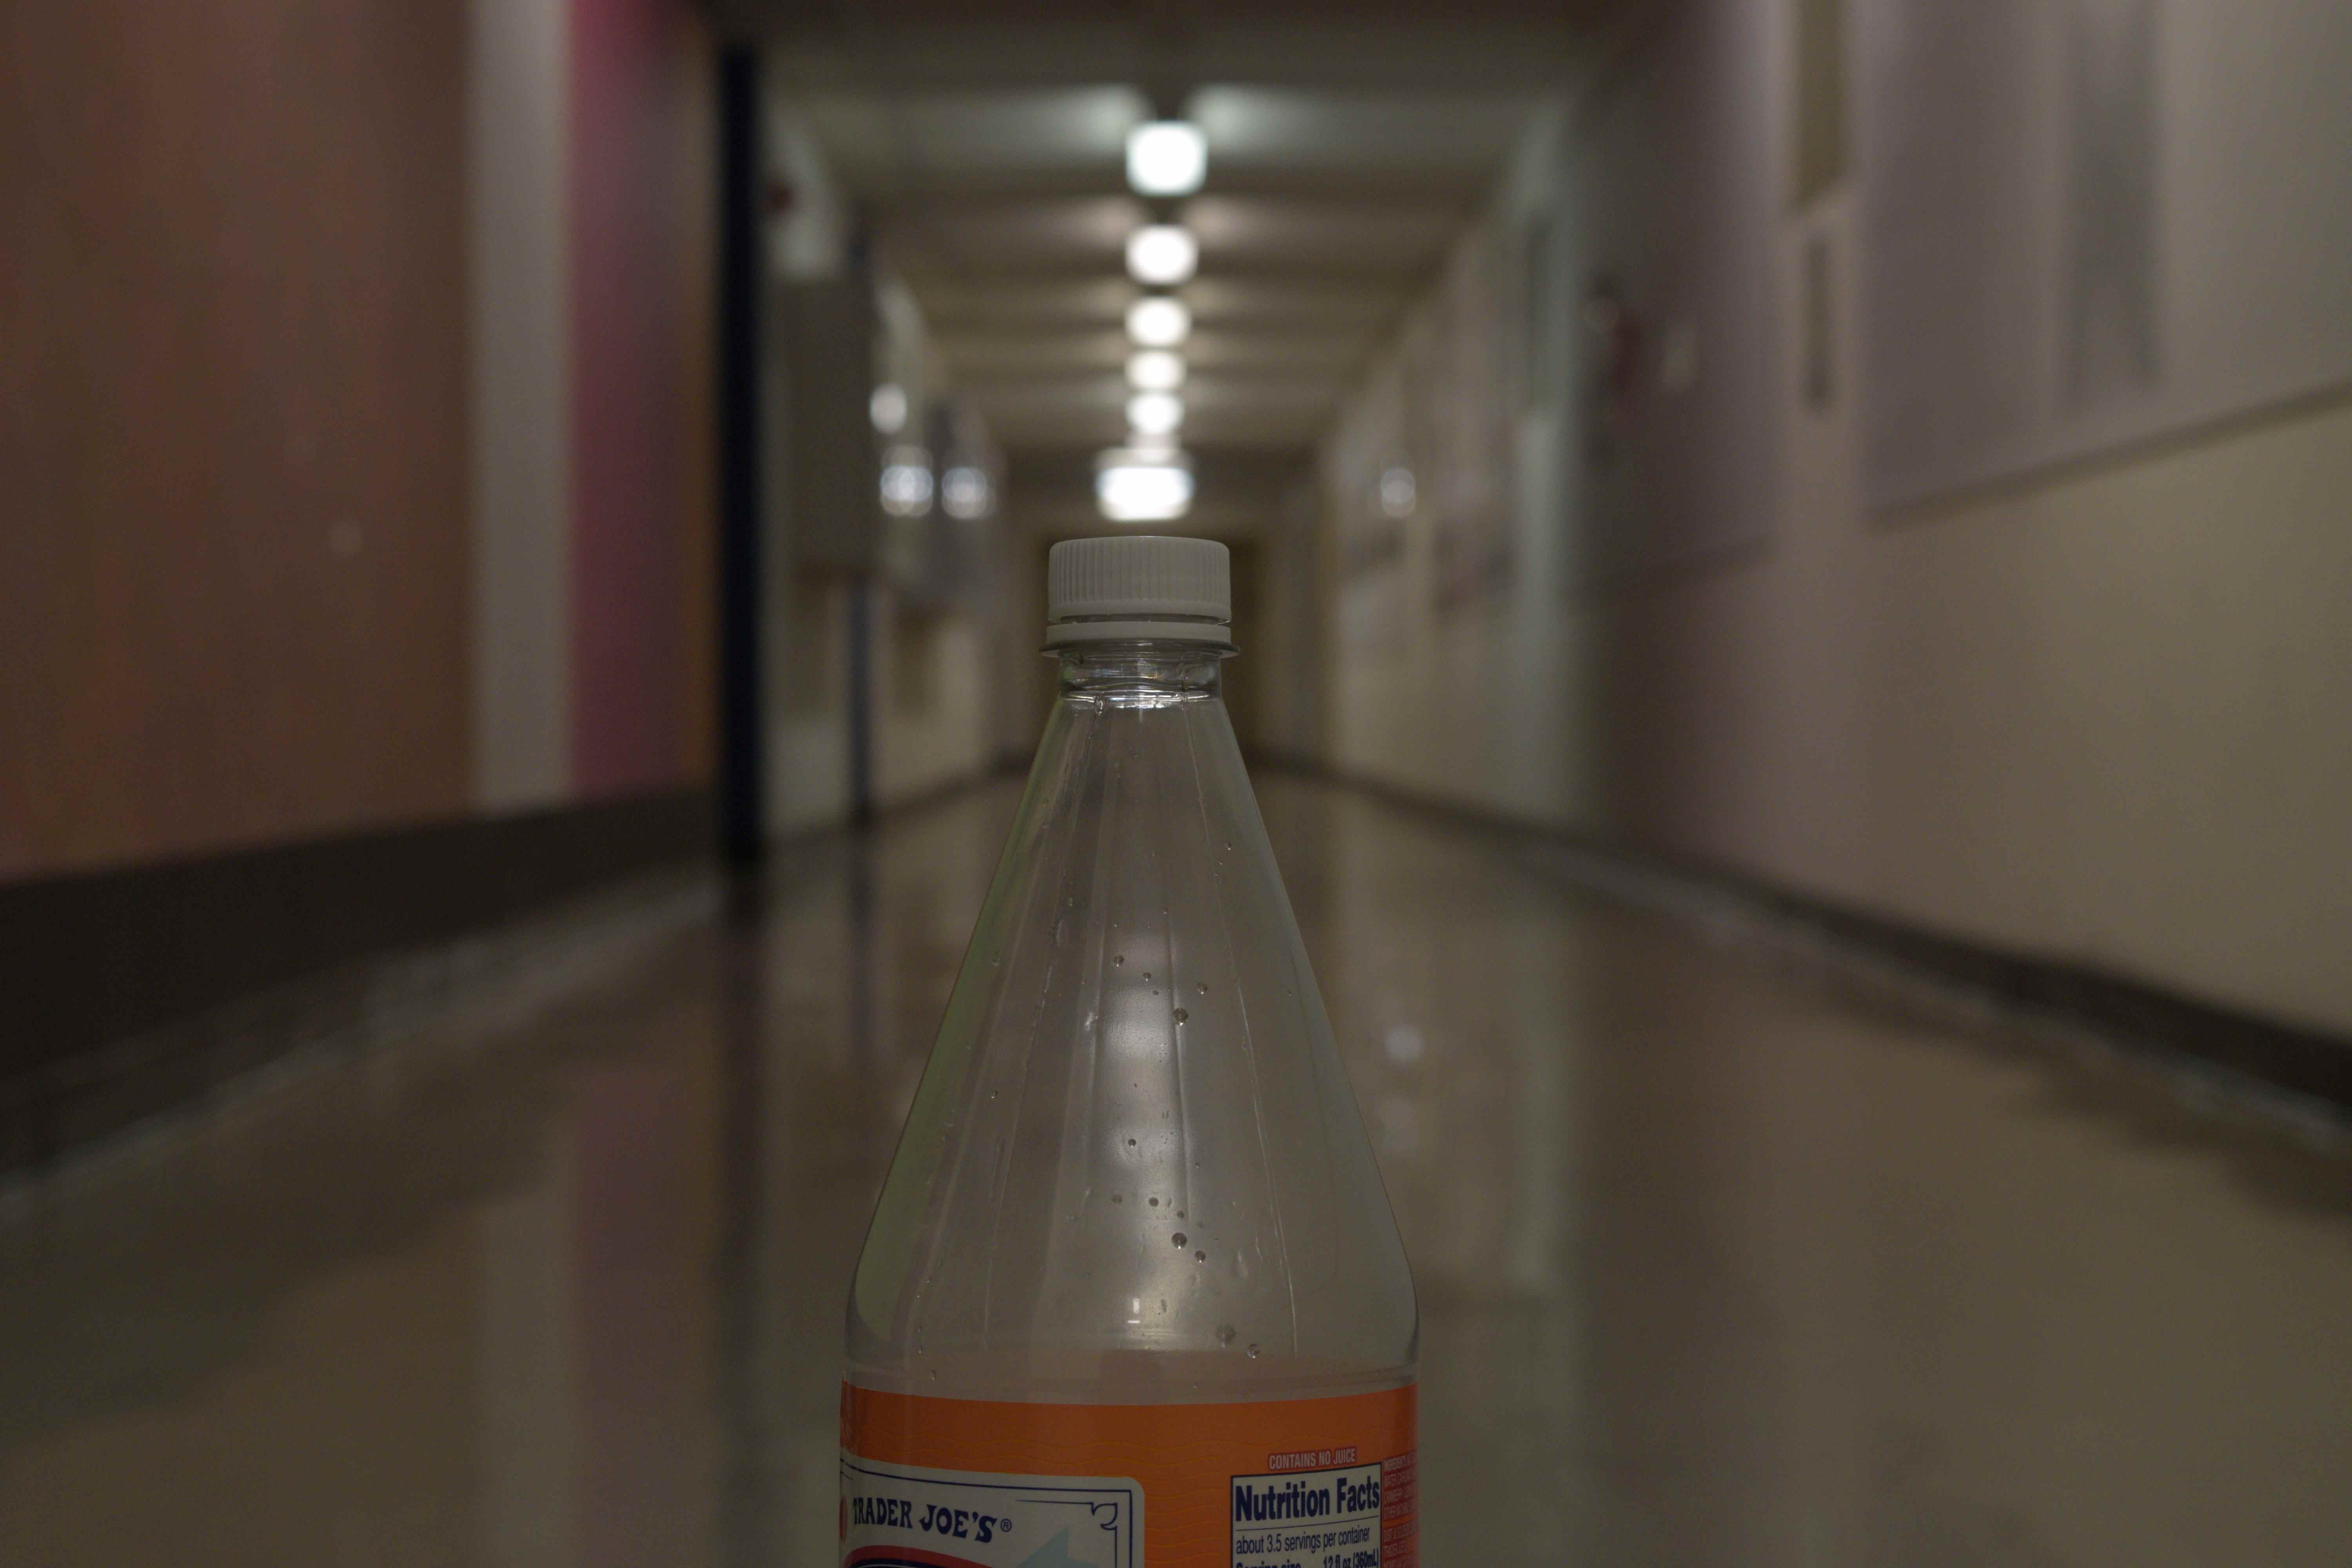
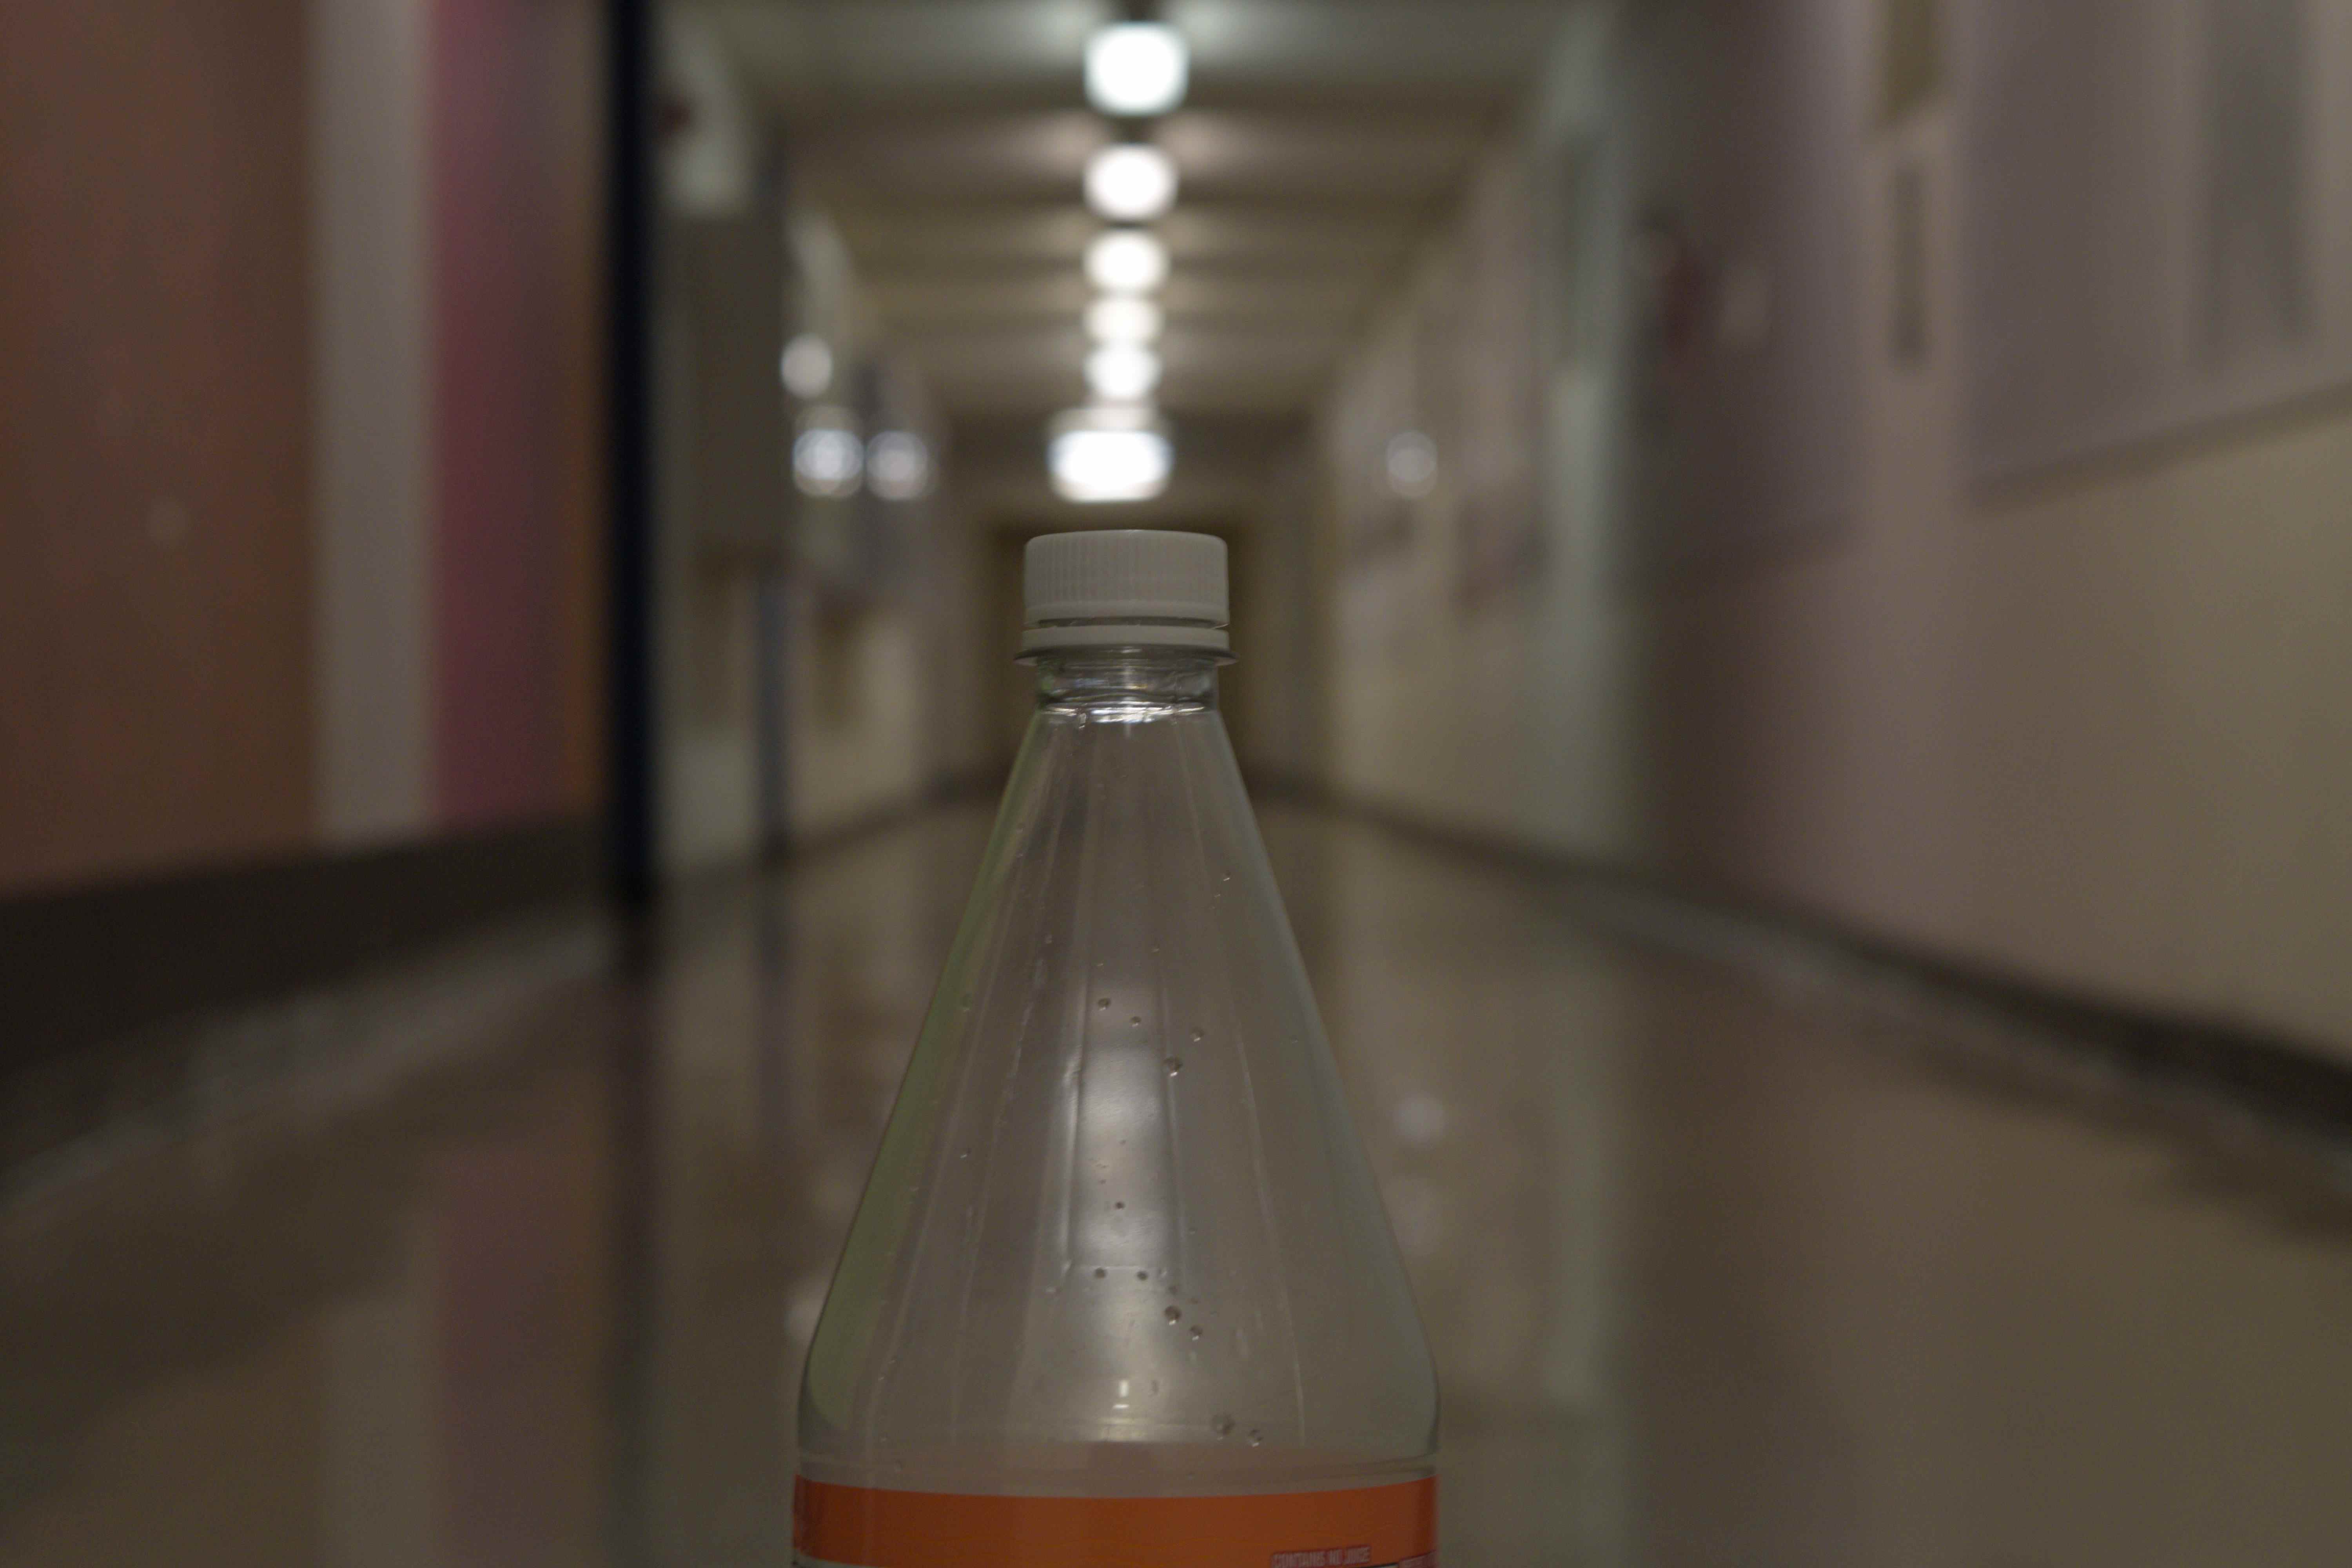
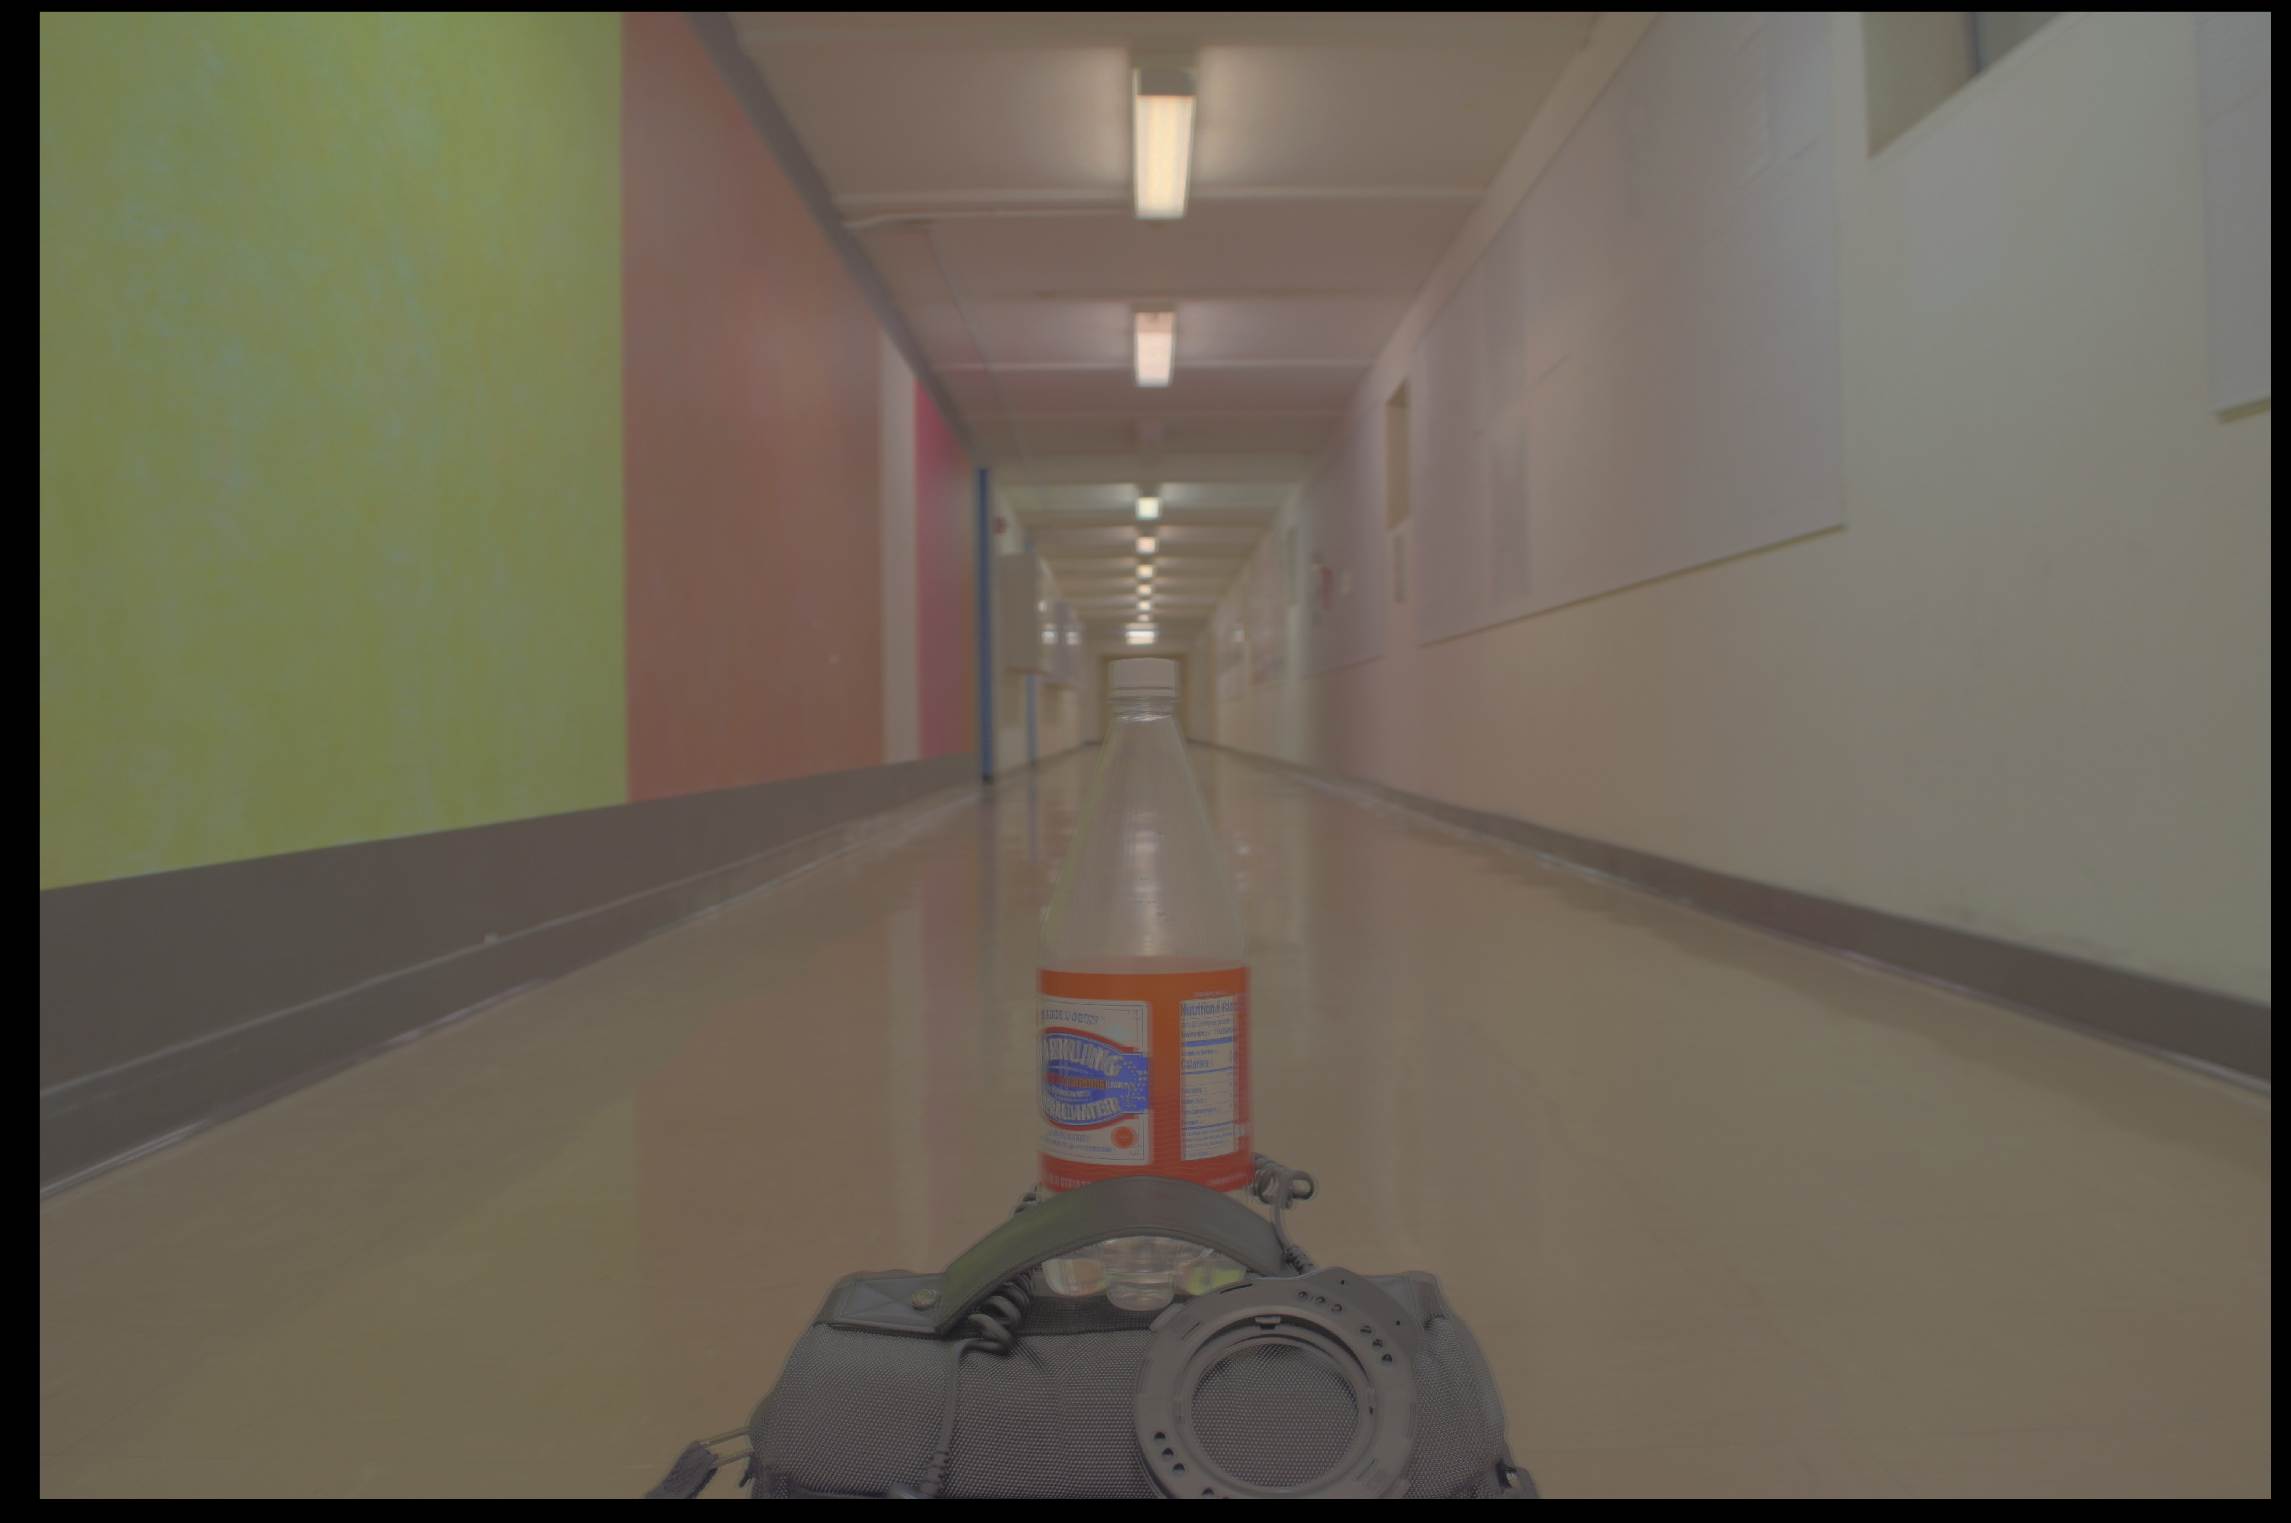
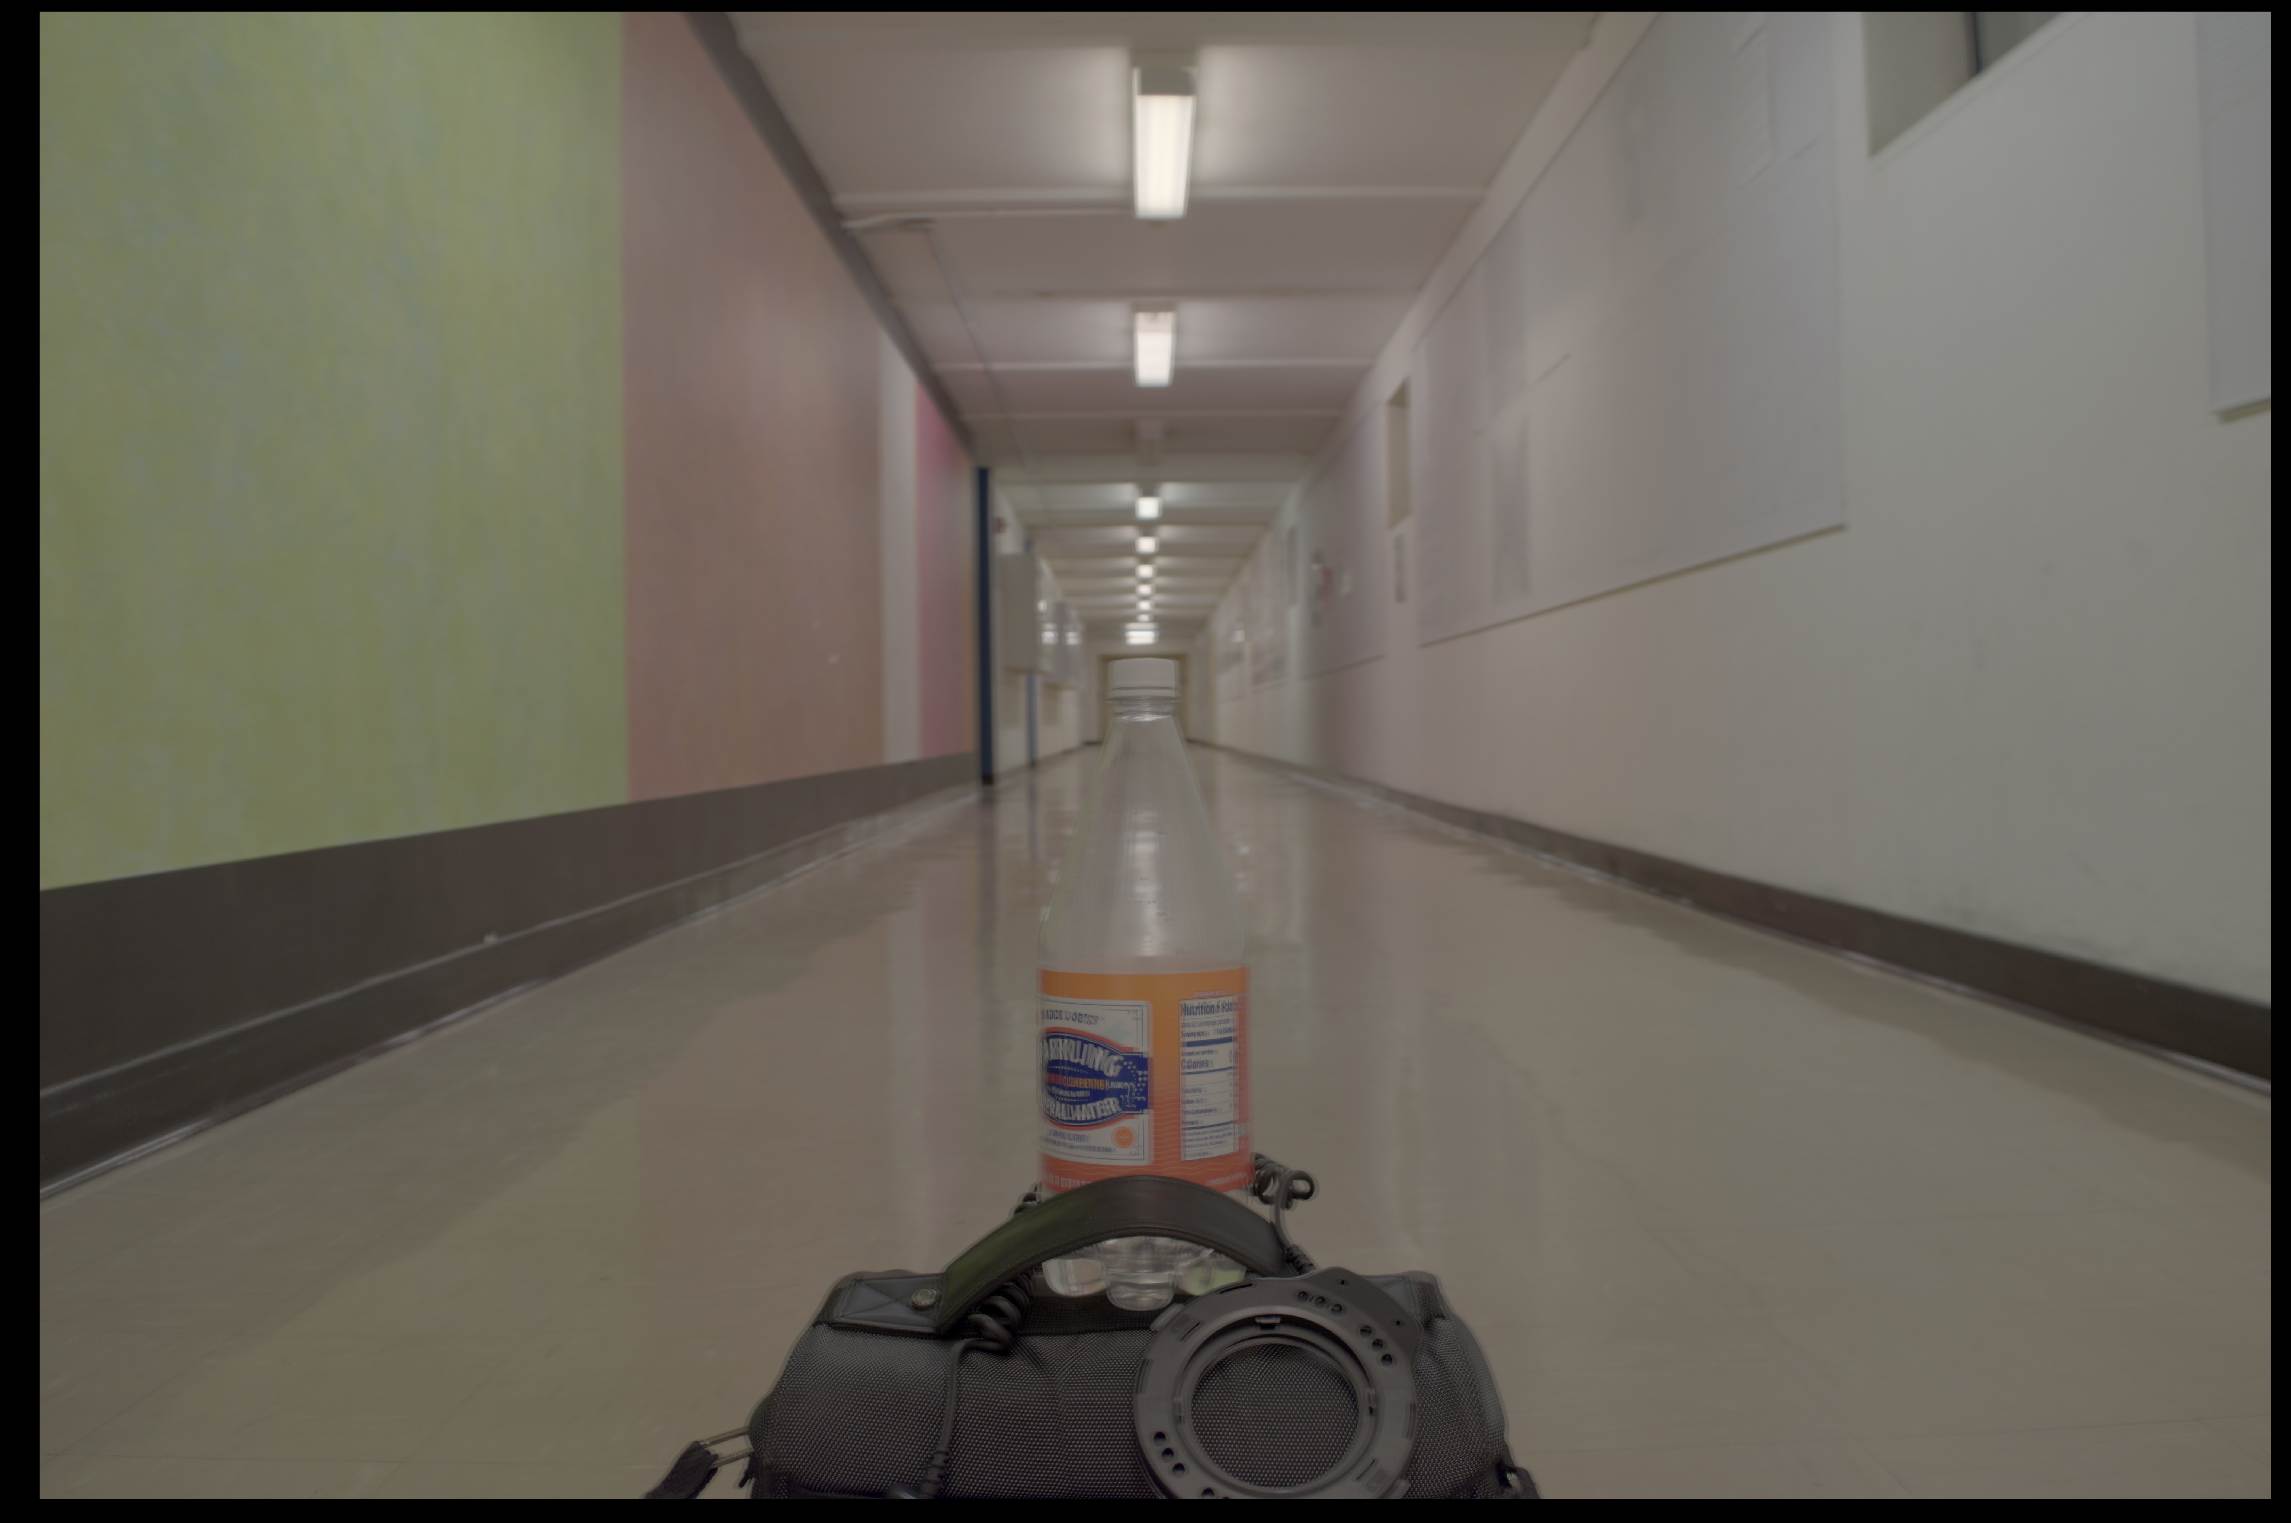
The main thing I needed to do was keep my subject in focus, the same size, and in the same place. To do this I placed my camera on a tripod and had a vertical line on the ground going through the center of the subject and the center of the camera. When I changed the focal length of the camera, I moved to camera along the line until the subject was in the same place and the same size as in the previous image.
Here are images of my set up.
By measuring the distance from the camera center to the subject, and measuring the constant subject’s width, the fov of the camera using a particular focal length can be calculated
We use the following equations to calculate the FOV and then use the FOV to calculate the focal length. We do this for the camera at minimum and maximum zoom of the example of the room in the results section.

With this equation we calculated the following:

I used a Nikon d3300 so the width of the horizontal camera sensor width is 23.5 mm.
With this equation we calculated the following:
Below are the results from two locations

Bells and whistles: Used my own images. Used more than one tone-mapping technique.
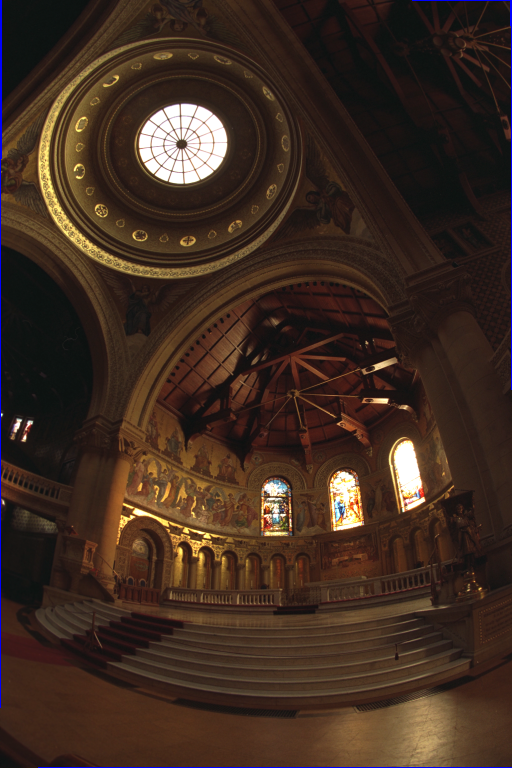
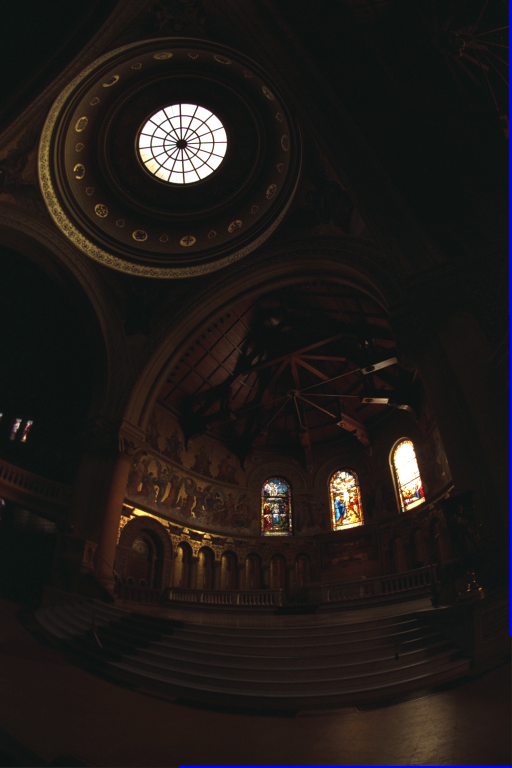
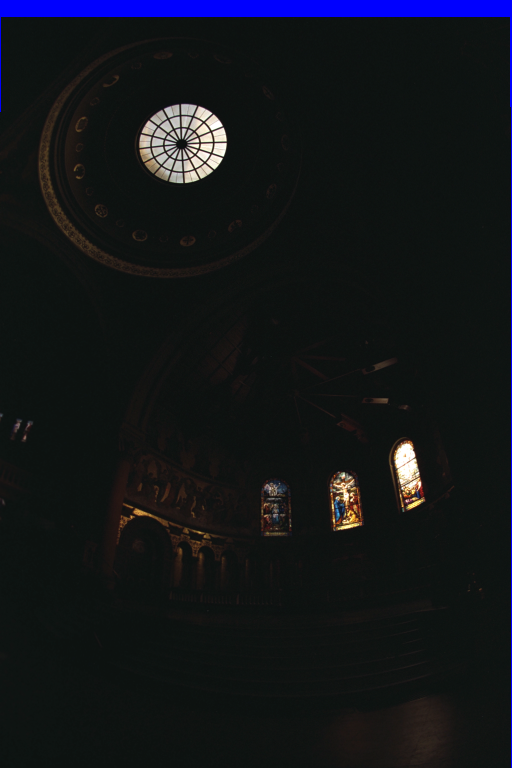
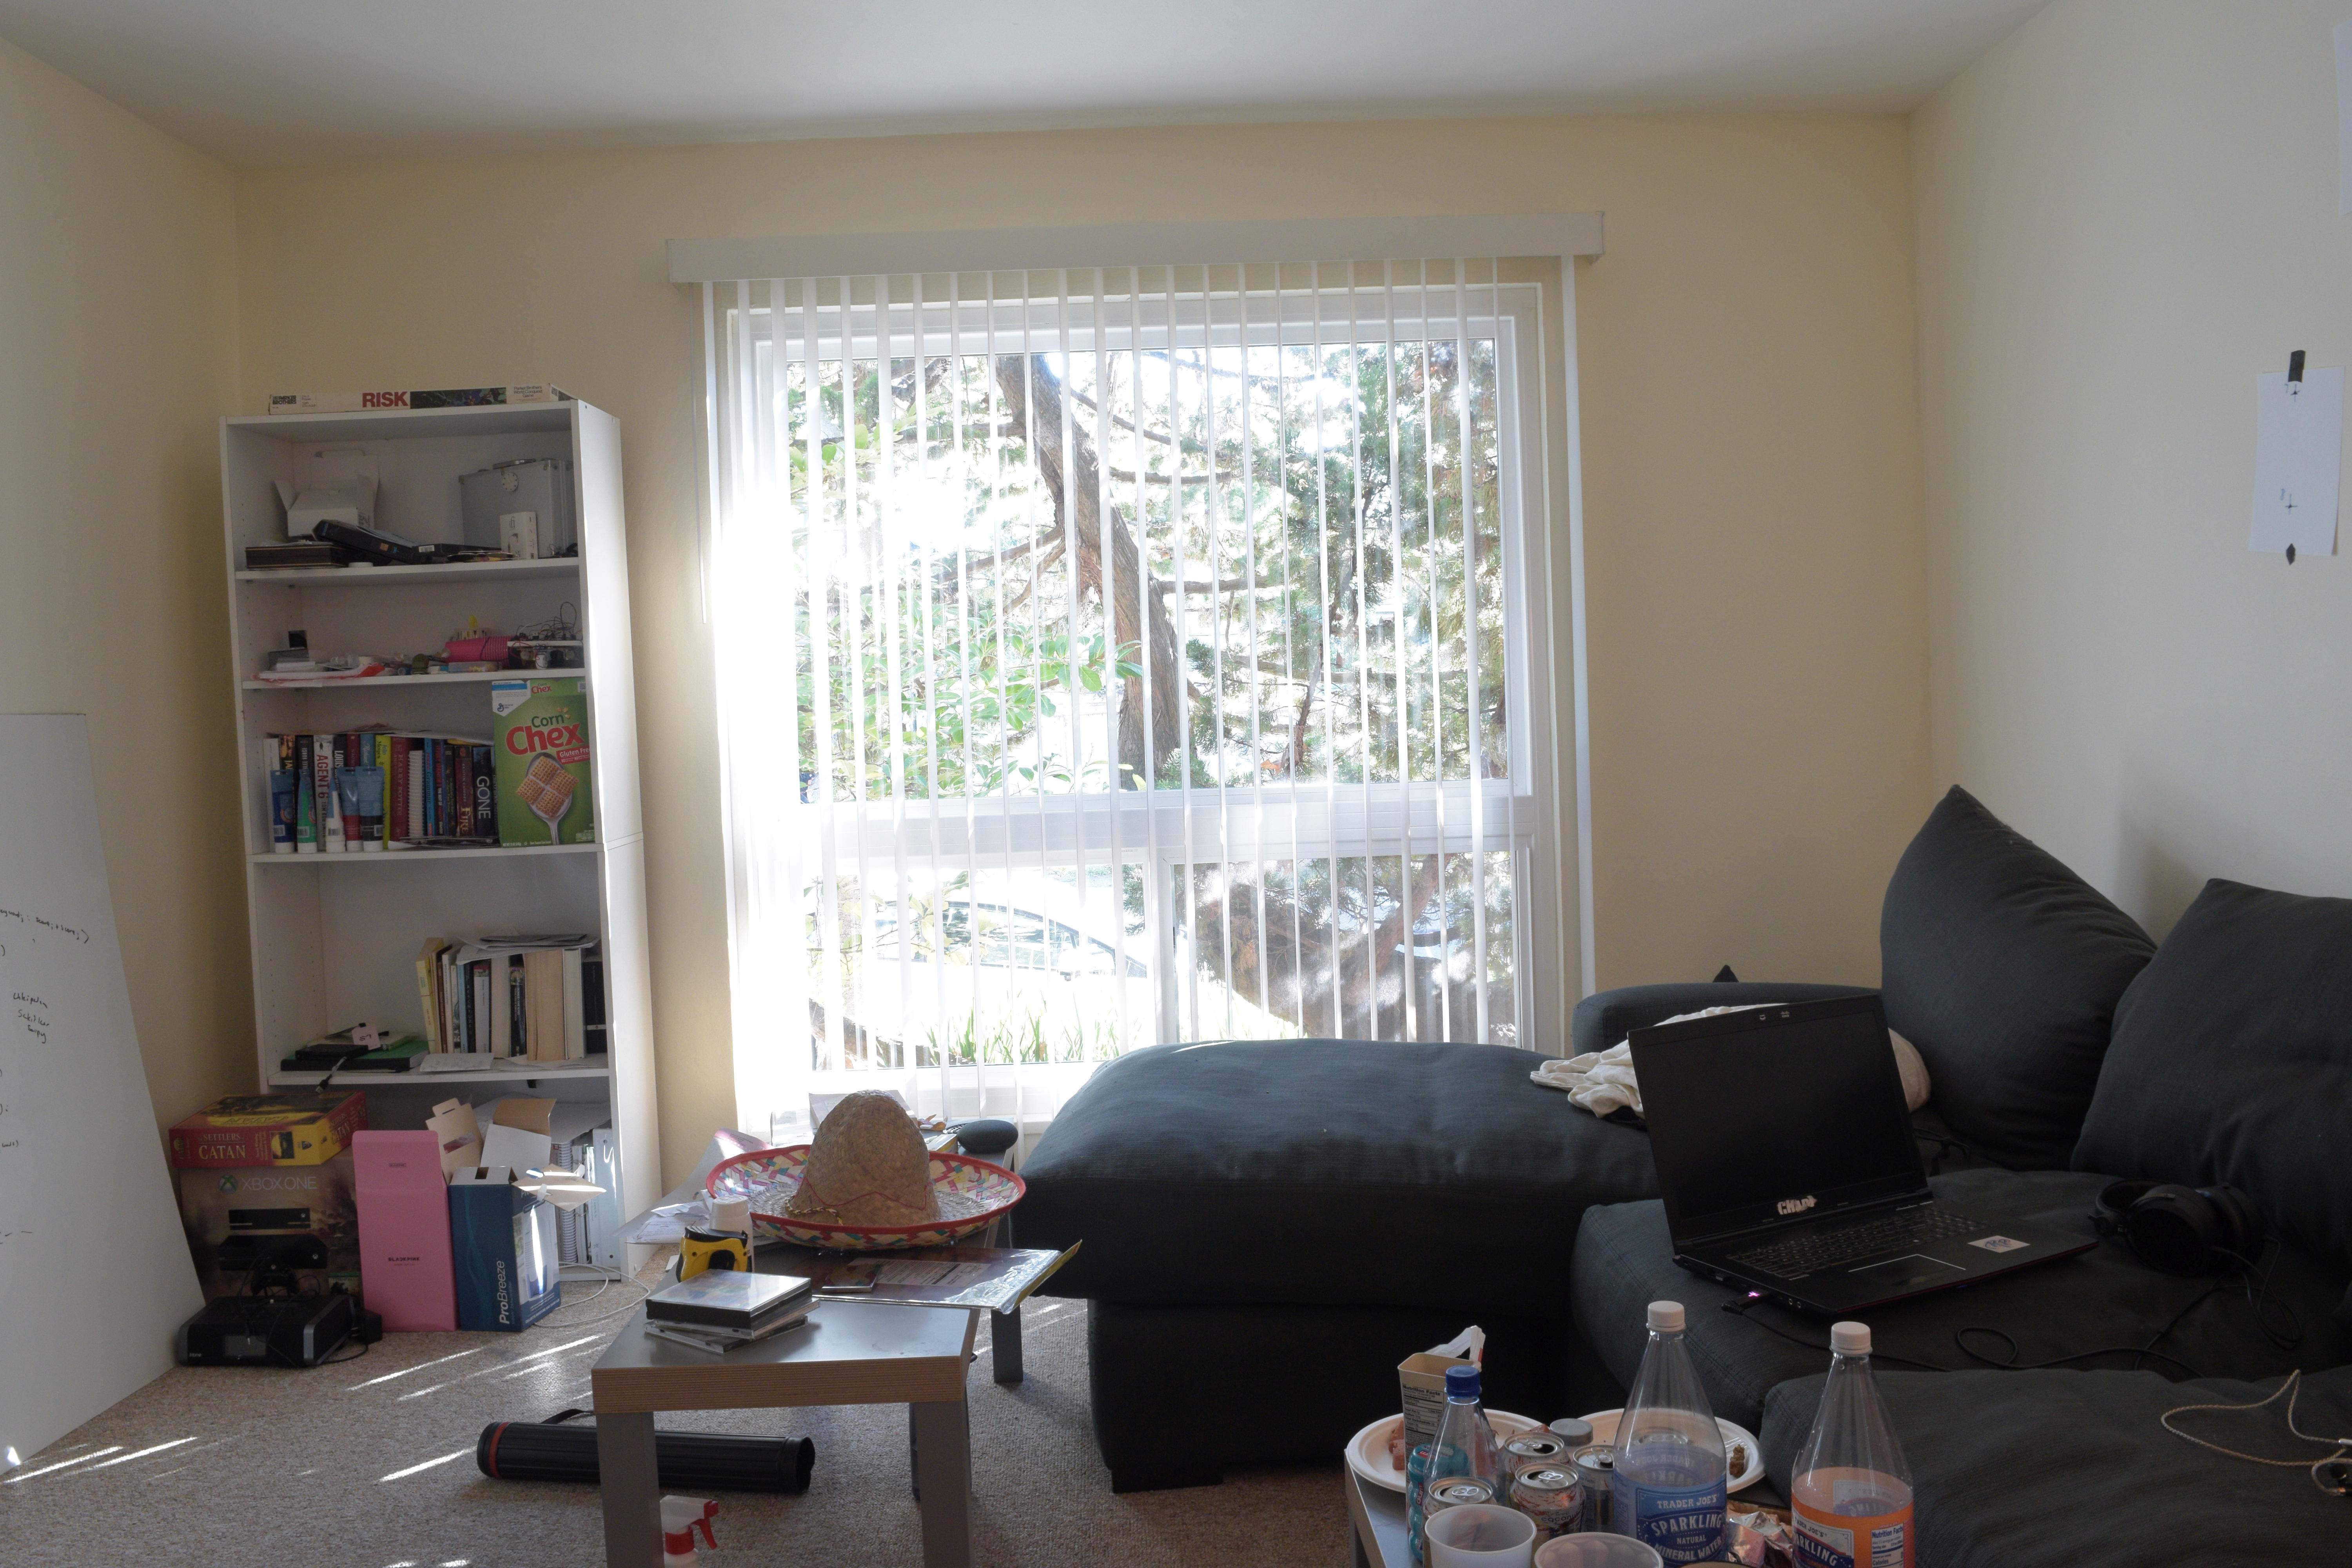
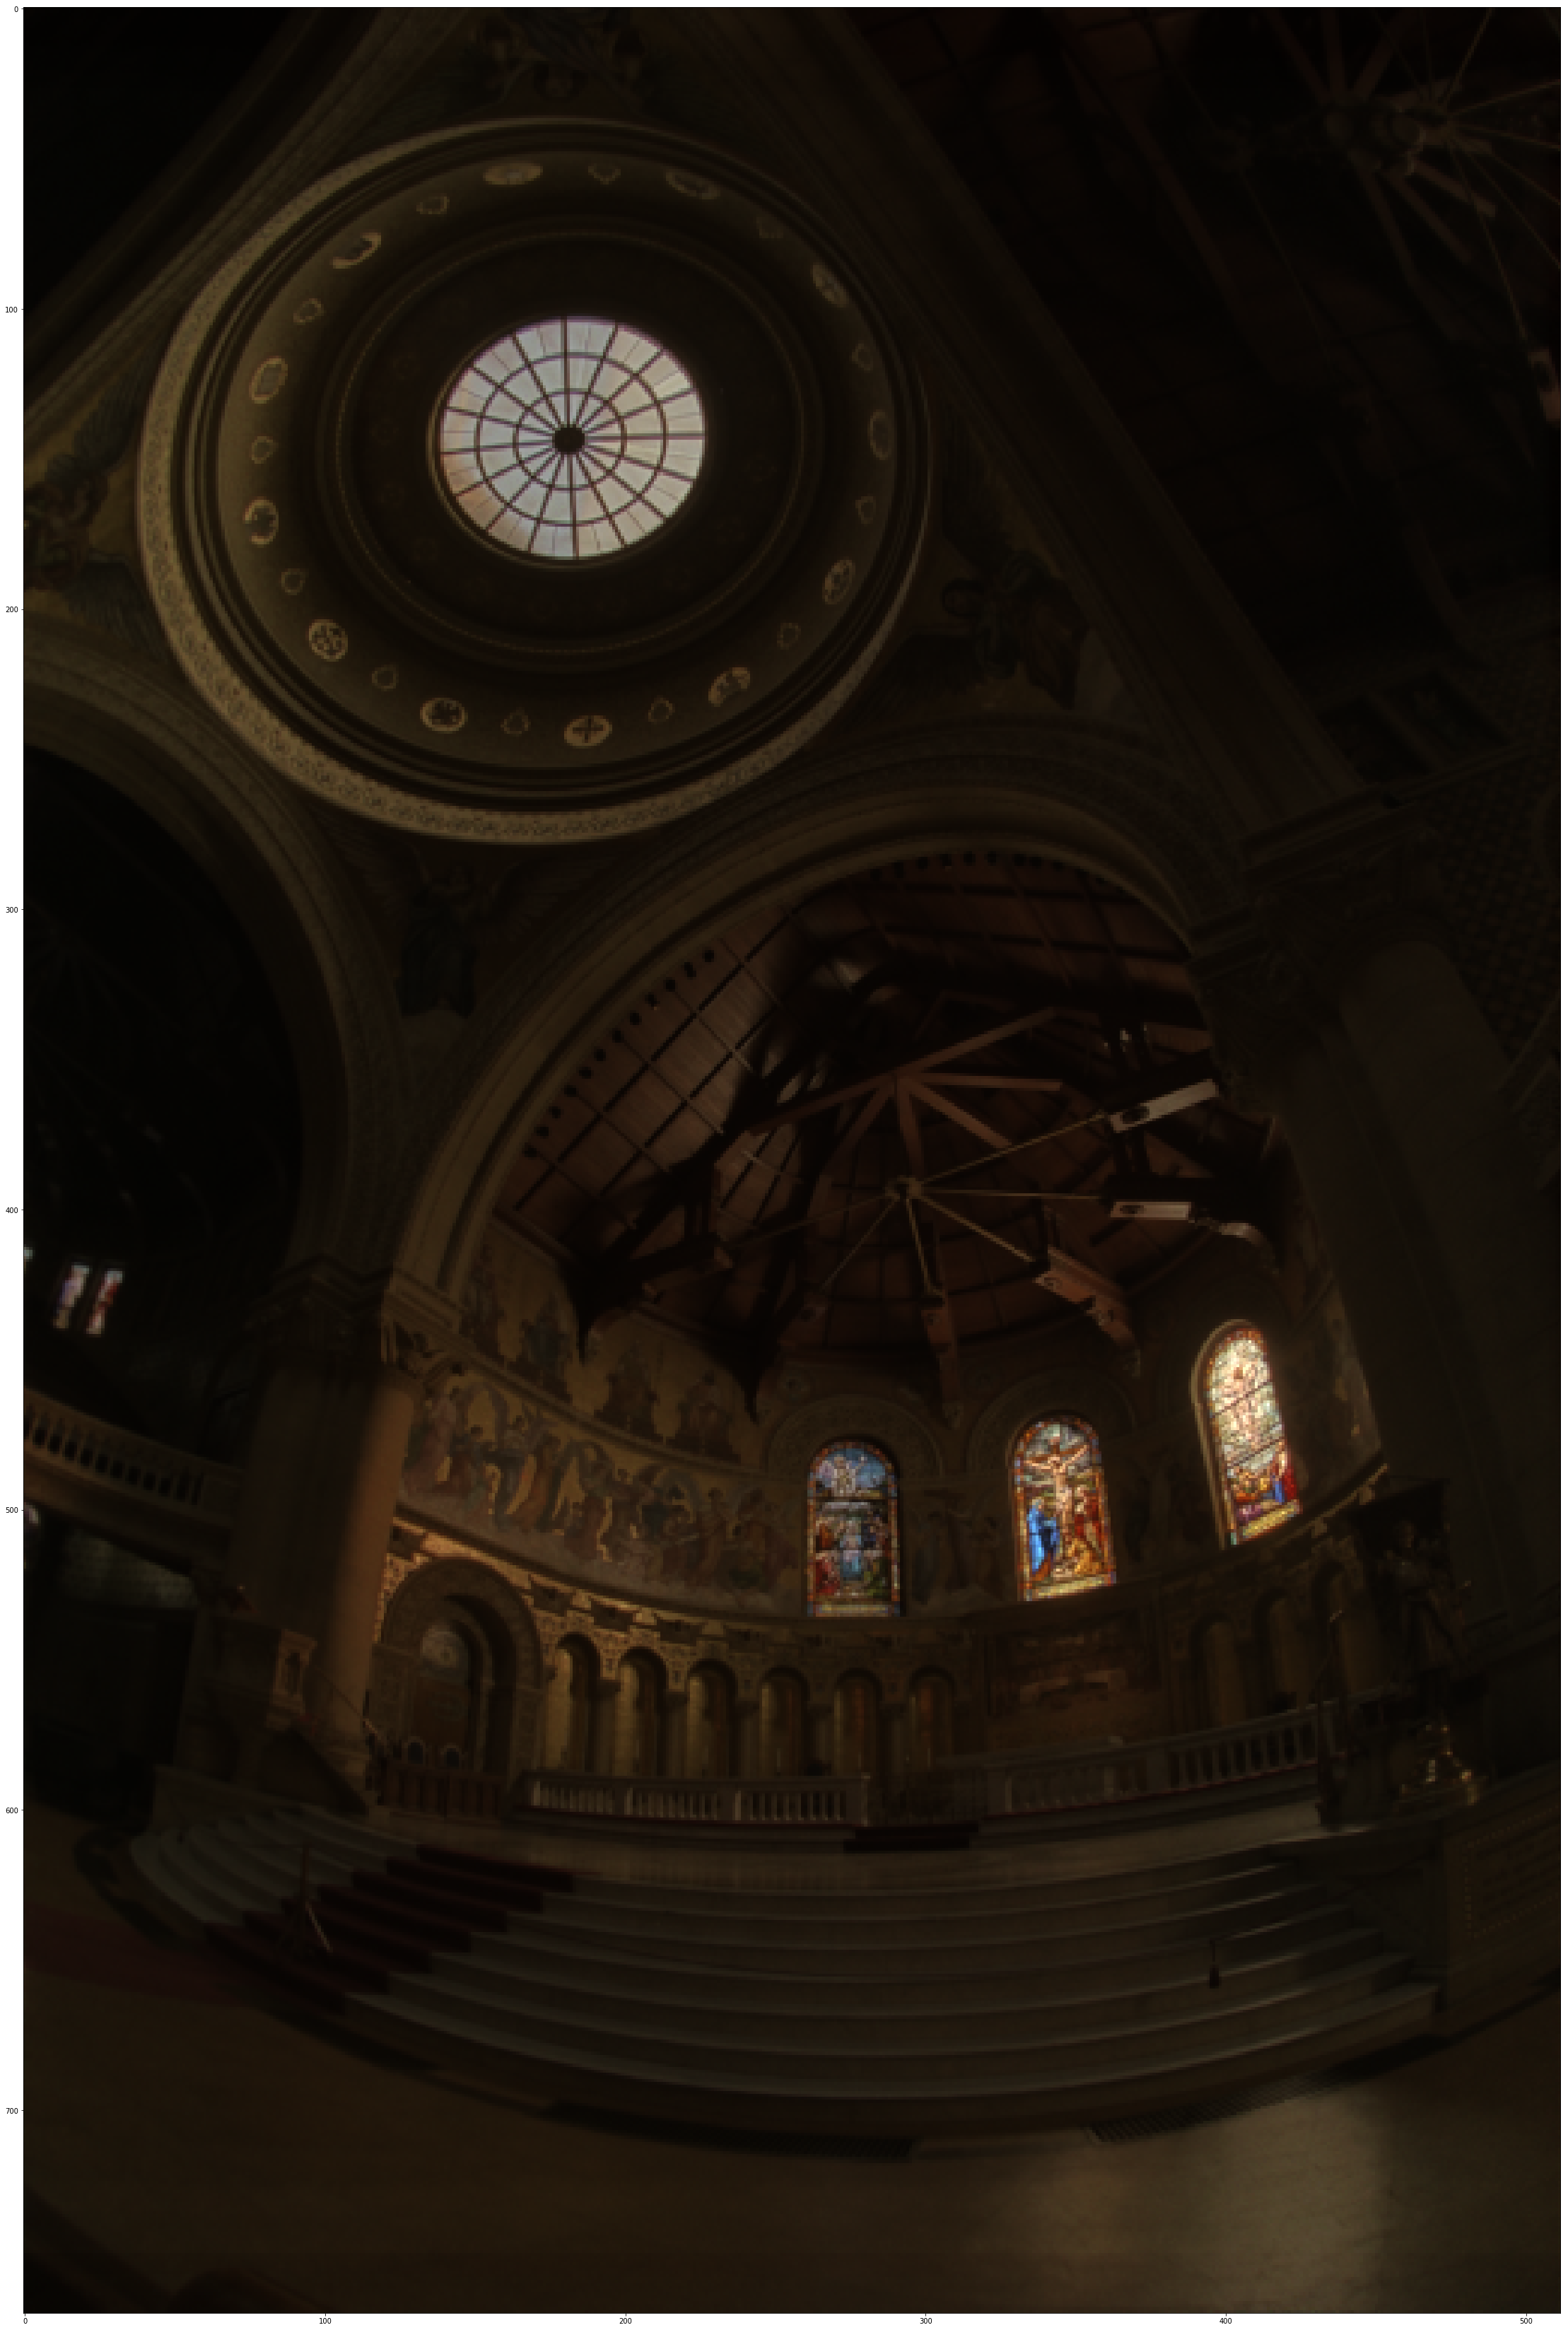
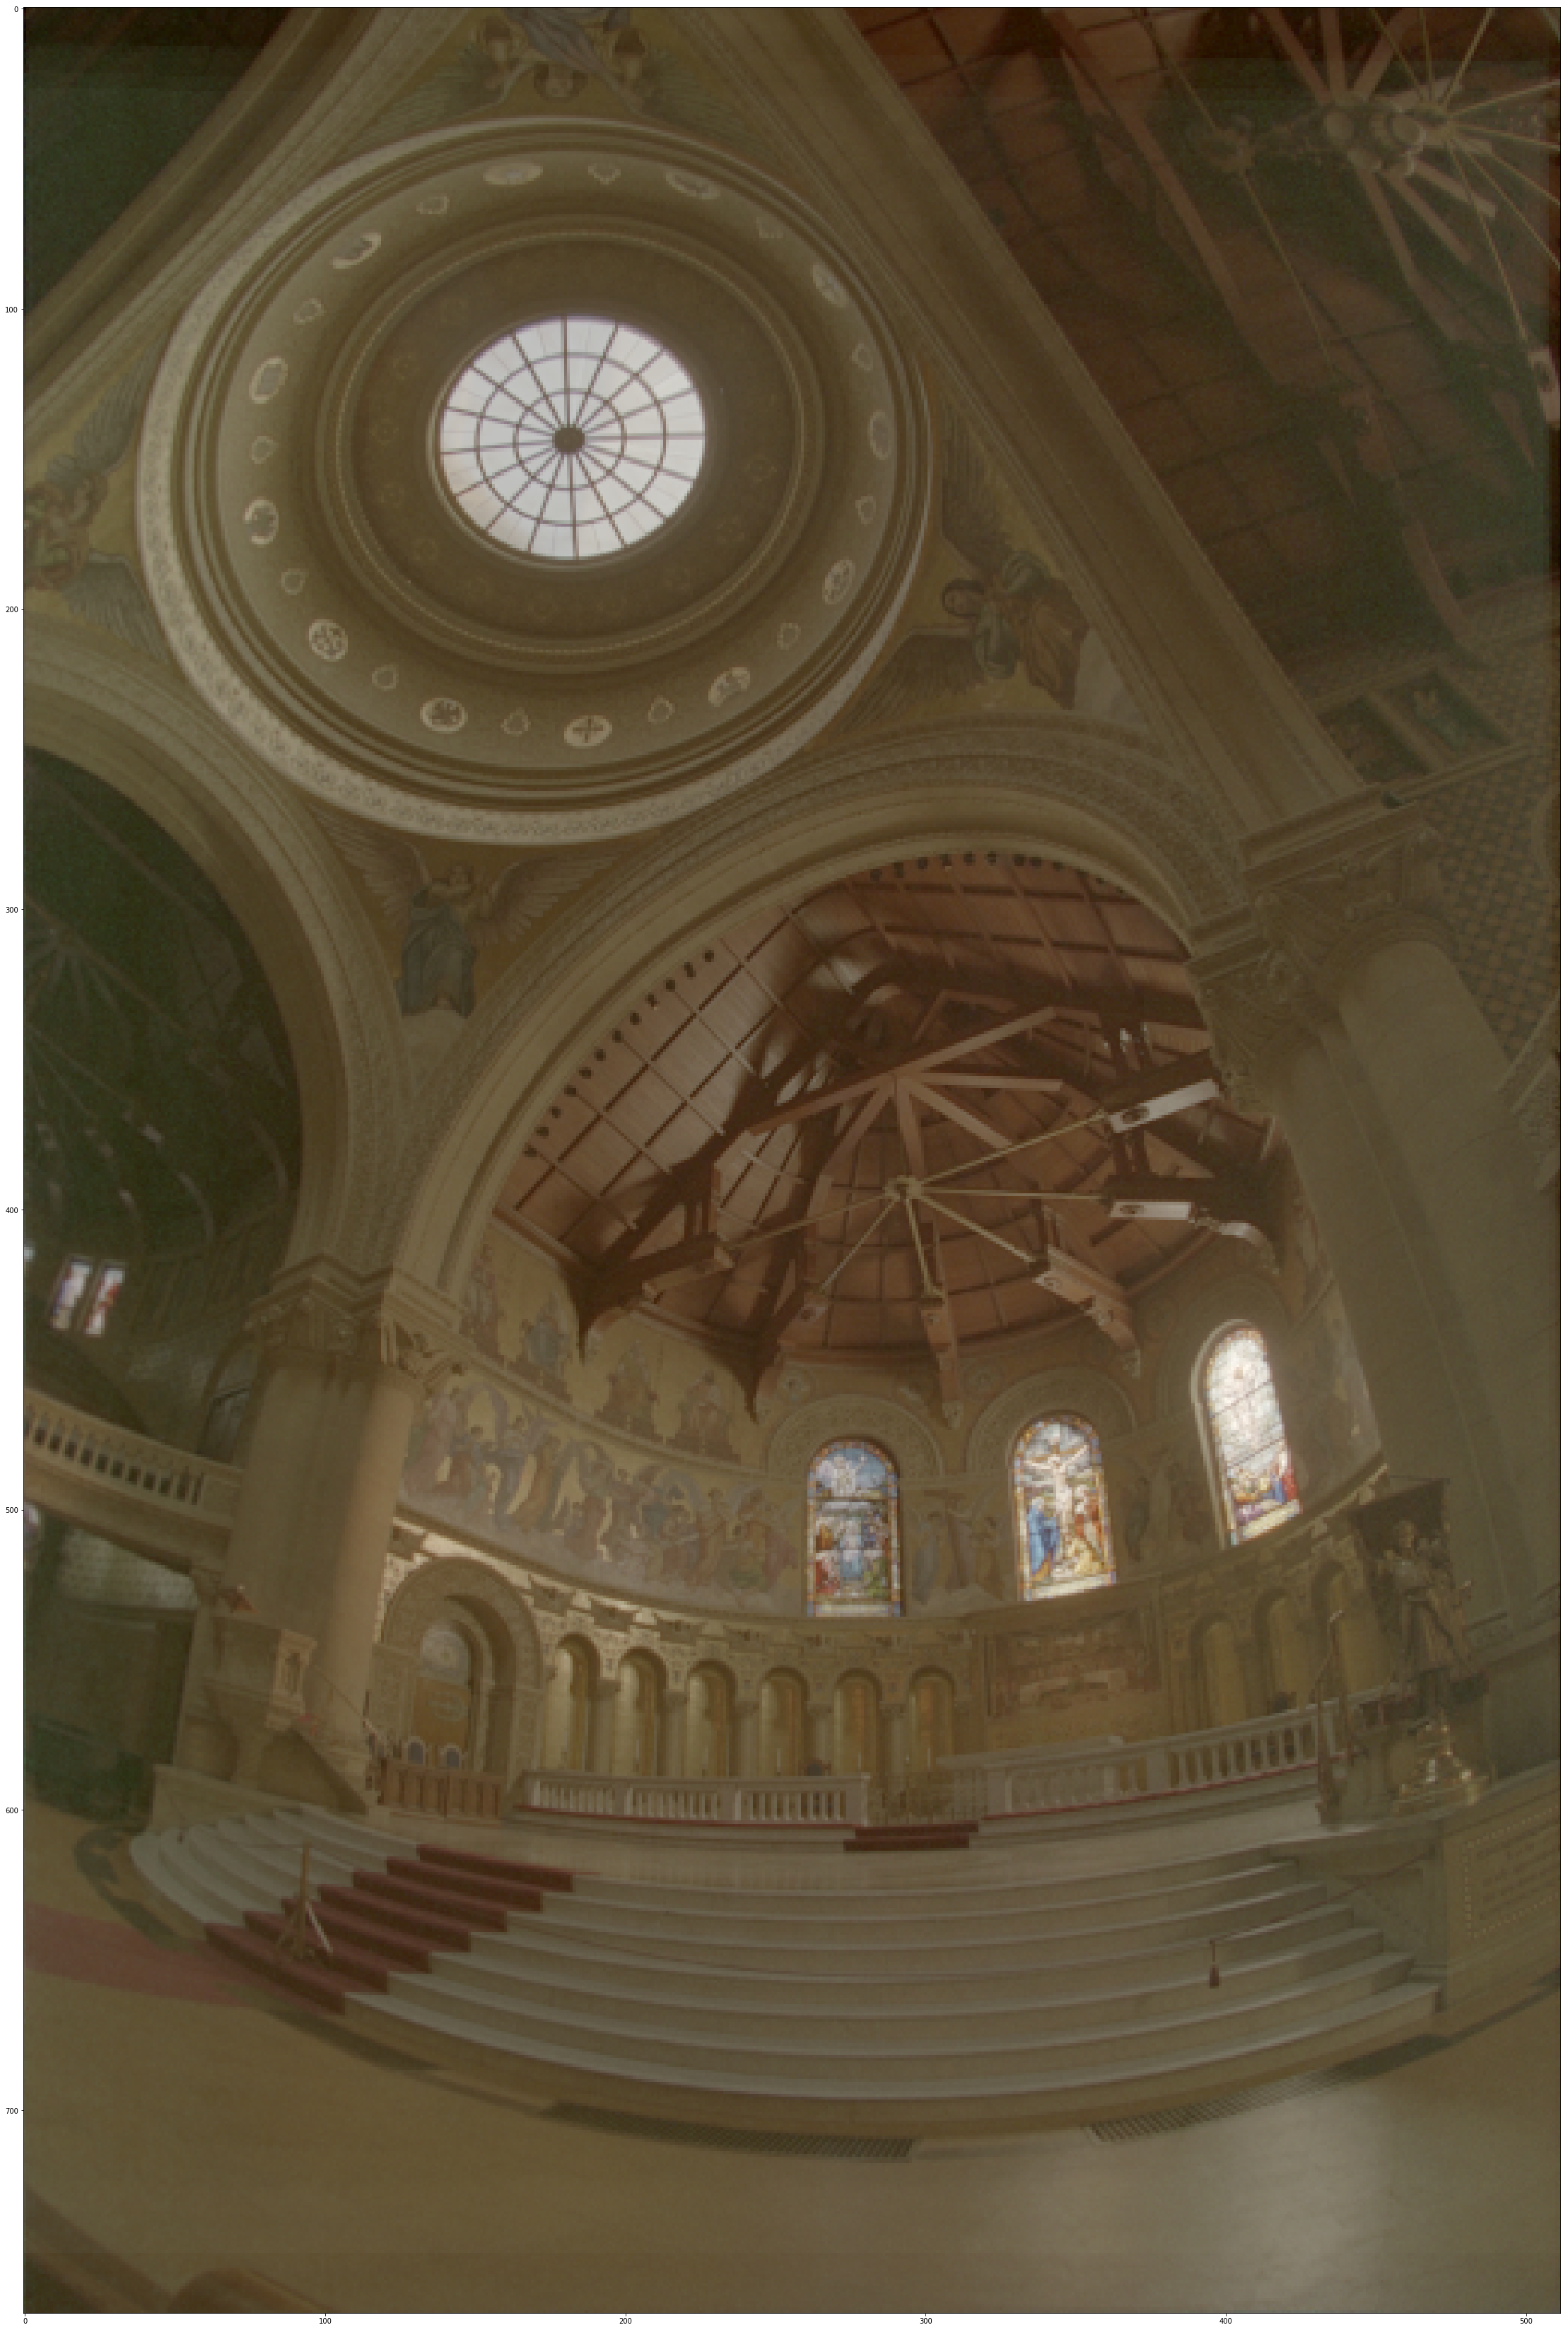
This project involved taking a series of images with different exposures to create a high dynamic range image based off of the paper by Paul Debevec.Debevec and Malik 1997.
What we have is a series of multiple images with different exposure times. This means that our pixel values are a function of exposure time and scene radiance.
Zij = f ( Ei * Δtj )
This means that to find radiance at a particular point we have f-1 ( Zij ) = Ei * Δtj. Letting g = ln( f-1 ) we get a function that maps from pixel values to log exposure values:
g(Zij) = ln(Ei) + ln(tj)
Here are the response curves for the test image sets and some sample points(we find a curve for each channel):
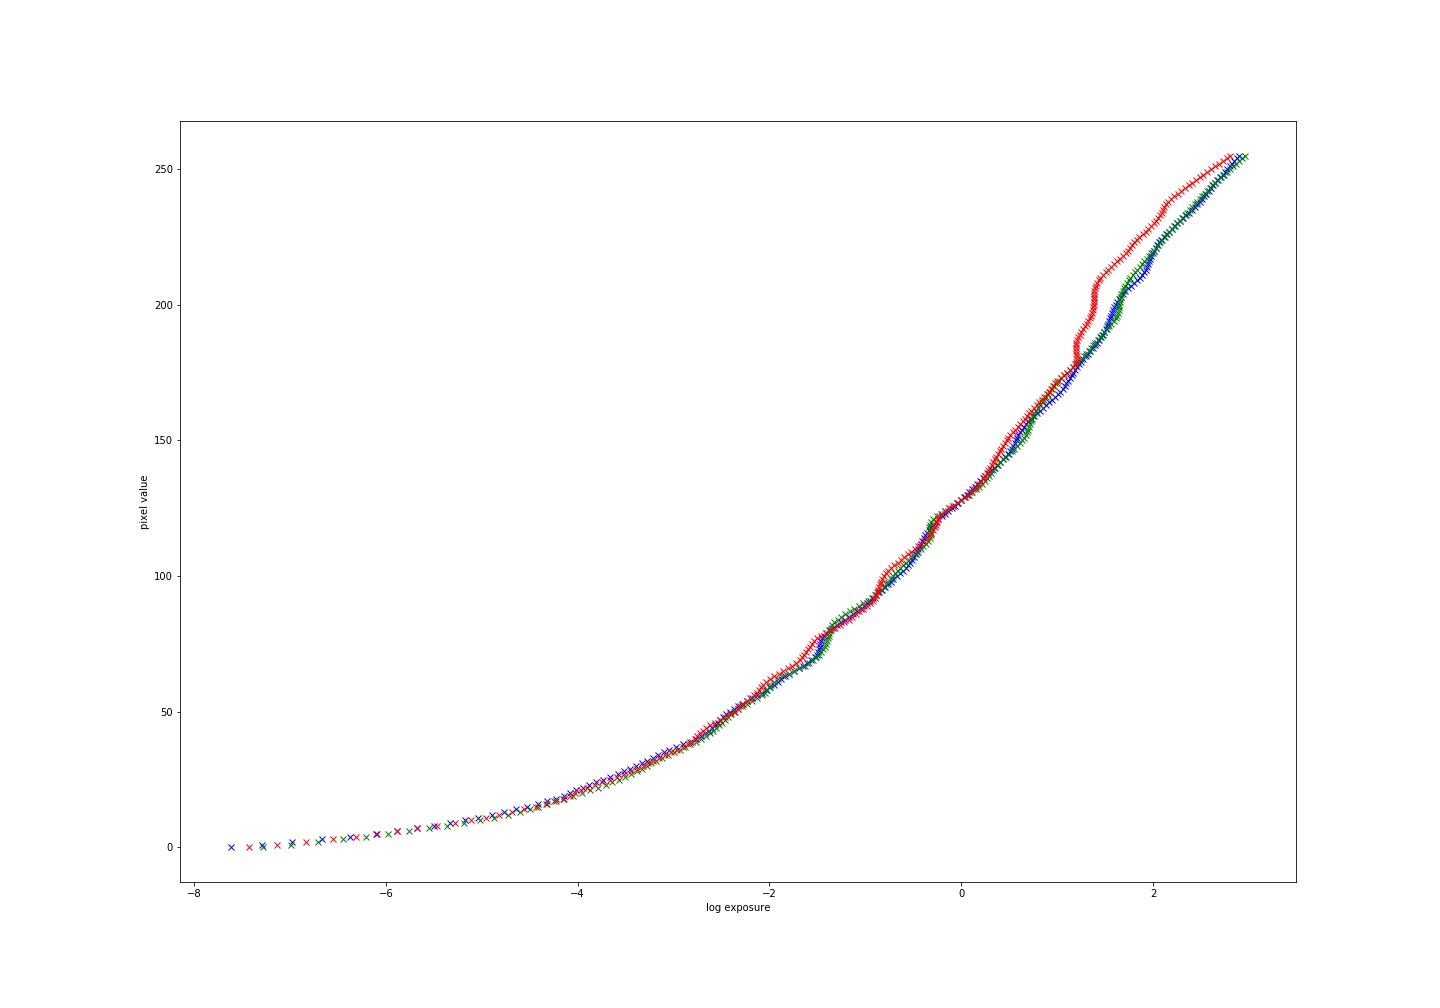
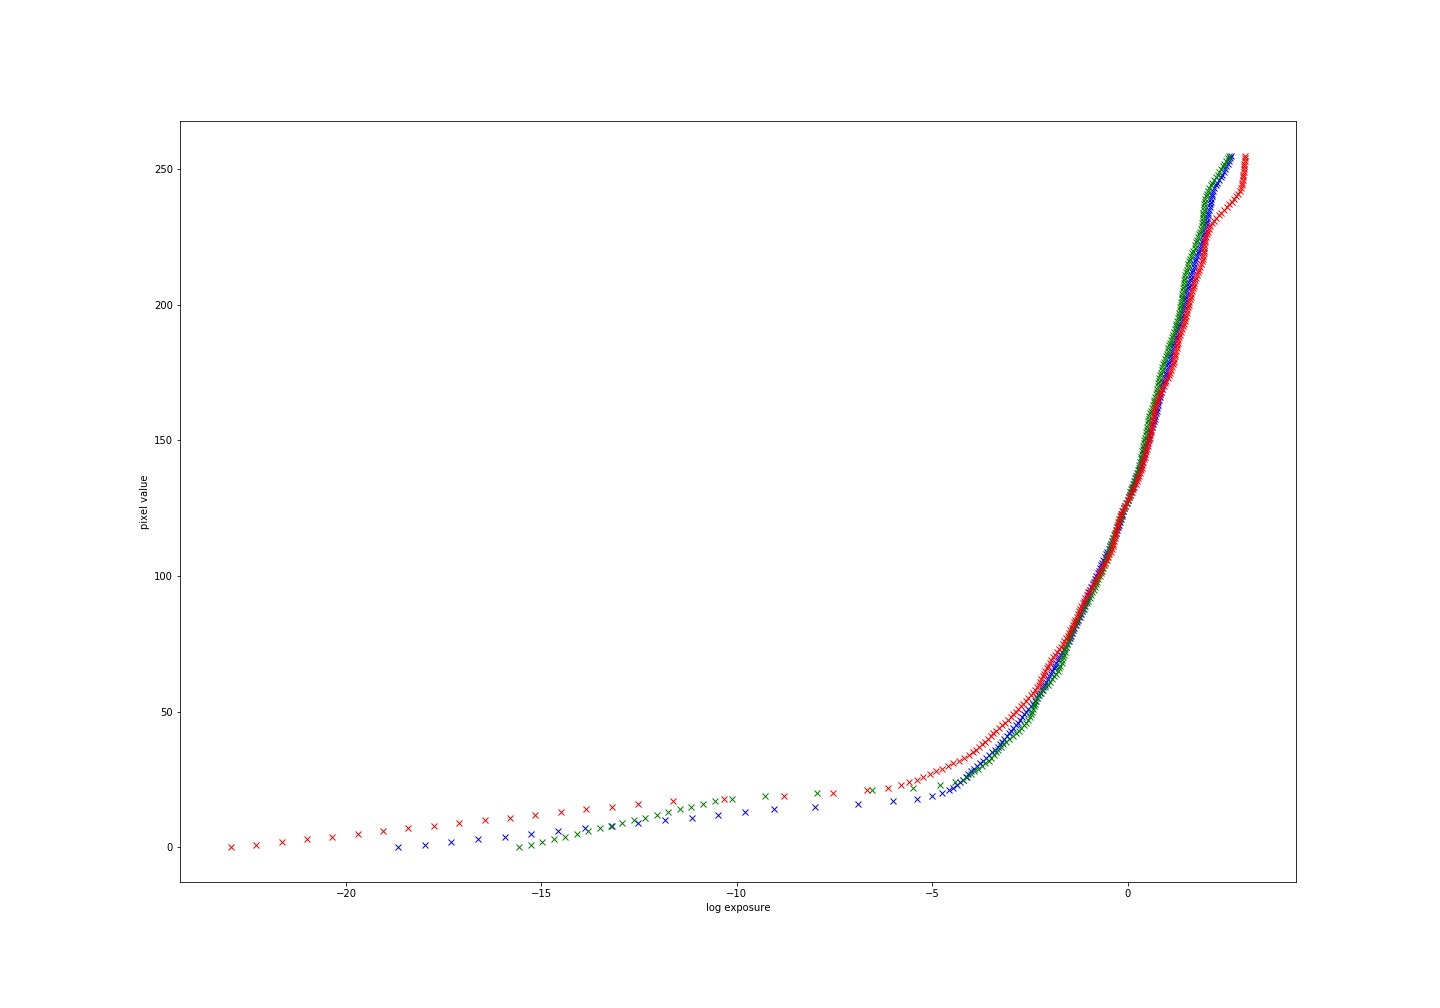
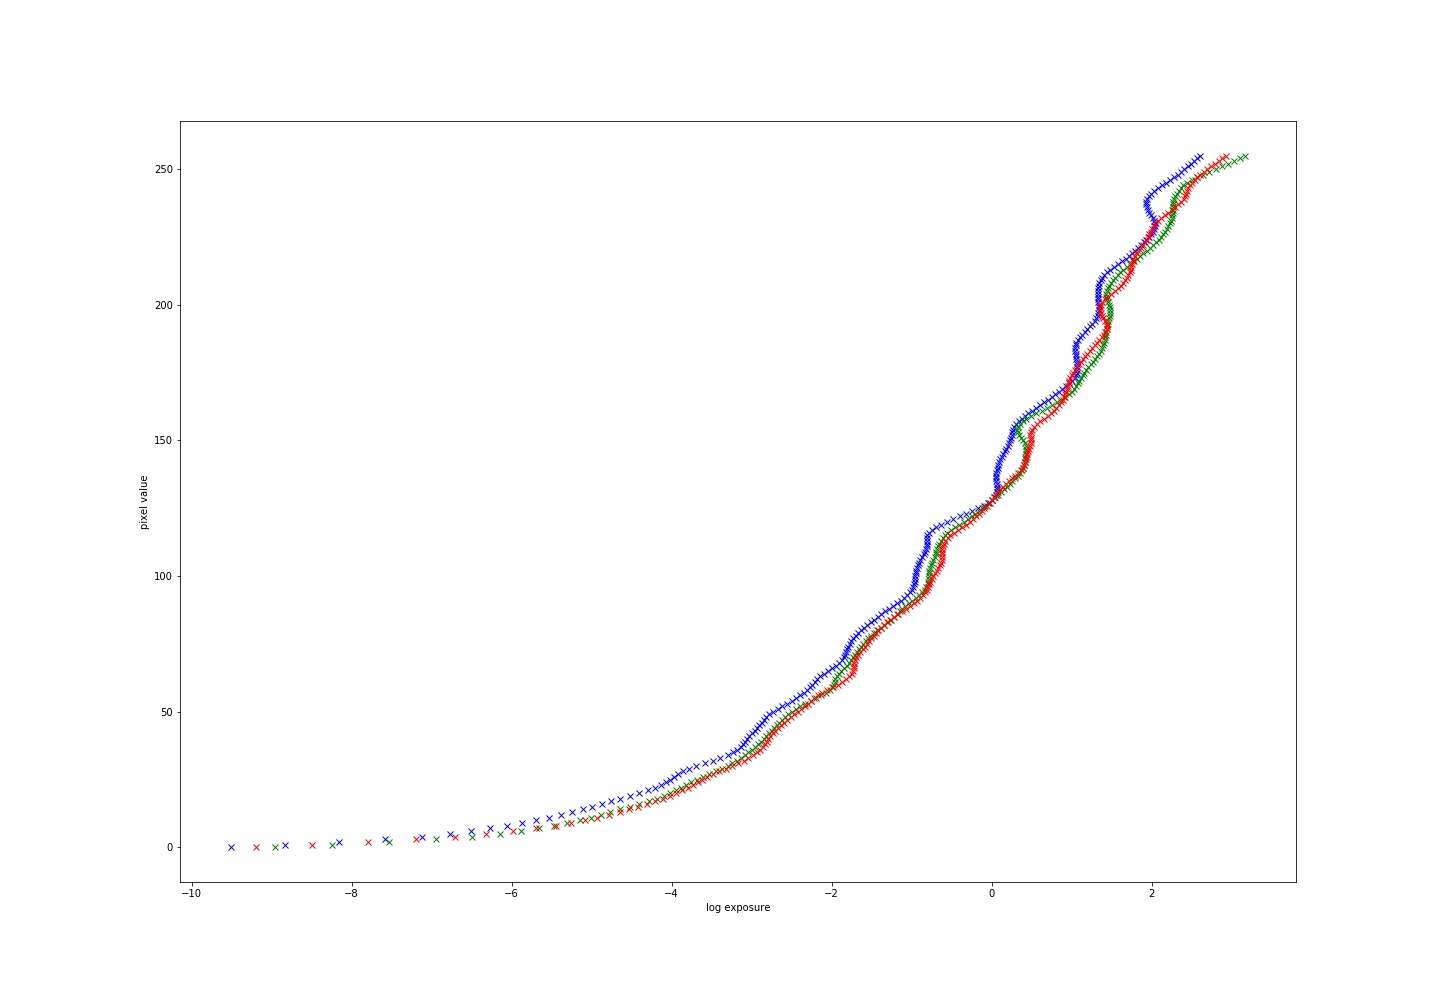
Now what we want to do is use these response curves to fill out an image with values for radiance by mapping from pixel values to radiance. We do this using the following equation:
ln(Ei) = g(Zij)-ln( Δtj)
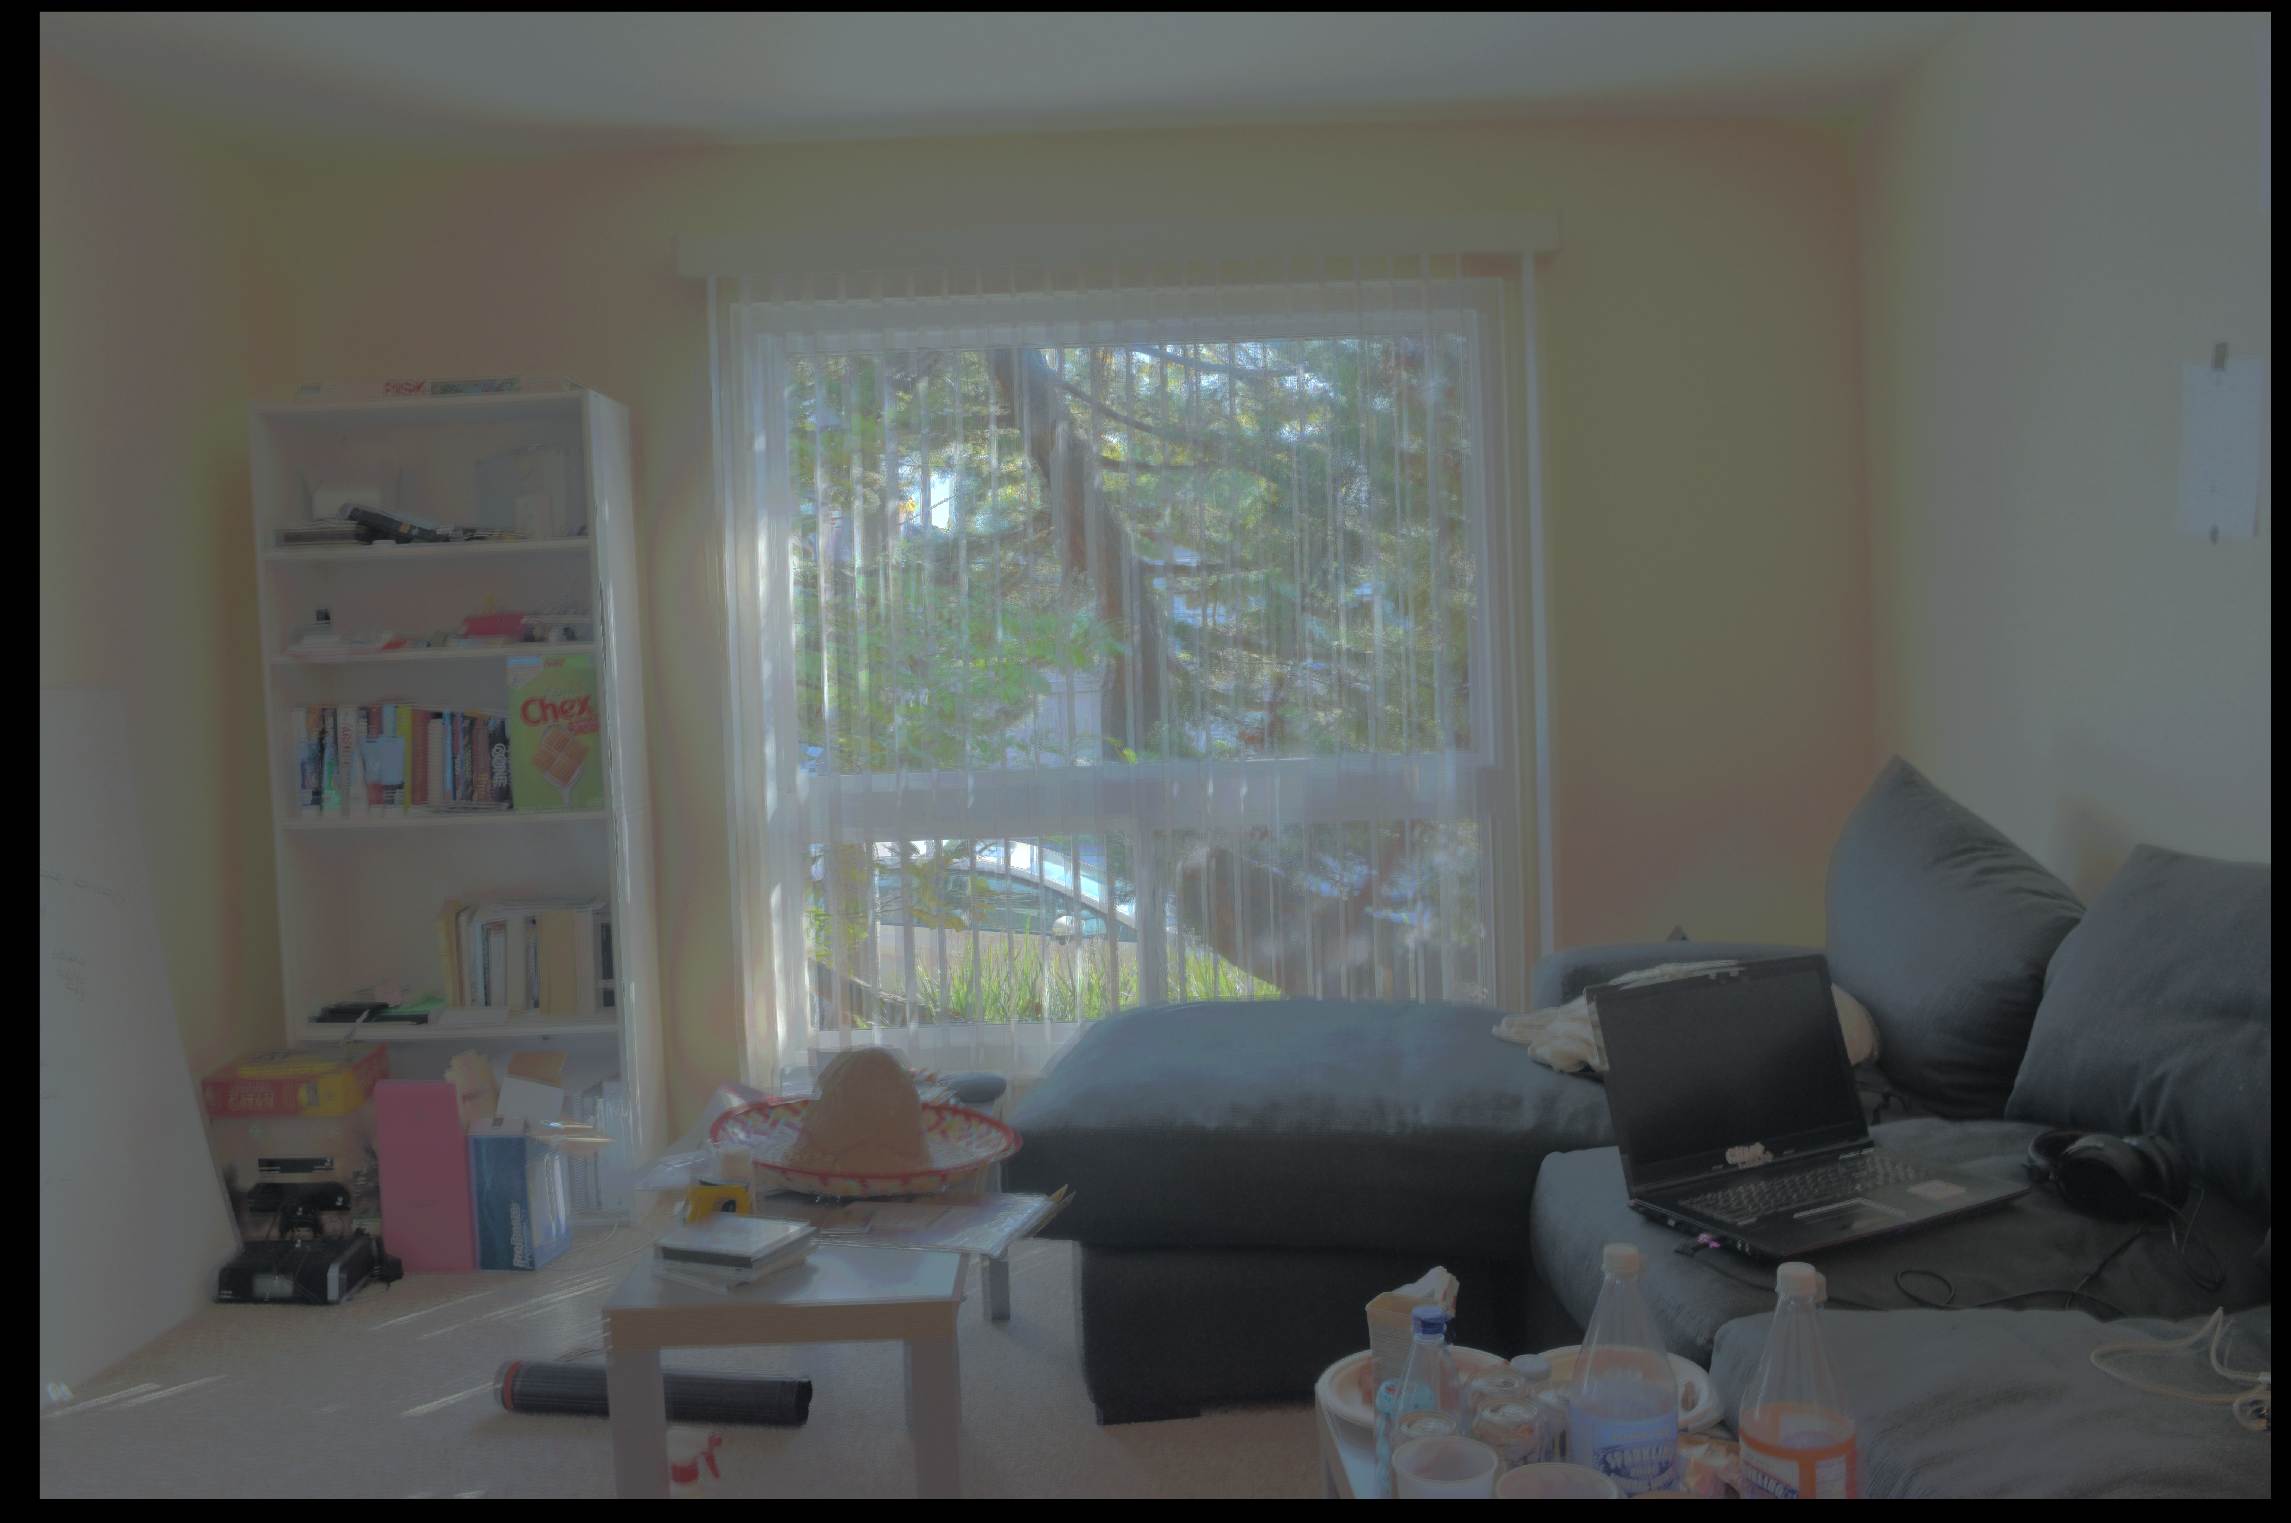
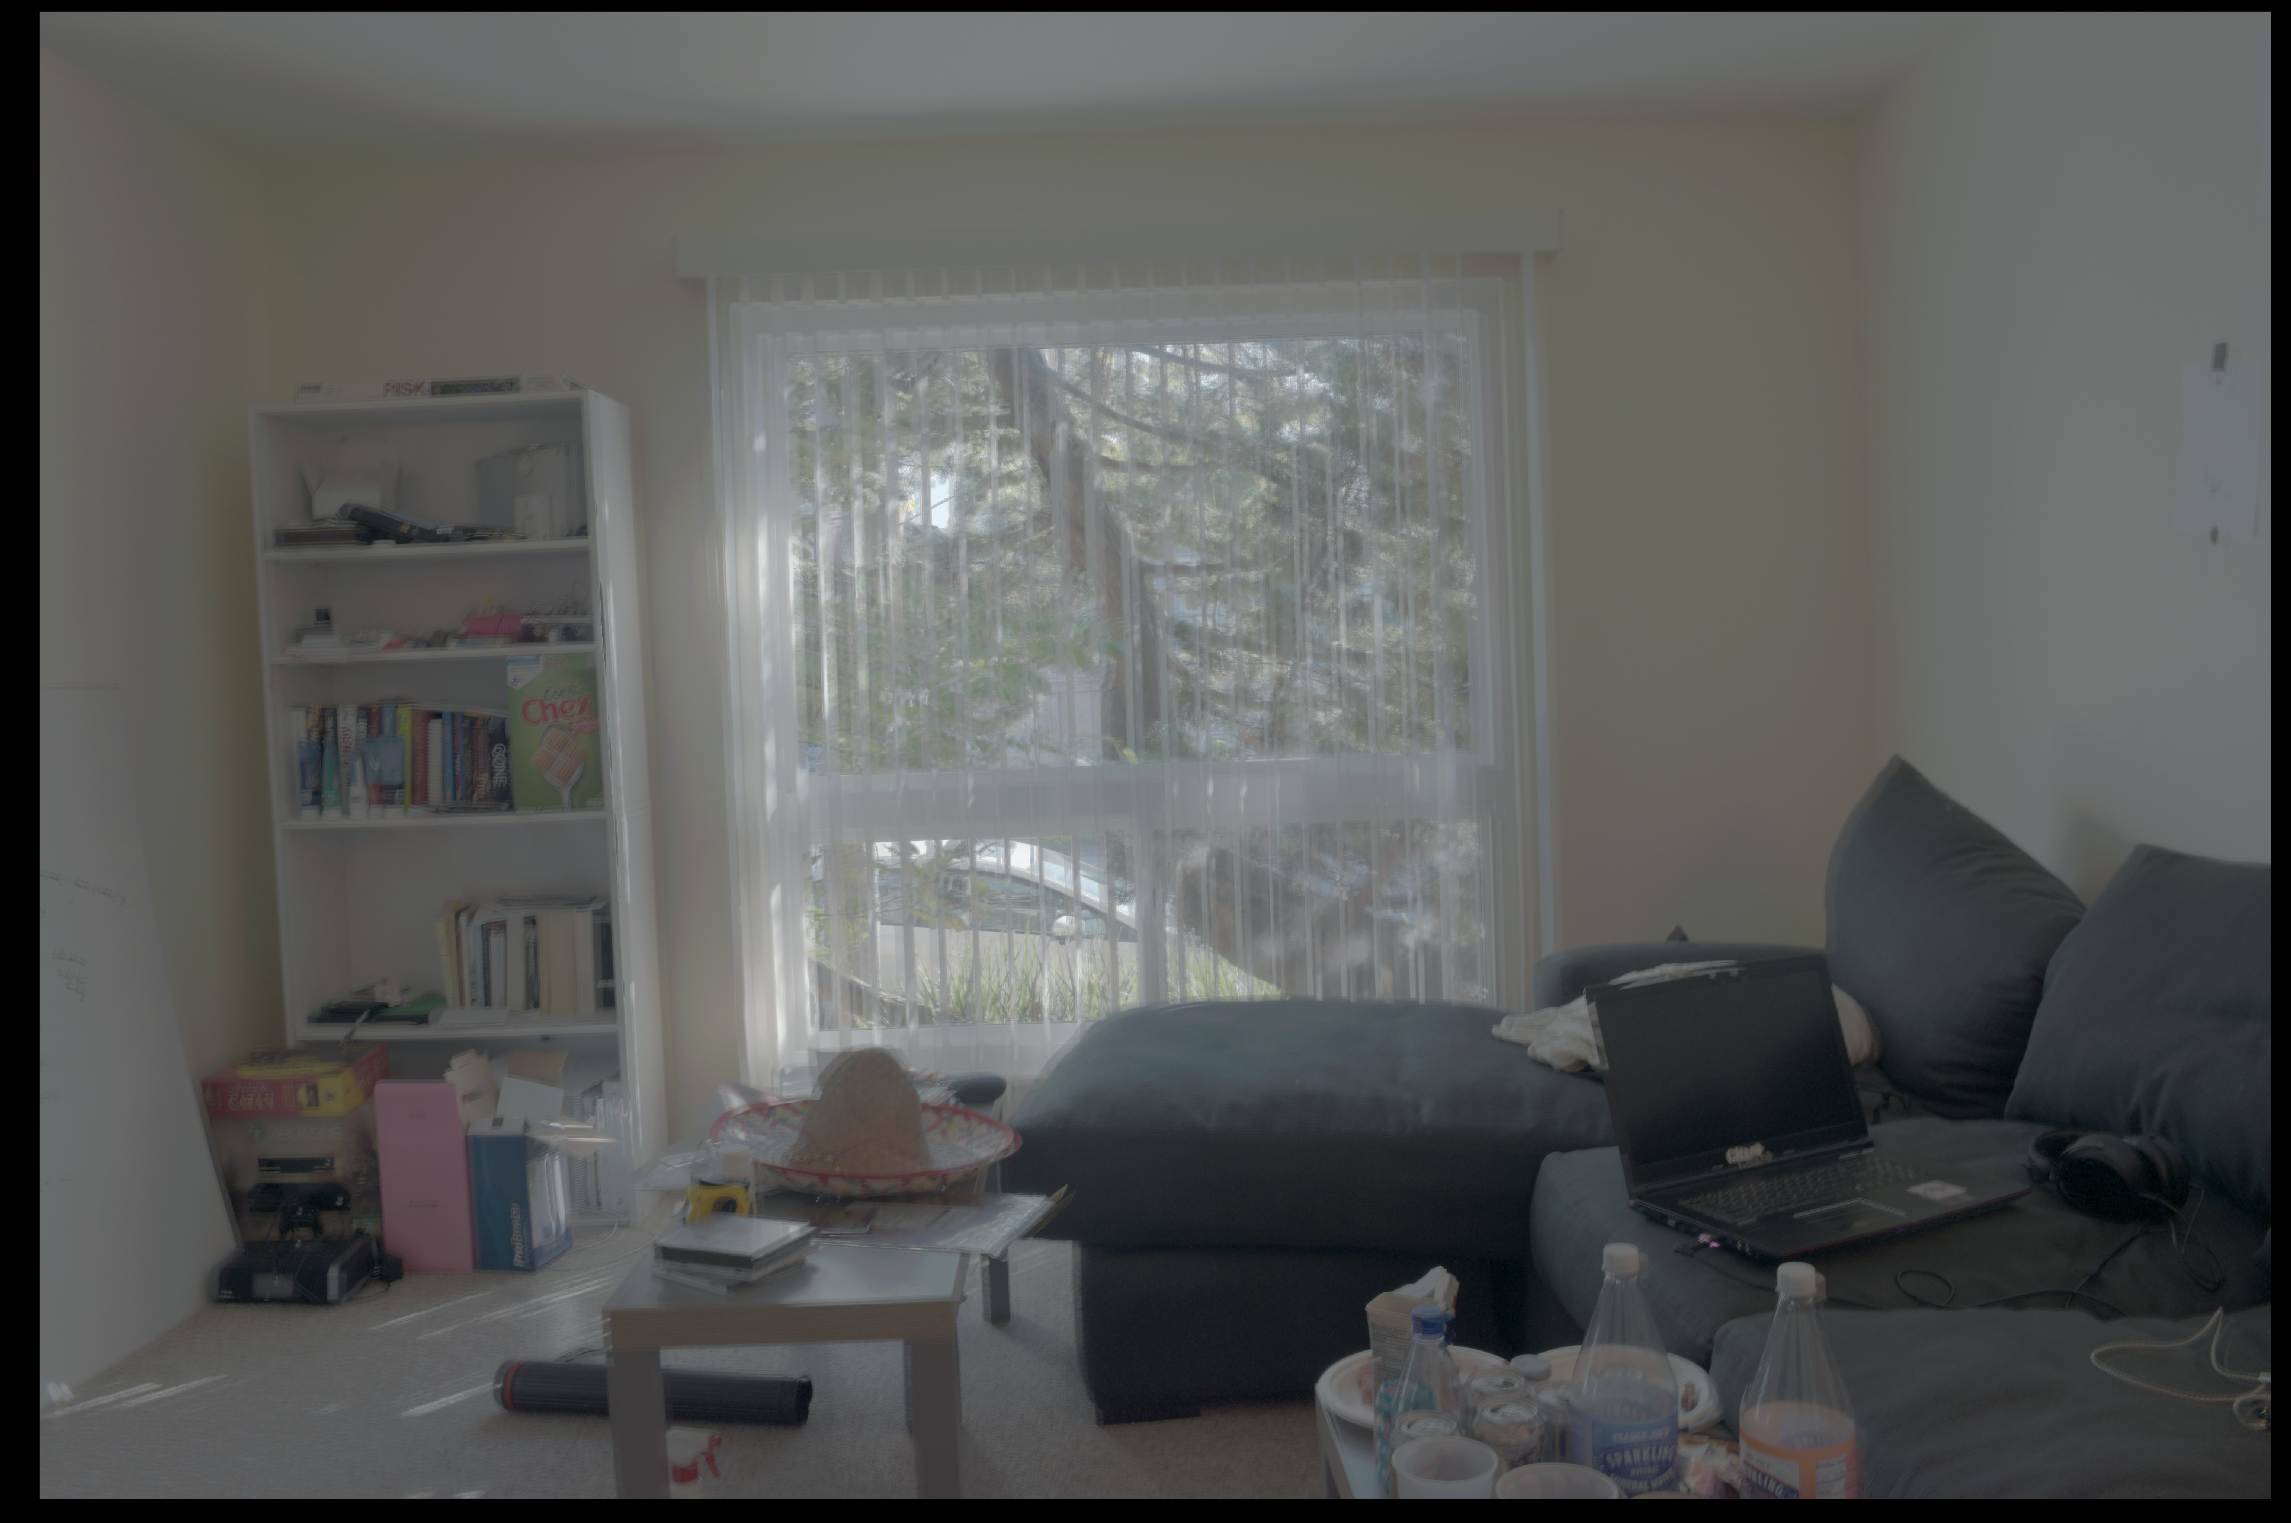
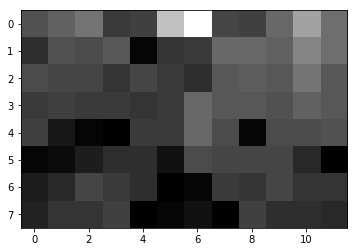
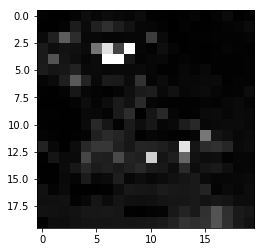
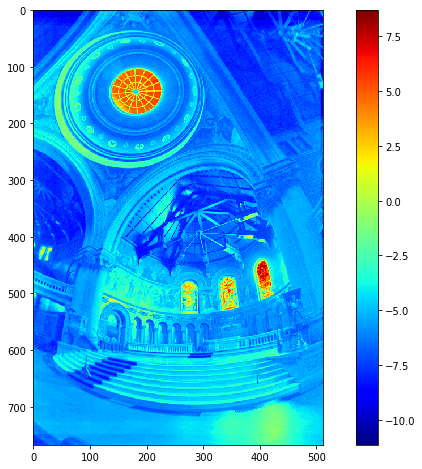
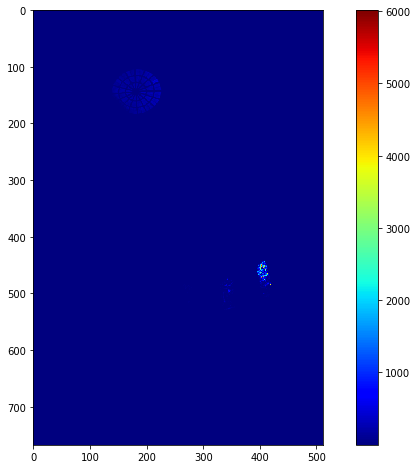
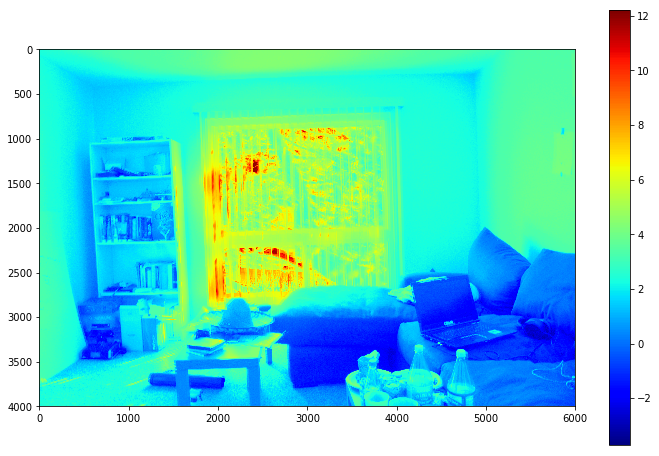
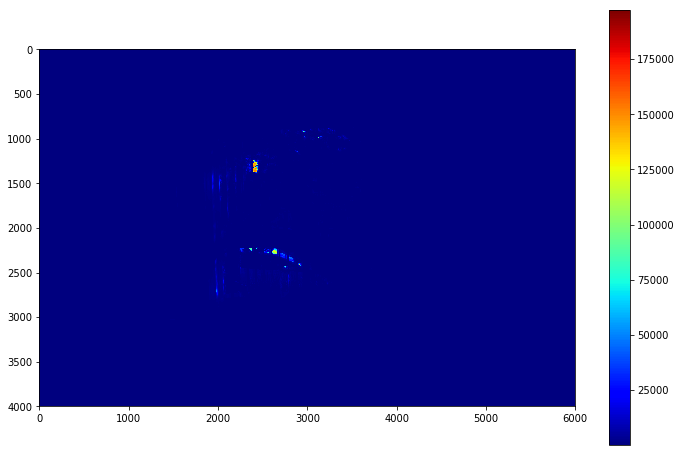
Here are the radiance maps for the images in both original and log scale:
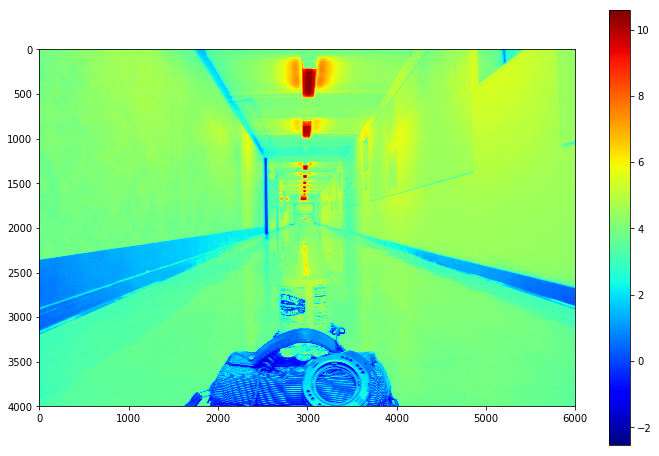
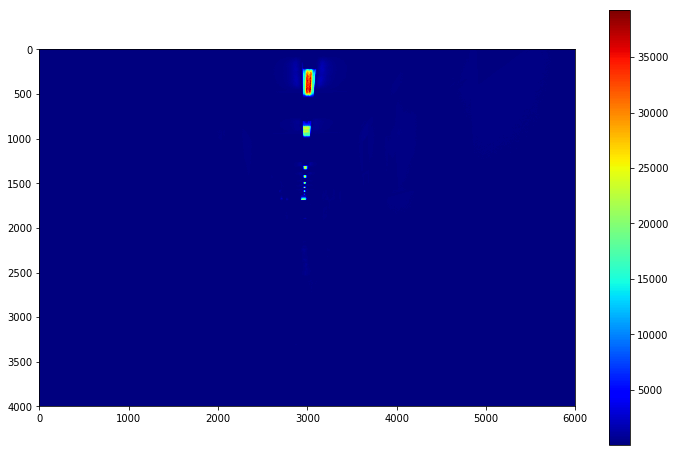
Now we have radiance maps, but we are unable to display it on or low range displays; thus, we need to sample from our radiance map in a way as to bring everything within the image into range. There are various ways of doing this, but a few examples were chosen.
In particular, both a global and local tone mapping was done. A Global linear scaling was done by taking the log radiance maps and dividing them by the difference between the lowest and highest value, then scaling these values between 0 and 1.
The Local mapping that was done was the Durand scaling done in this paper.
A reinhard and linear scaling was also done also.
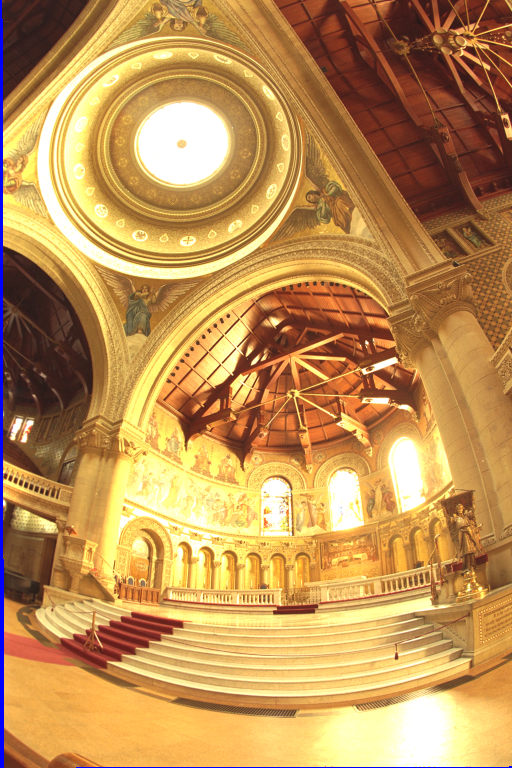
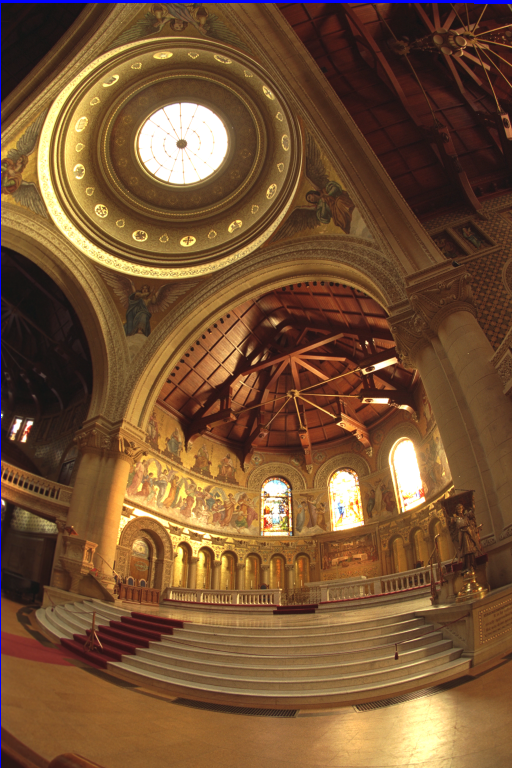
Below are the results from the three test image sets
|
|
|