Images of the Russian Empire: Colorizing the Prokudin-Gorskii Photo Collection
CS 194-26: Intro to Computer Vision and Computational Photography
Gregory Du, CS194-26-aec
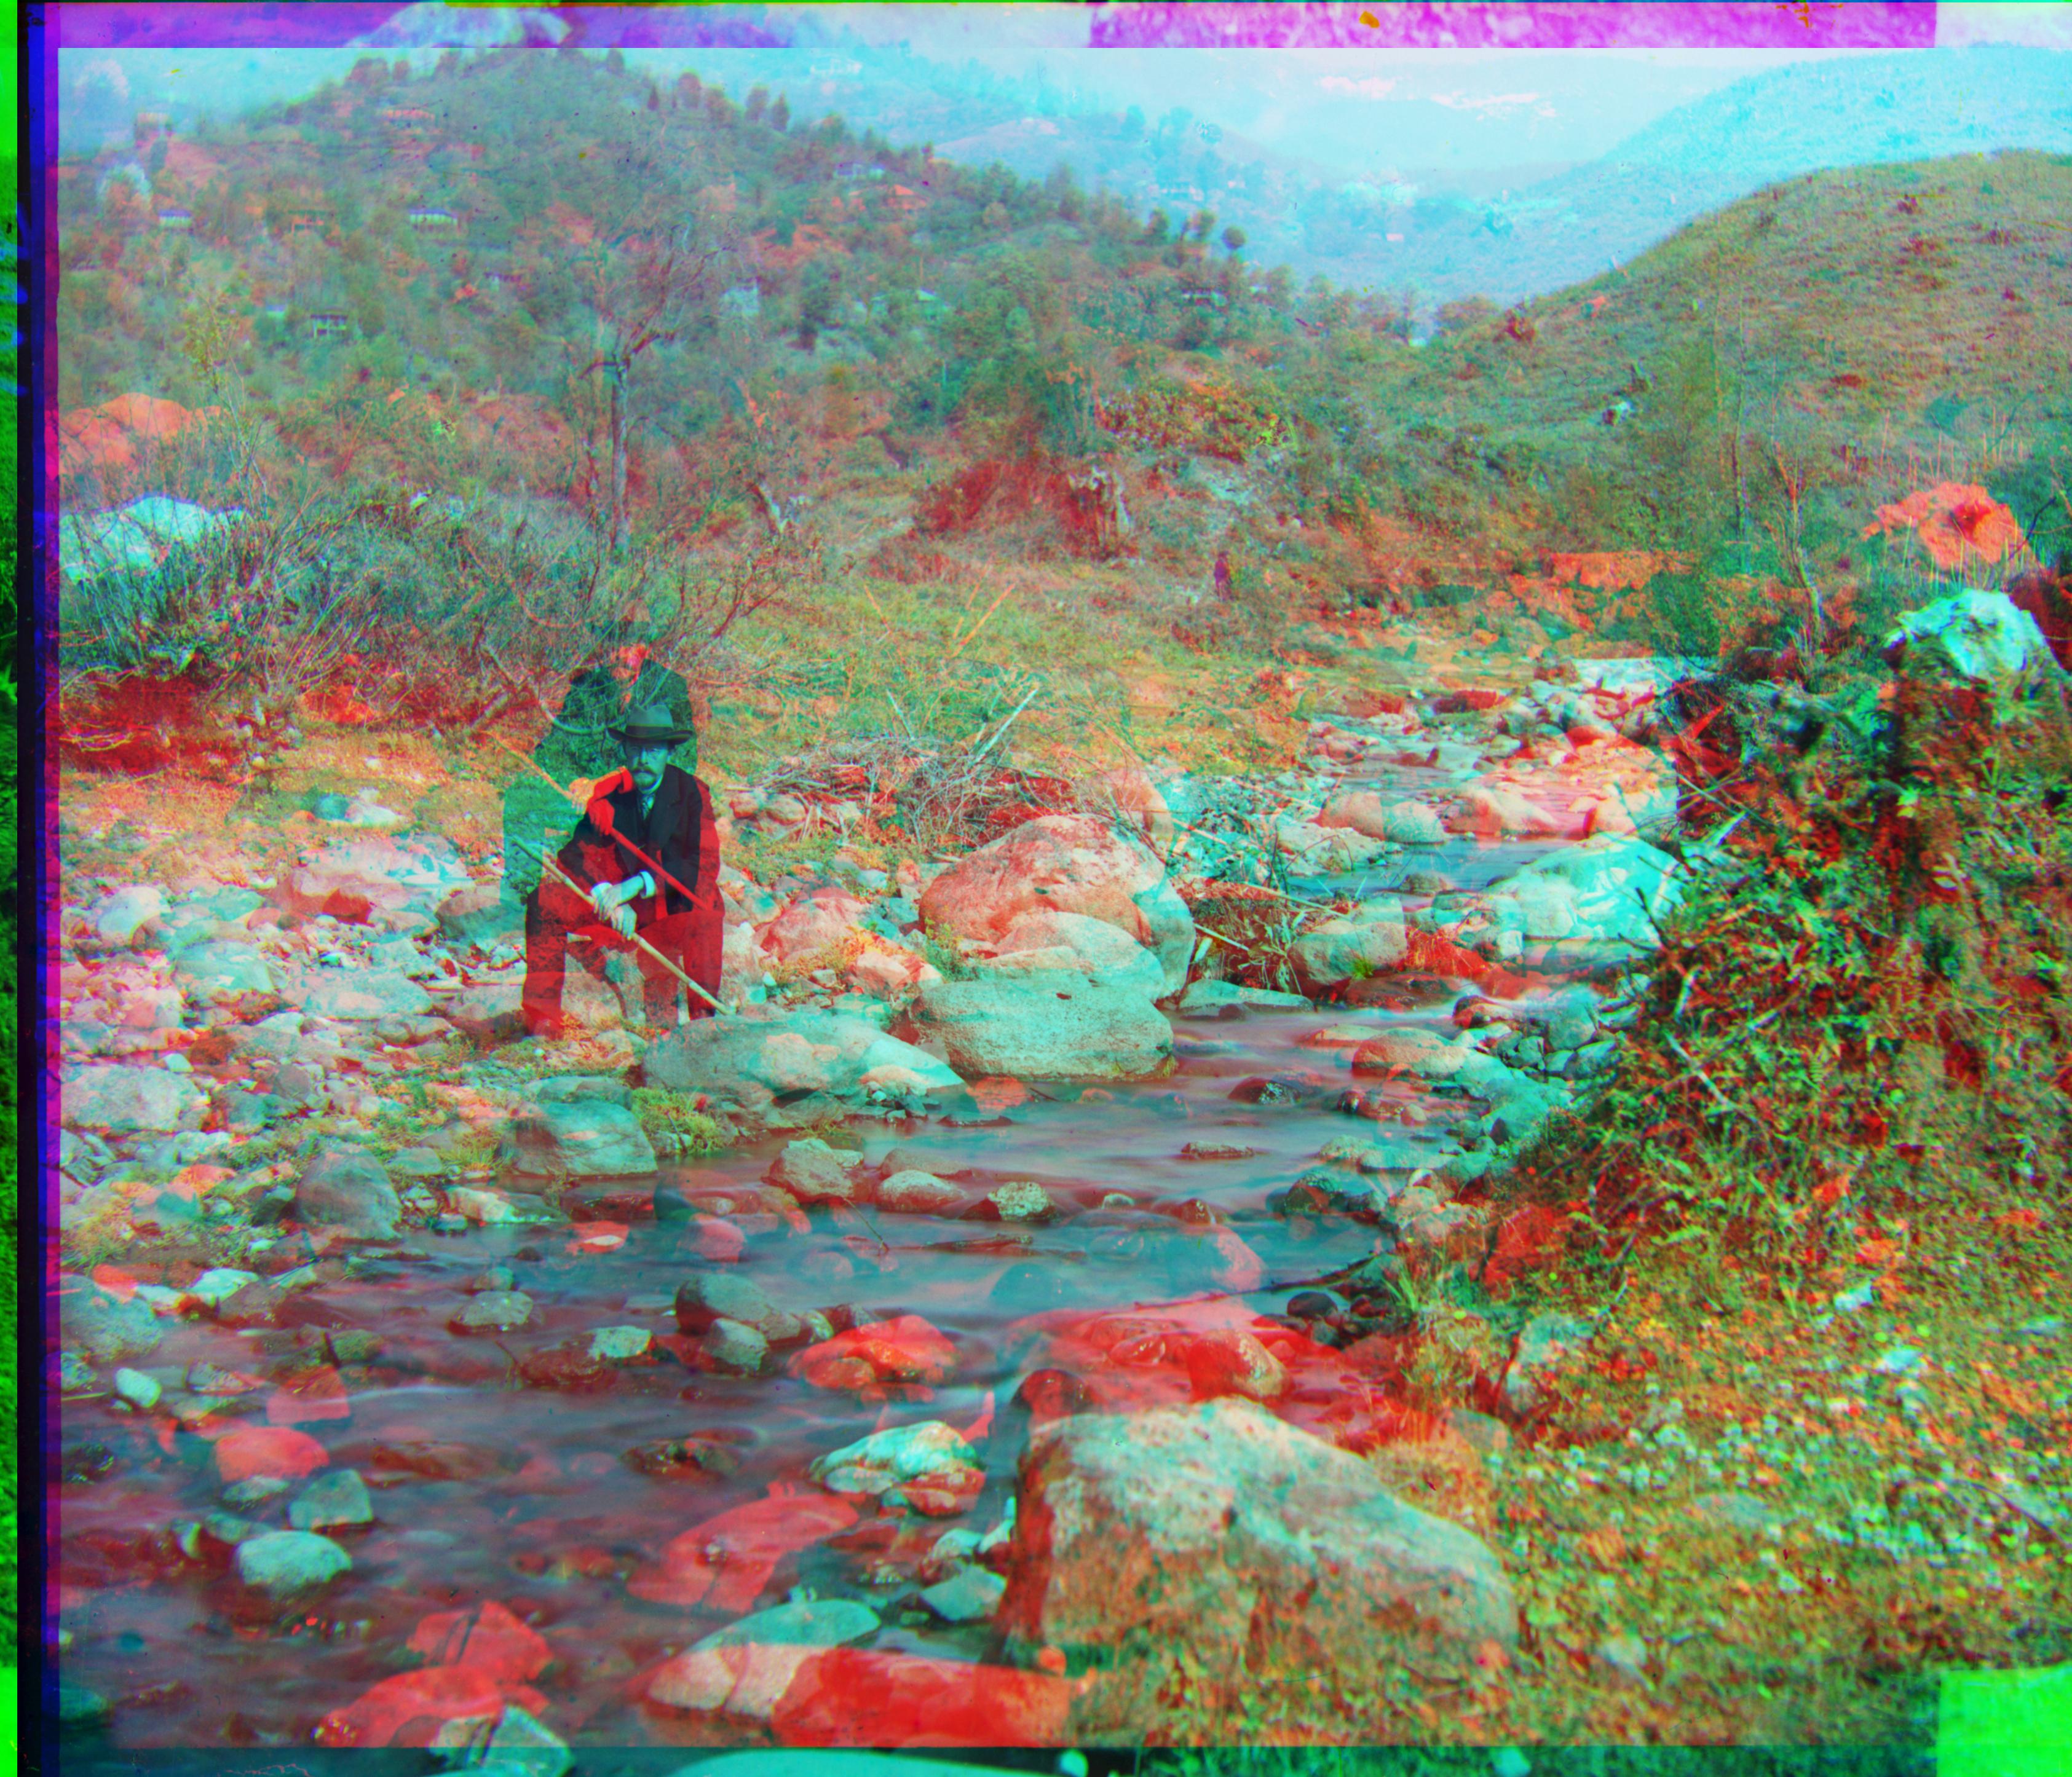
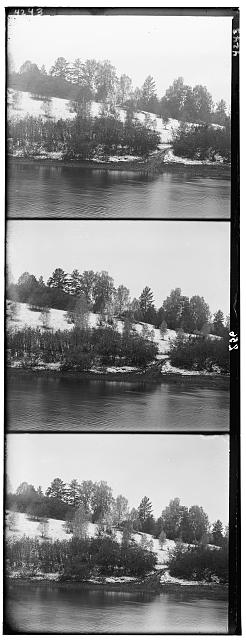 snowy_river.jpg plate
|
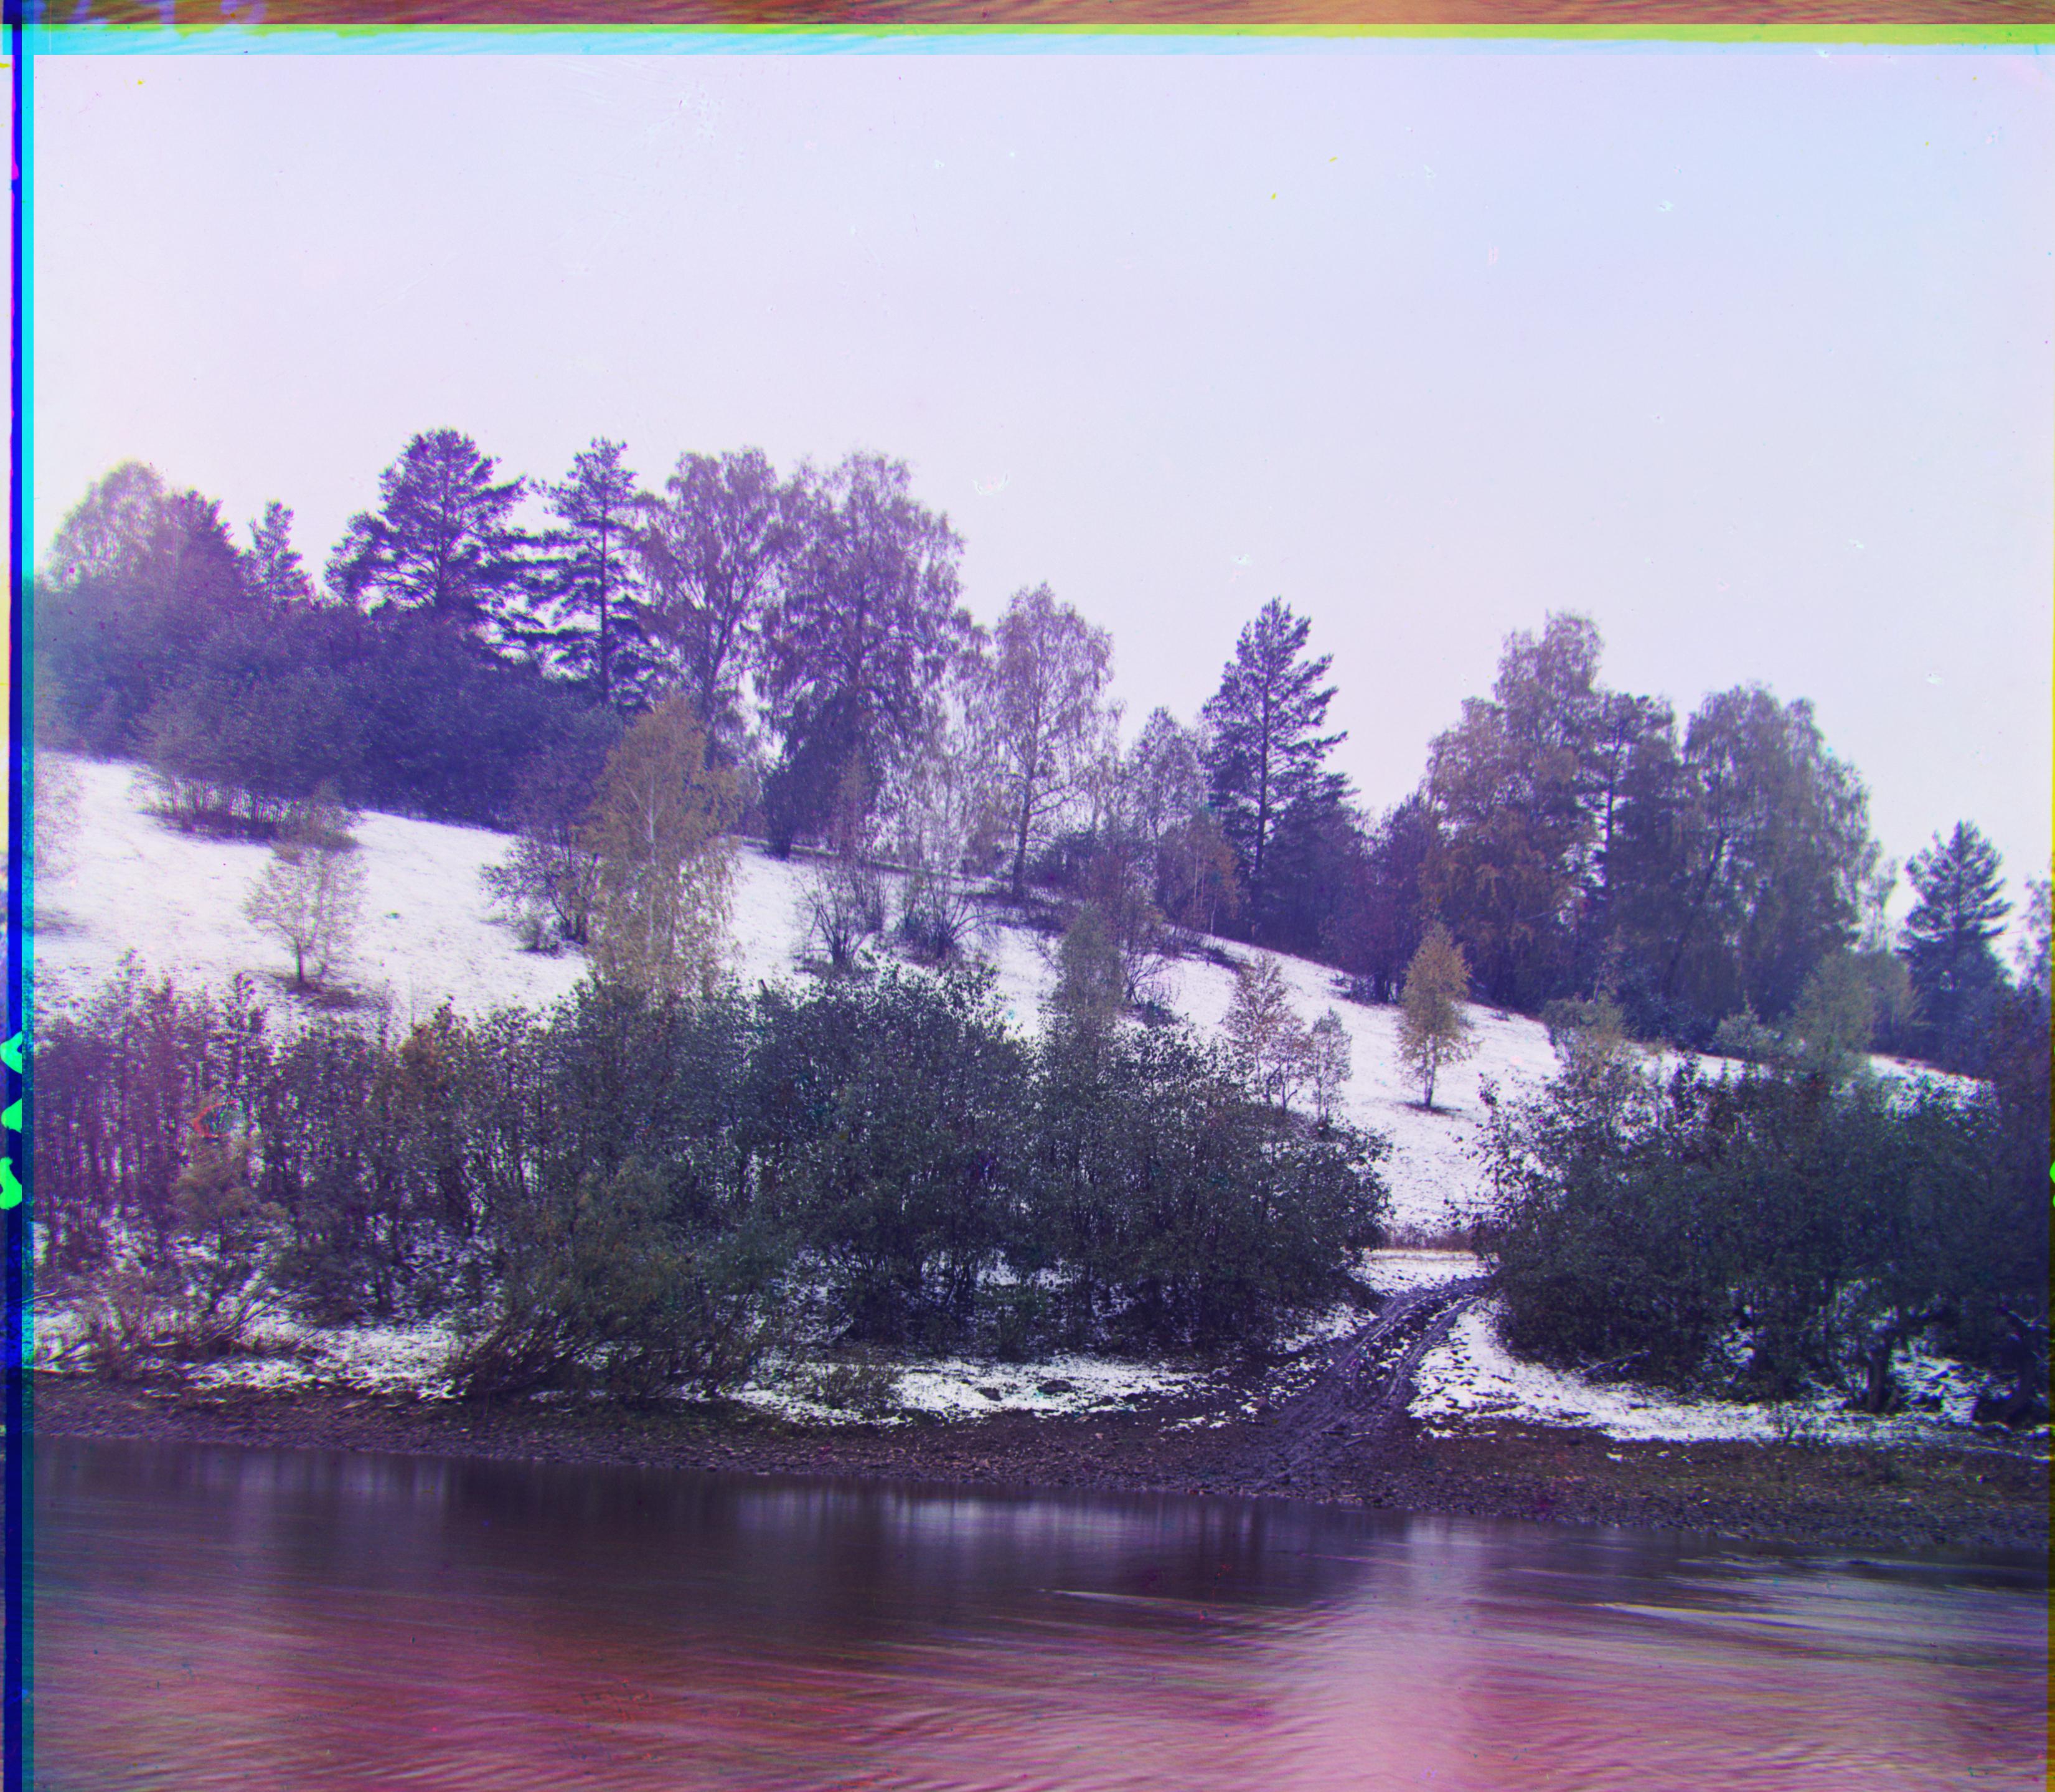 snowy_river.jpg recolorized
|
Overview
This was a really interesting project where we tried to colorize a set of photos given grayscale projections of their red, green, and blue color components. The goal was to recolorize
Prokudin-Gorskii's negative glass plates of various locales throughout Russia, into a set of beautiful color images. It was really compelling to see the result of Prokudin-Gorskii's ambitions,
and the images that resulted are truly a treat to look through. The caption appended to each image has two displacement values, the one marked g represents the green negative displacement,
and the one marked r represents the red negative displacement assuming the blue negative is "ground-truth". All code is written in Python with numpy, and scikit-image.
Technical Approach
The plates we received are stacked blue, green, red negatives on a rectangular glass plate, and for the sake of simplicity, we can assume that all 3 images are all the exact same size
and resolution. Therefore, what we're trying to do is to overlay the images, one on top of another to recreate what the color image should look like, or in other words, our problem is one of
alignment. We use a rather rudimentary alignment technique, where we keep a static color plate, in this case the blue plate, and then try our best to shift the red and green plates around
over the blue plate so that the resulting color image looks right. Since we need some way of empirically defining so called "rightness", we can choose an alignment metric, in my case SSD (sum of
squared differences). Essentially, for each alignment, we can calculate the metric for the entire set of pixels, and just try to minimize the SSD for any alignment. When we're dealing with
low resolution .jpg images, it's fast enough to just find a range of alignments (in my case [-20, 20] both horizontally and vertically), and try every alignment possible (we can realign an image with
np.roll), and choose the best one (the one with the lowest SSD). Also small note: when we shift the image, conventional wisdom may tell us that shifting past the border of an image
drops those pixels from the metric calculation. In implementation, we actually use a circular shift, which implies pixels shifted past the border actually shift to the opposing border.
Kinda weird, but not too bad.
Alignment Algorithm on Low Resolution Images:
 cathedral.jpg
r:[2, 5], g:[3, 12]
|
 monastery.jpg
r:[2, -3], g:[2, 3]
|
 tobolsk.jpg
r:[3, 3] g:[3, 6]
|
Optimizations, or Why This Method is Bad
This method works fine for JPEGs since we're working with resolutions of ~(300 x 400). But these images are pretty low quality, so naturally, we'd prefer to recolorize higher quality images as well.
There's nothing inherently wrong with this method, but if we just charge on ahead and try to scale up this method to work with images that have resolutions of ~(3000 x 4000), we'll end up
with a lot of spare time and no spare memory. Since the image resolution is higher, we're most likely going to need to search a much bigger range of displacements, so not only is it slower to calculate
the metric per displacement, but we have to calculate the metric a drastically higher number of times. Clearly we don't have the time to wait for that, so we'll turn to the image pyramid optimization. In essence
we're going to do something similar to mipmapping a texture. We'll get a bunch of downsampled images (utilizing skimage.transform.rescale) from full resolution, to half res, to quarter res etc. Technically, we could do full res, fifth res, twenty-fifth res
or really any series of resolution reductions, but scale = 0.5 is nice and it mirrors the mipmapping procedure well, so I'll use that. The pyramid can be arbitrarily tall, at least until we hit one solitary
pixel, so let's just build 7 levels for now. We can also choose an arbitrary displacement range to search at the topmost level, so let's go with [-15, 15] both horizontally and vertically. We'll store
these downsampled images in a list, and then with our lowest res level, we'll use our exhaustive search protocol defined in the previous section and find a proposed displacement, prop_disp. Then in the next lowest res level,
we'll run exhaustive search with a displacement range [prop_disp.x - 1 / scale, prop_disp.x + 1 / scale] horizontally, and [prop_disp.y - 1 / scale, prop_disp.y + 1 / scale]
vertically. This "proposed displacement to new exhaustive search range" cycles per-level of our image pyramid ergo, on our full res pyramid level, we're running exhaustive search on the range
we calculated from the previous level, and this will generate the final displacement. Now we can recolorize images much faster! The script I wrote will automatically apply this optimization if
we're working with .tif files, and will use traditional exhaustive search for low resolution .jpg files.
Alignment Algorithm on High Resolution Images:
 castle.jpg
r:[3, 35], g:[4, 98]
|
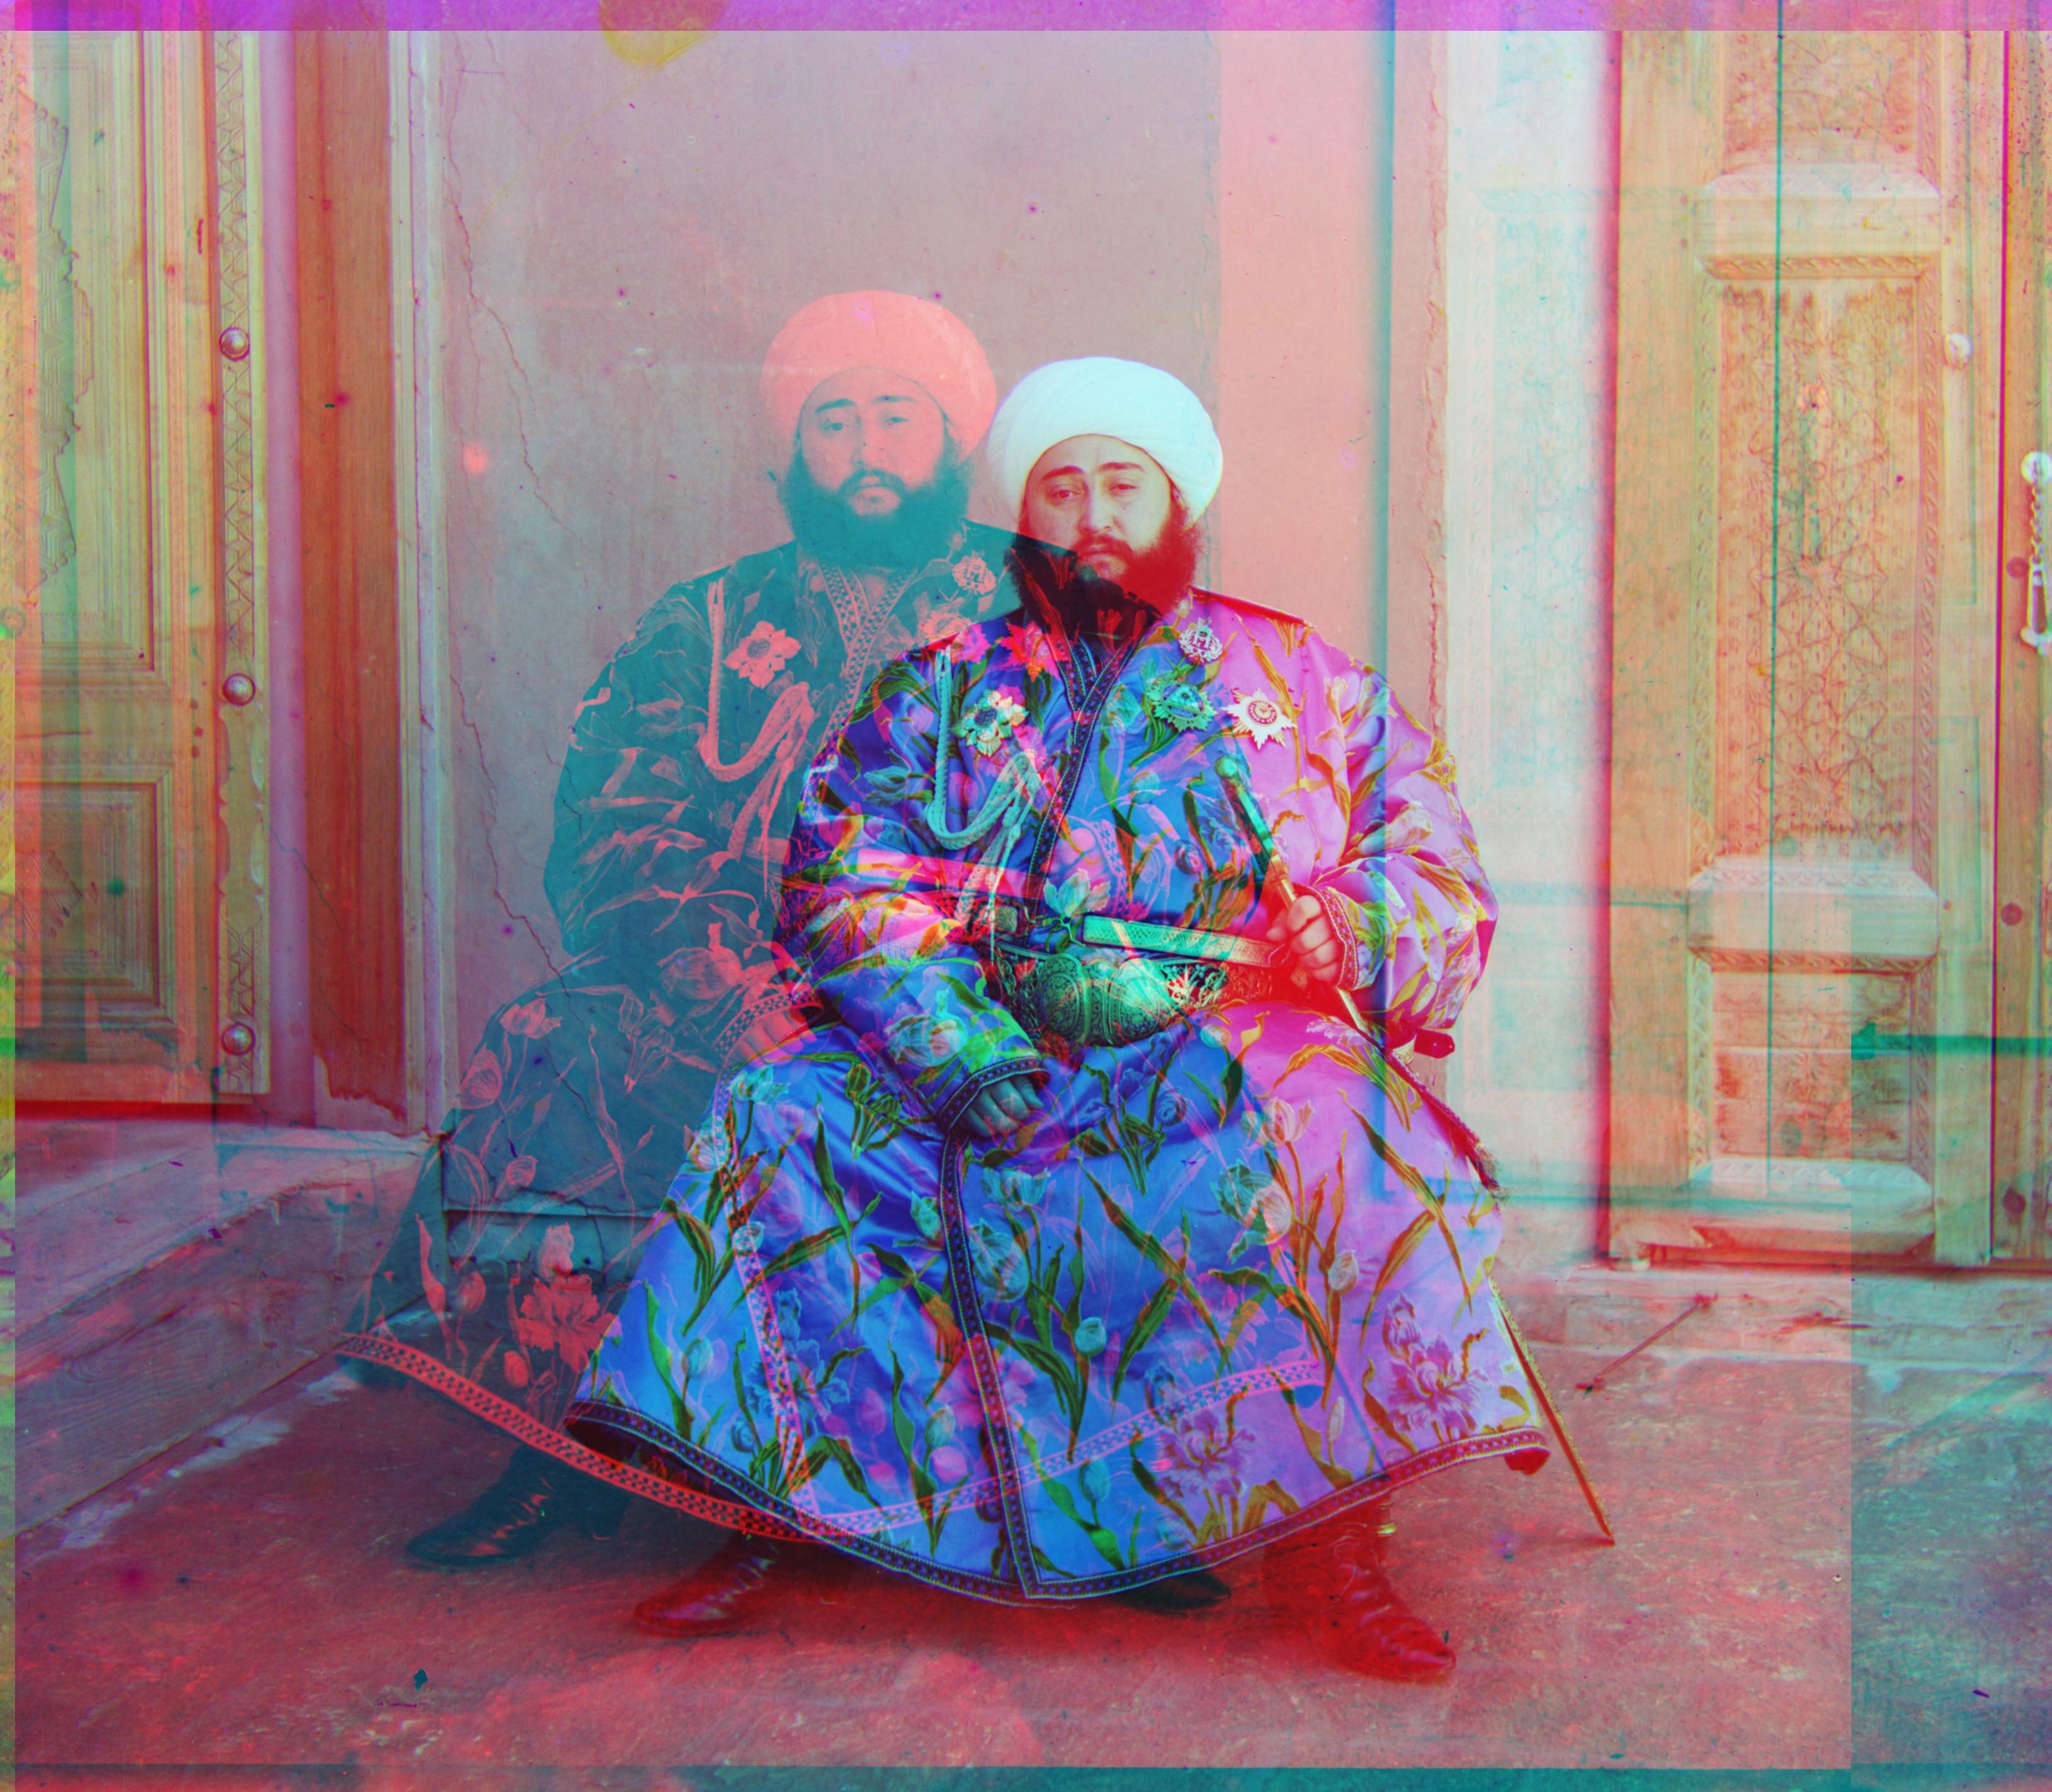 emir.jpg
r:[24, 49], g:[-319, 0]
|
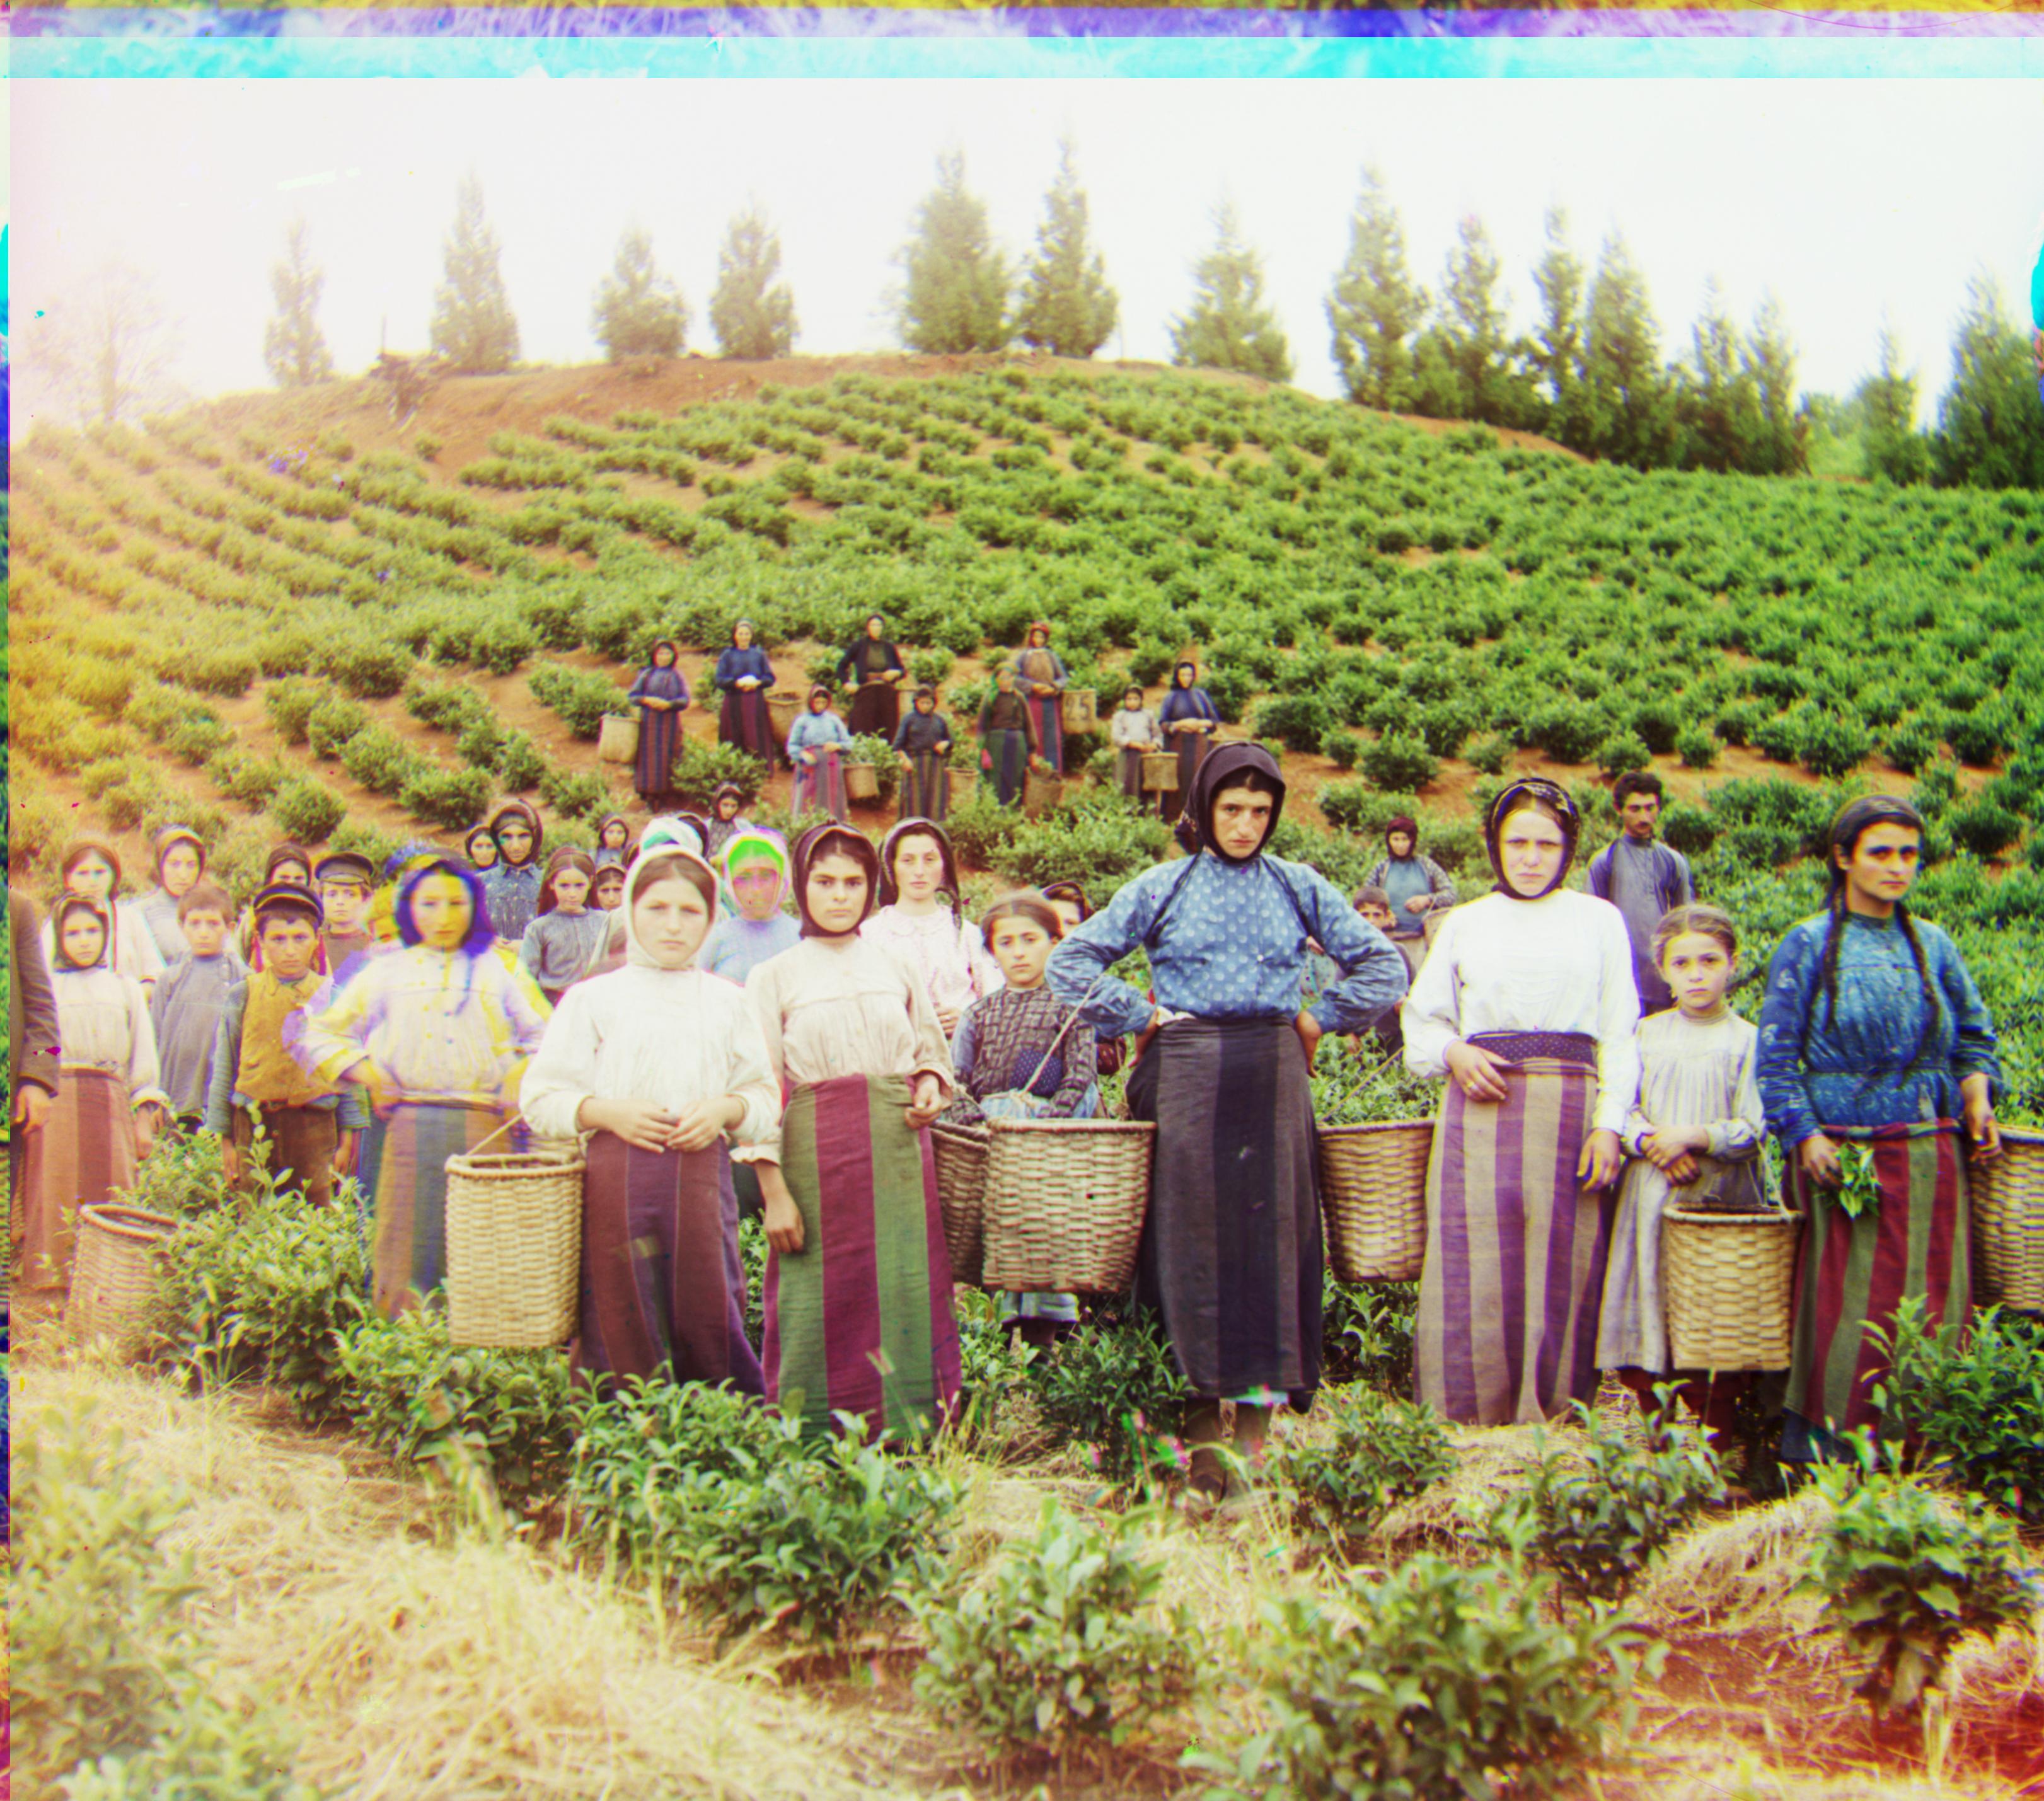 harvesters.jpg
r:[16, 59], g:[13, 124]
|
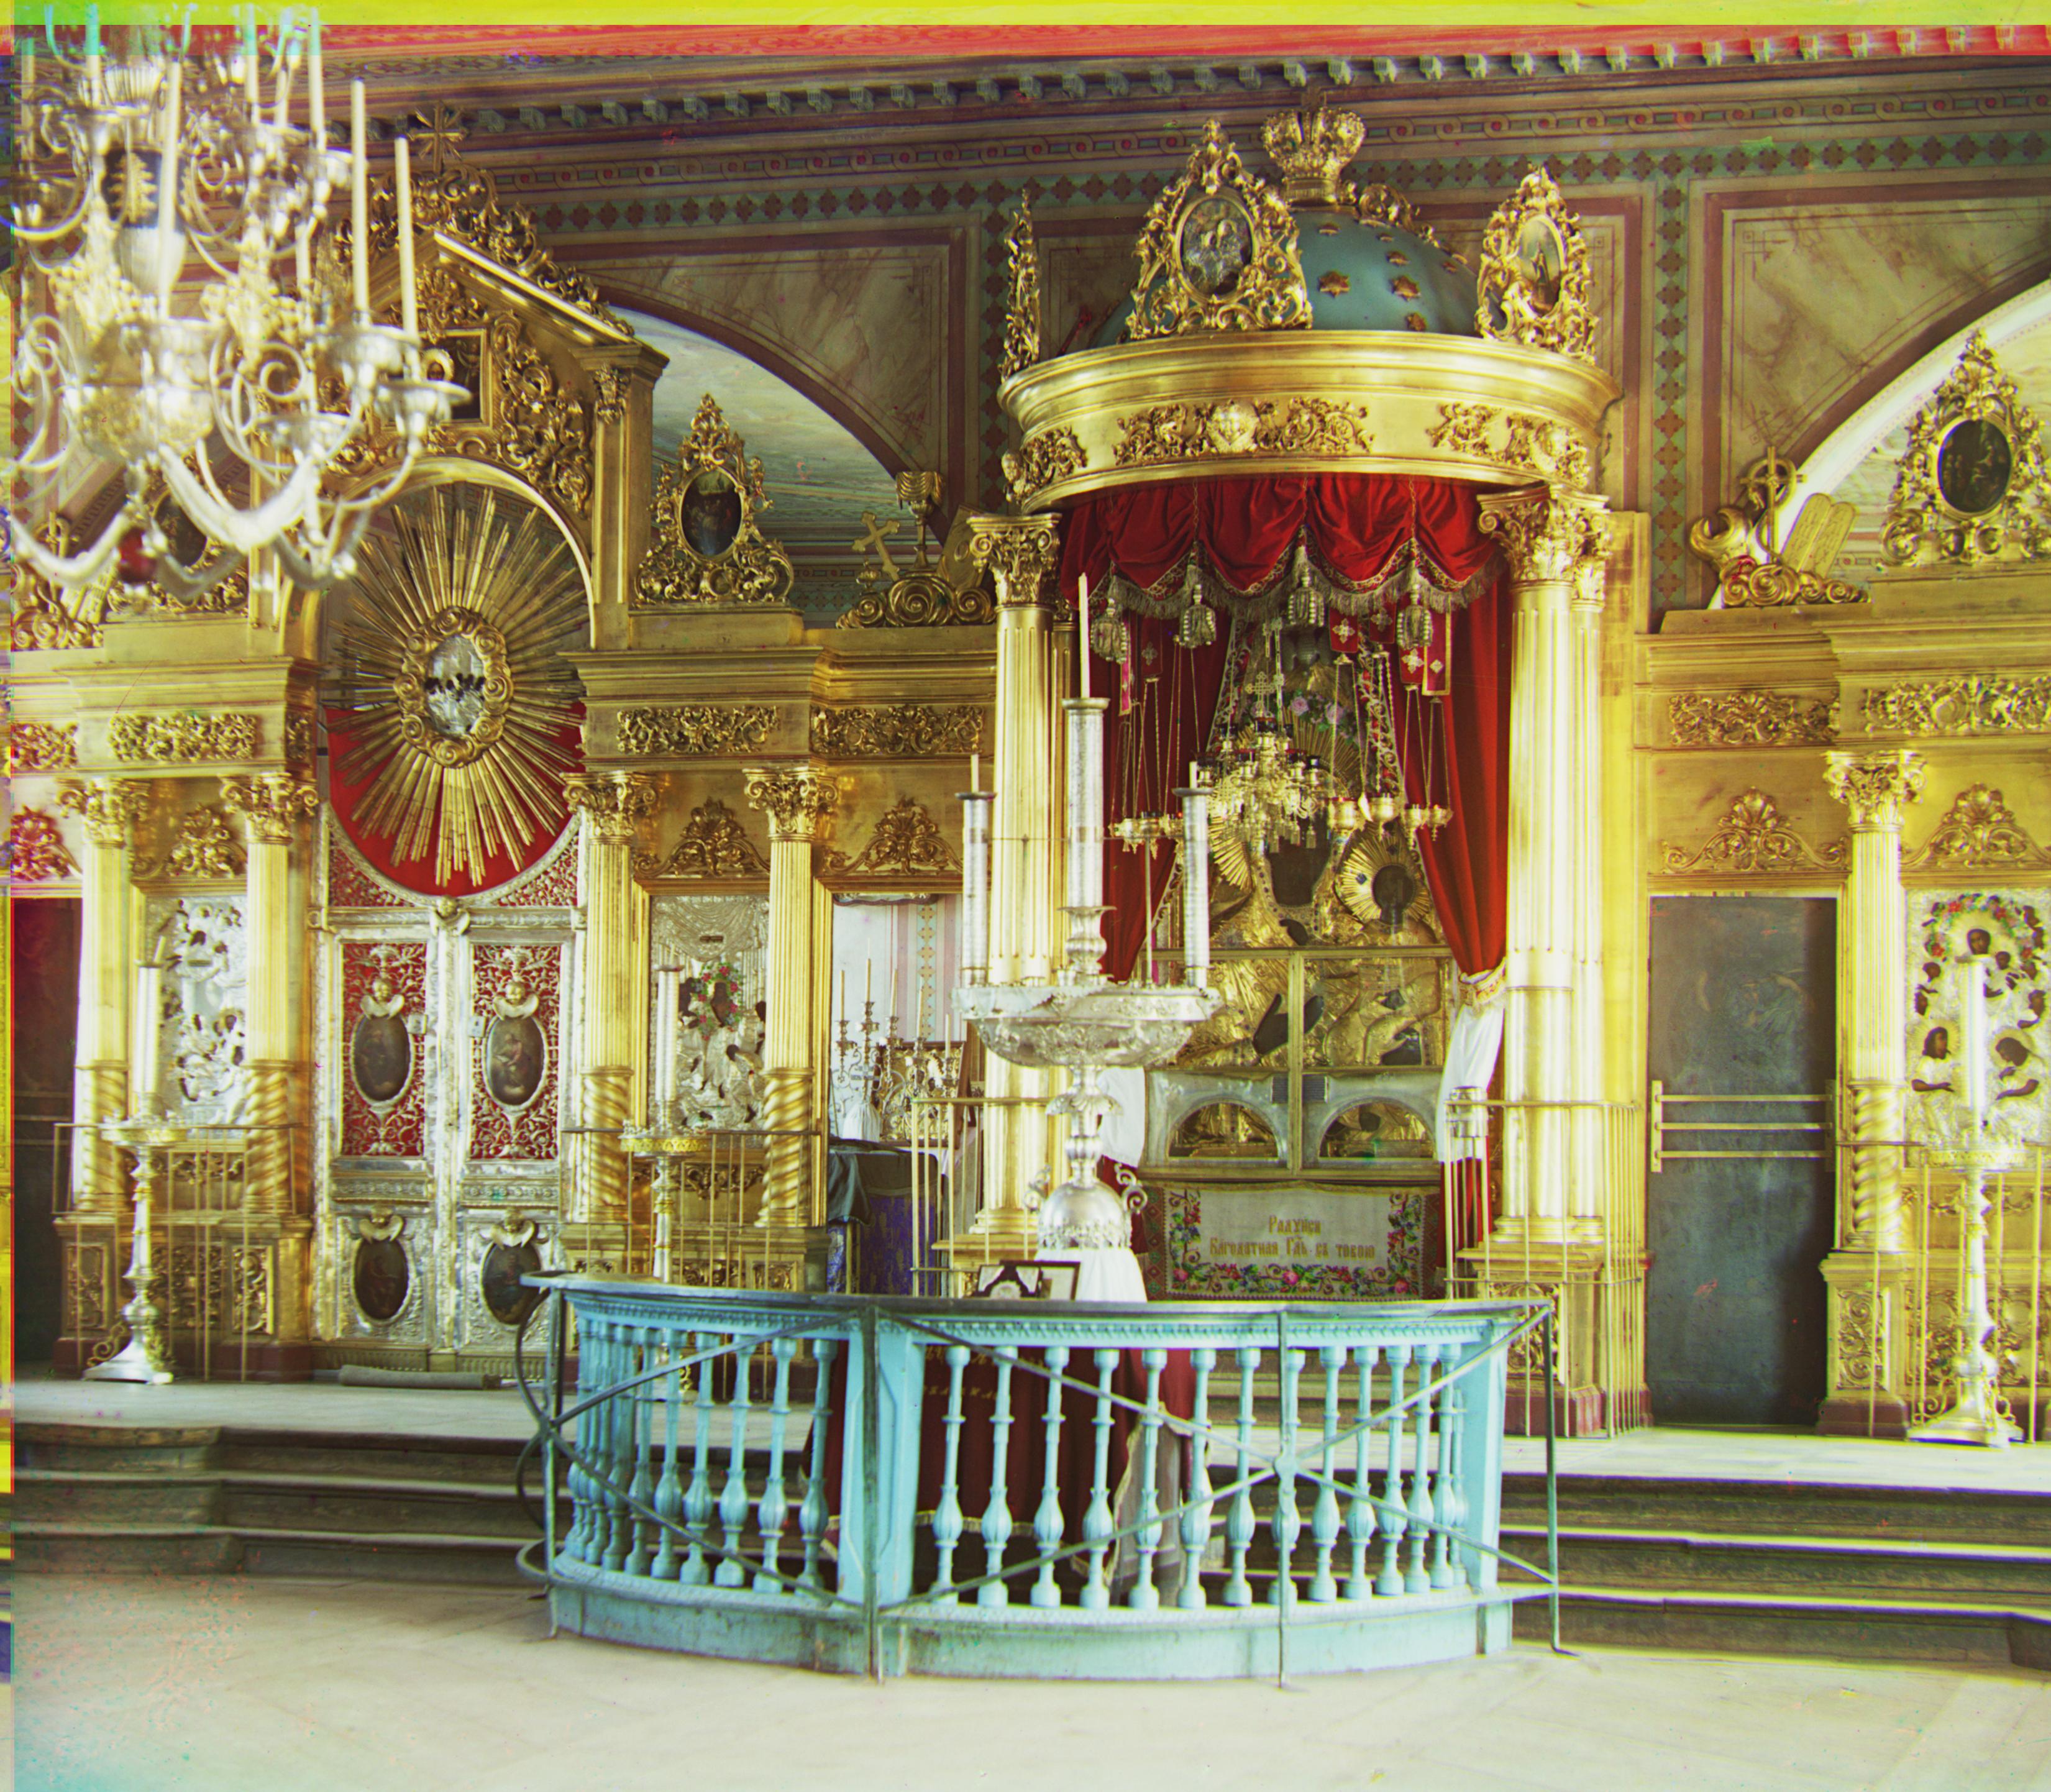 icon.jpg
r:[17, 40], g:[23, 89]
|
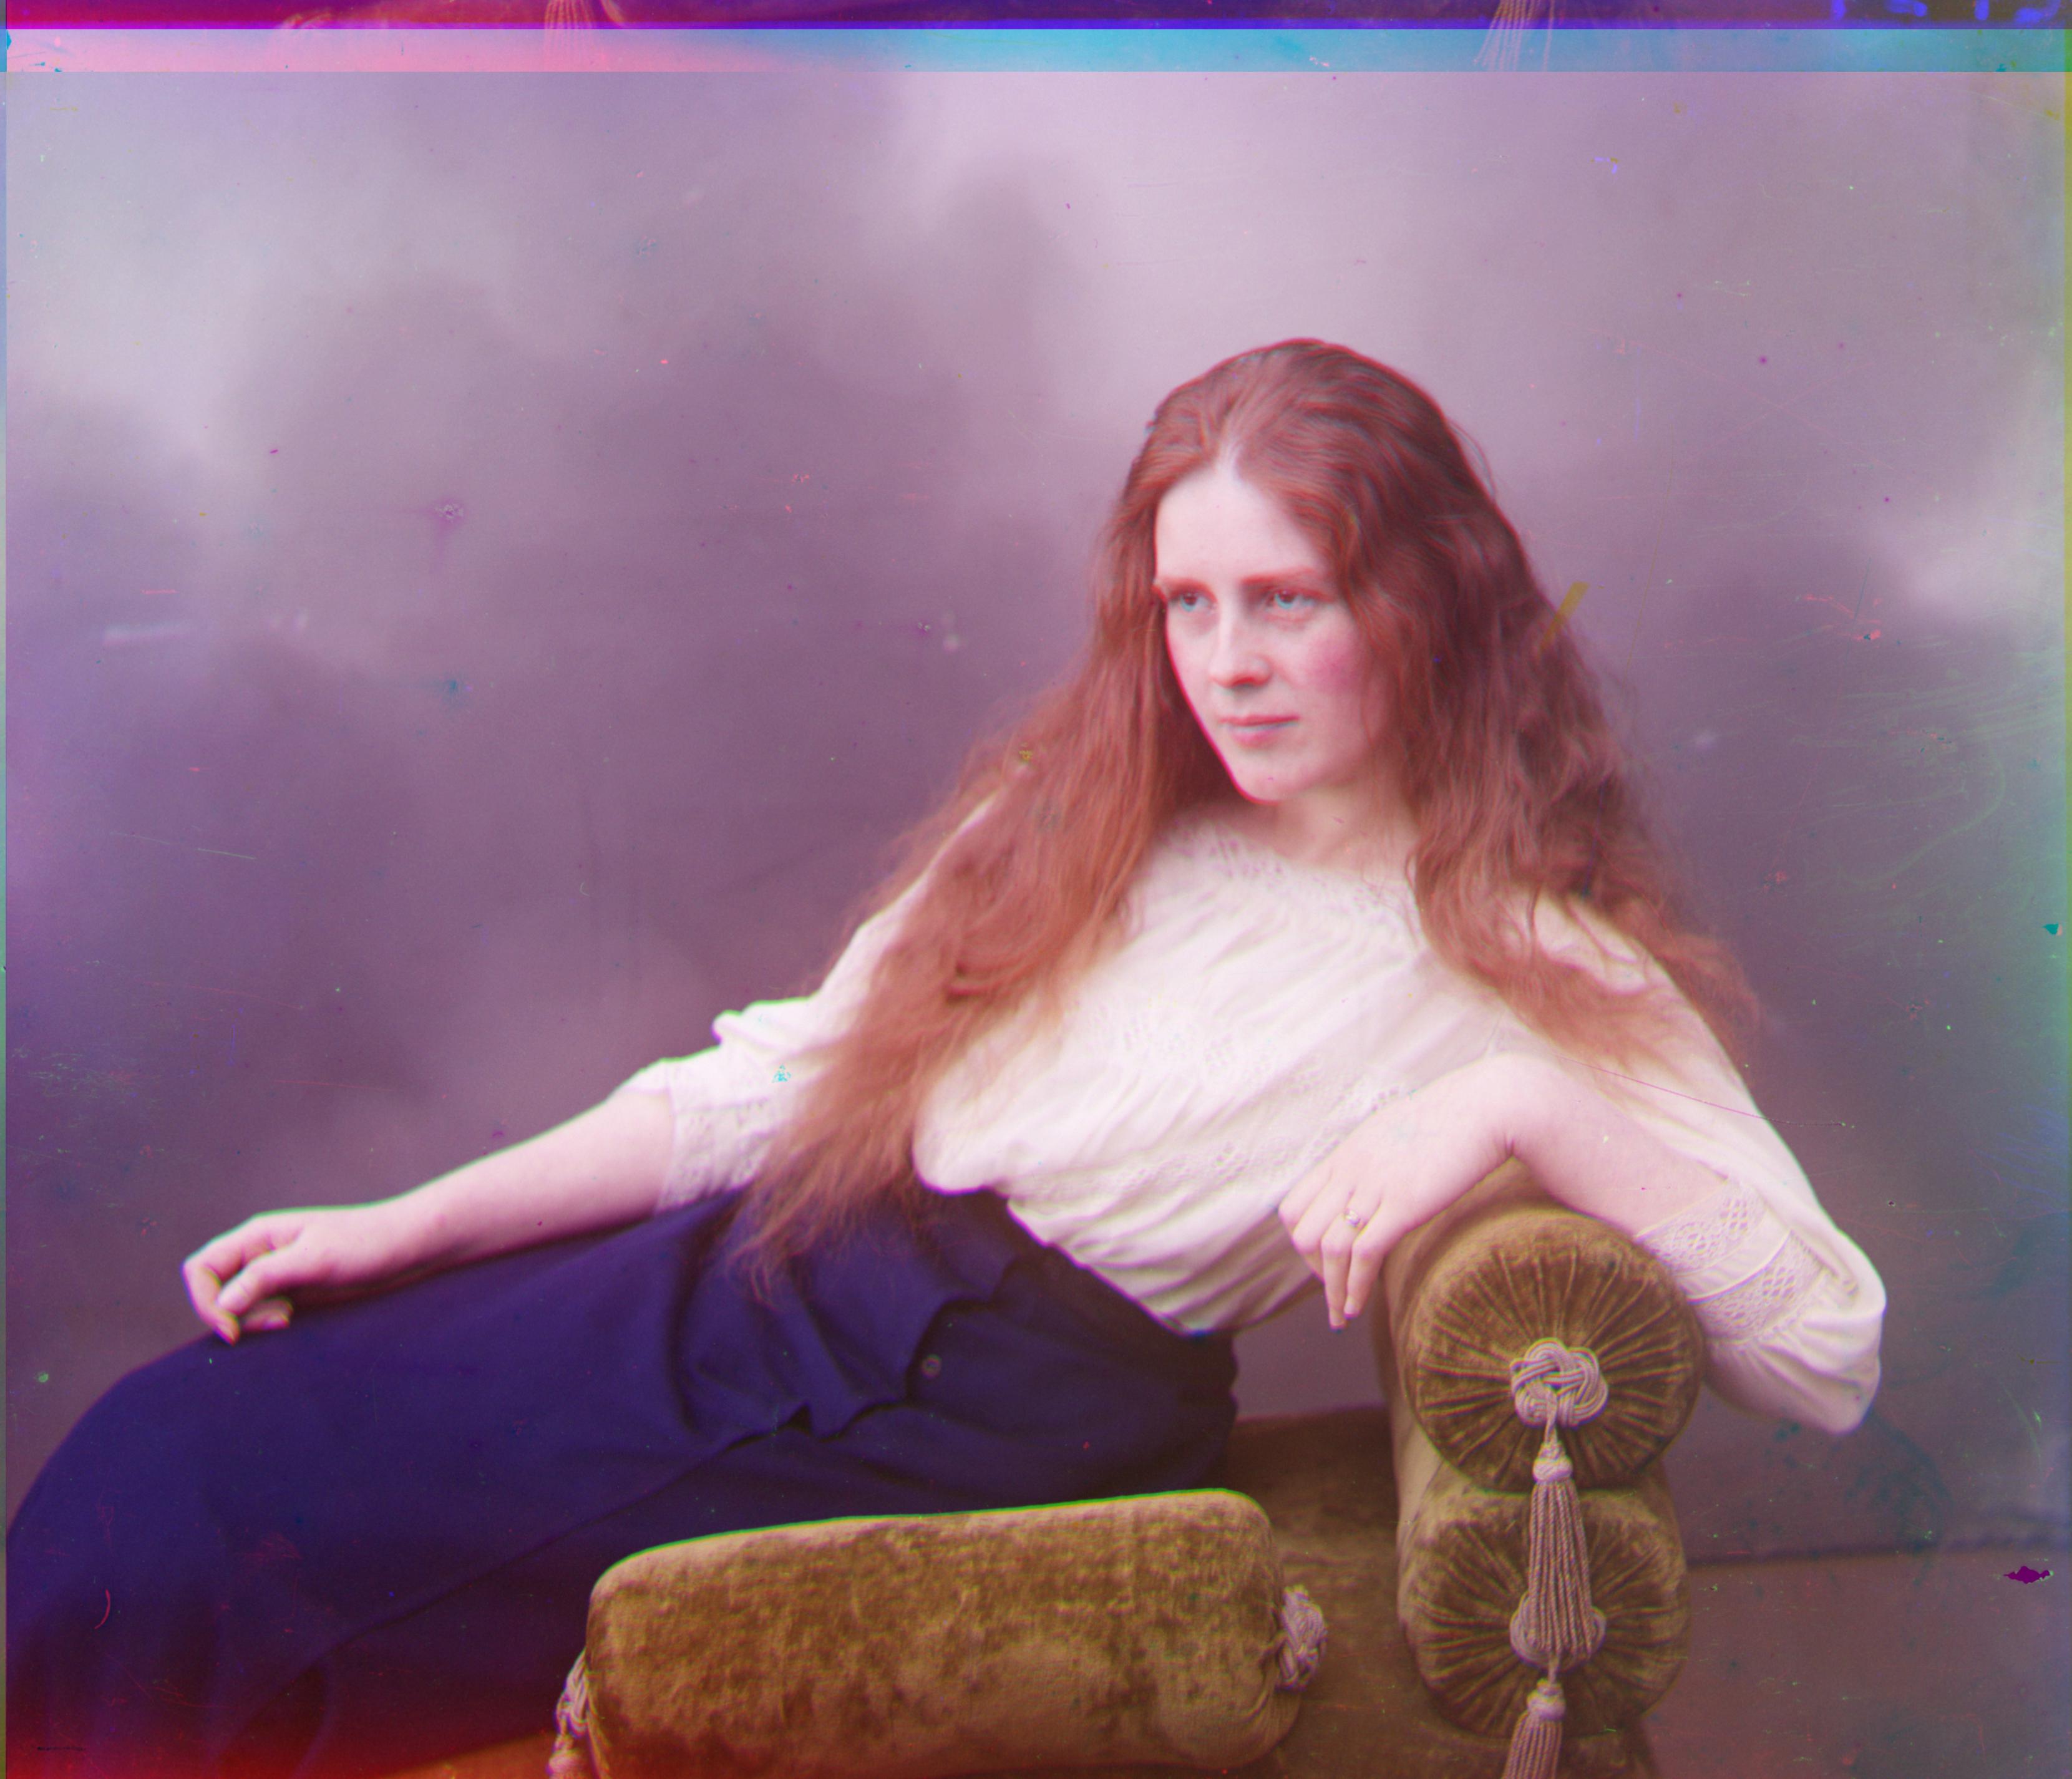 lady.jpg
r:[9, 47], g:[11, 115]
|
 melons.jpg
r:[10, 82], g:[13, 179]
|
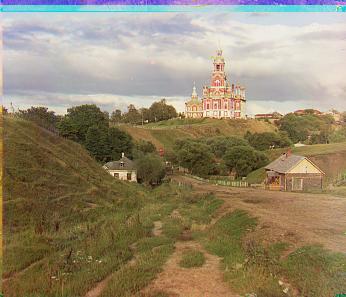
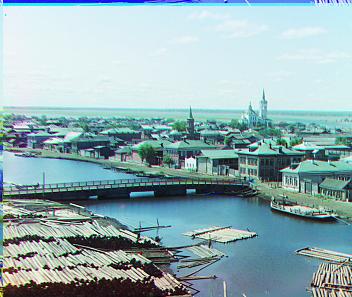
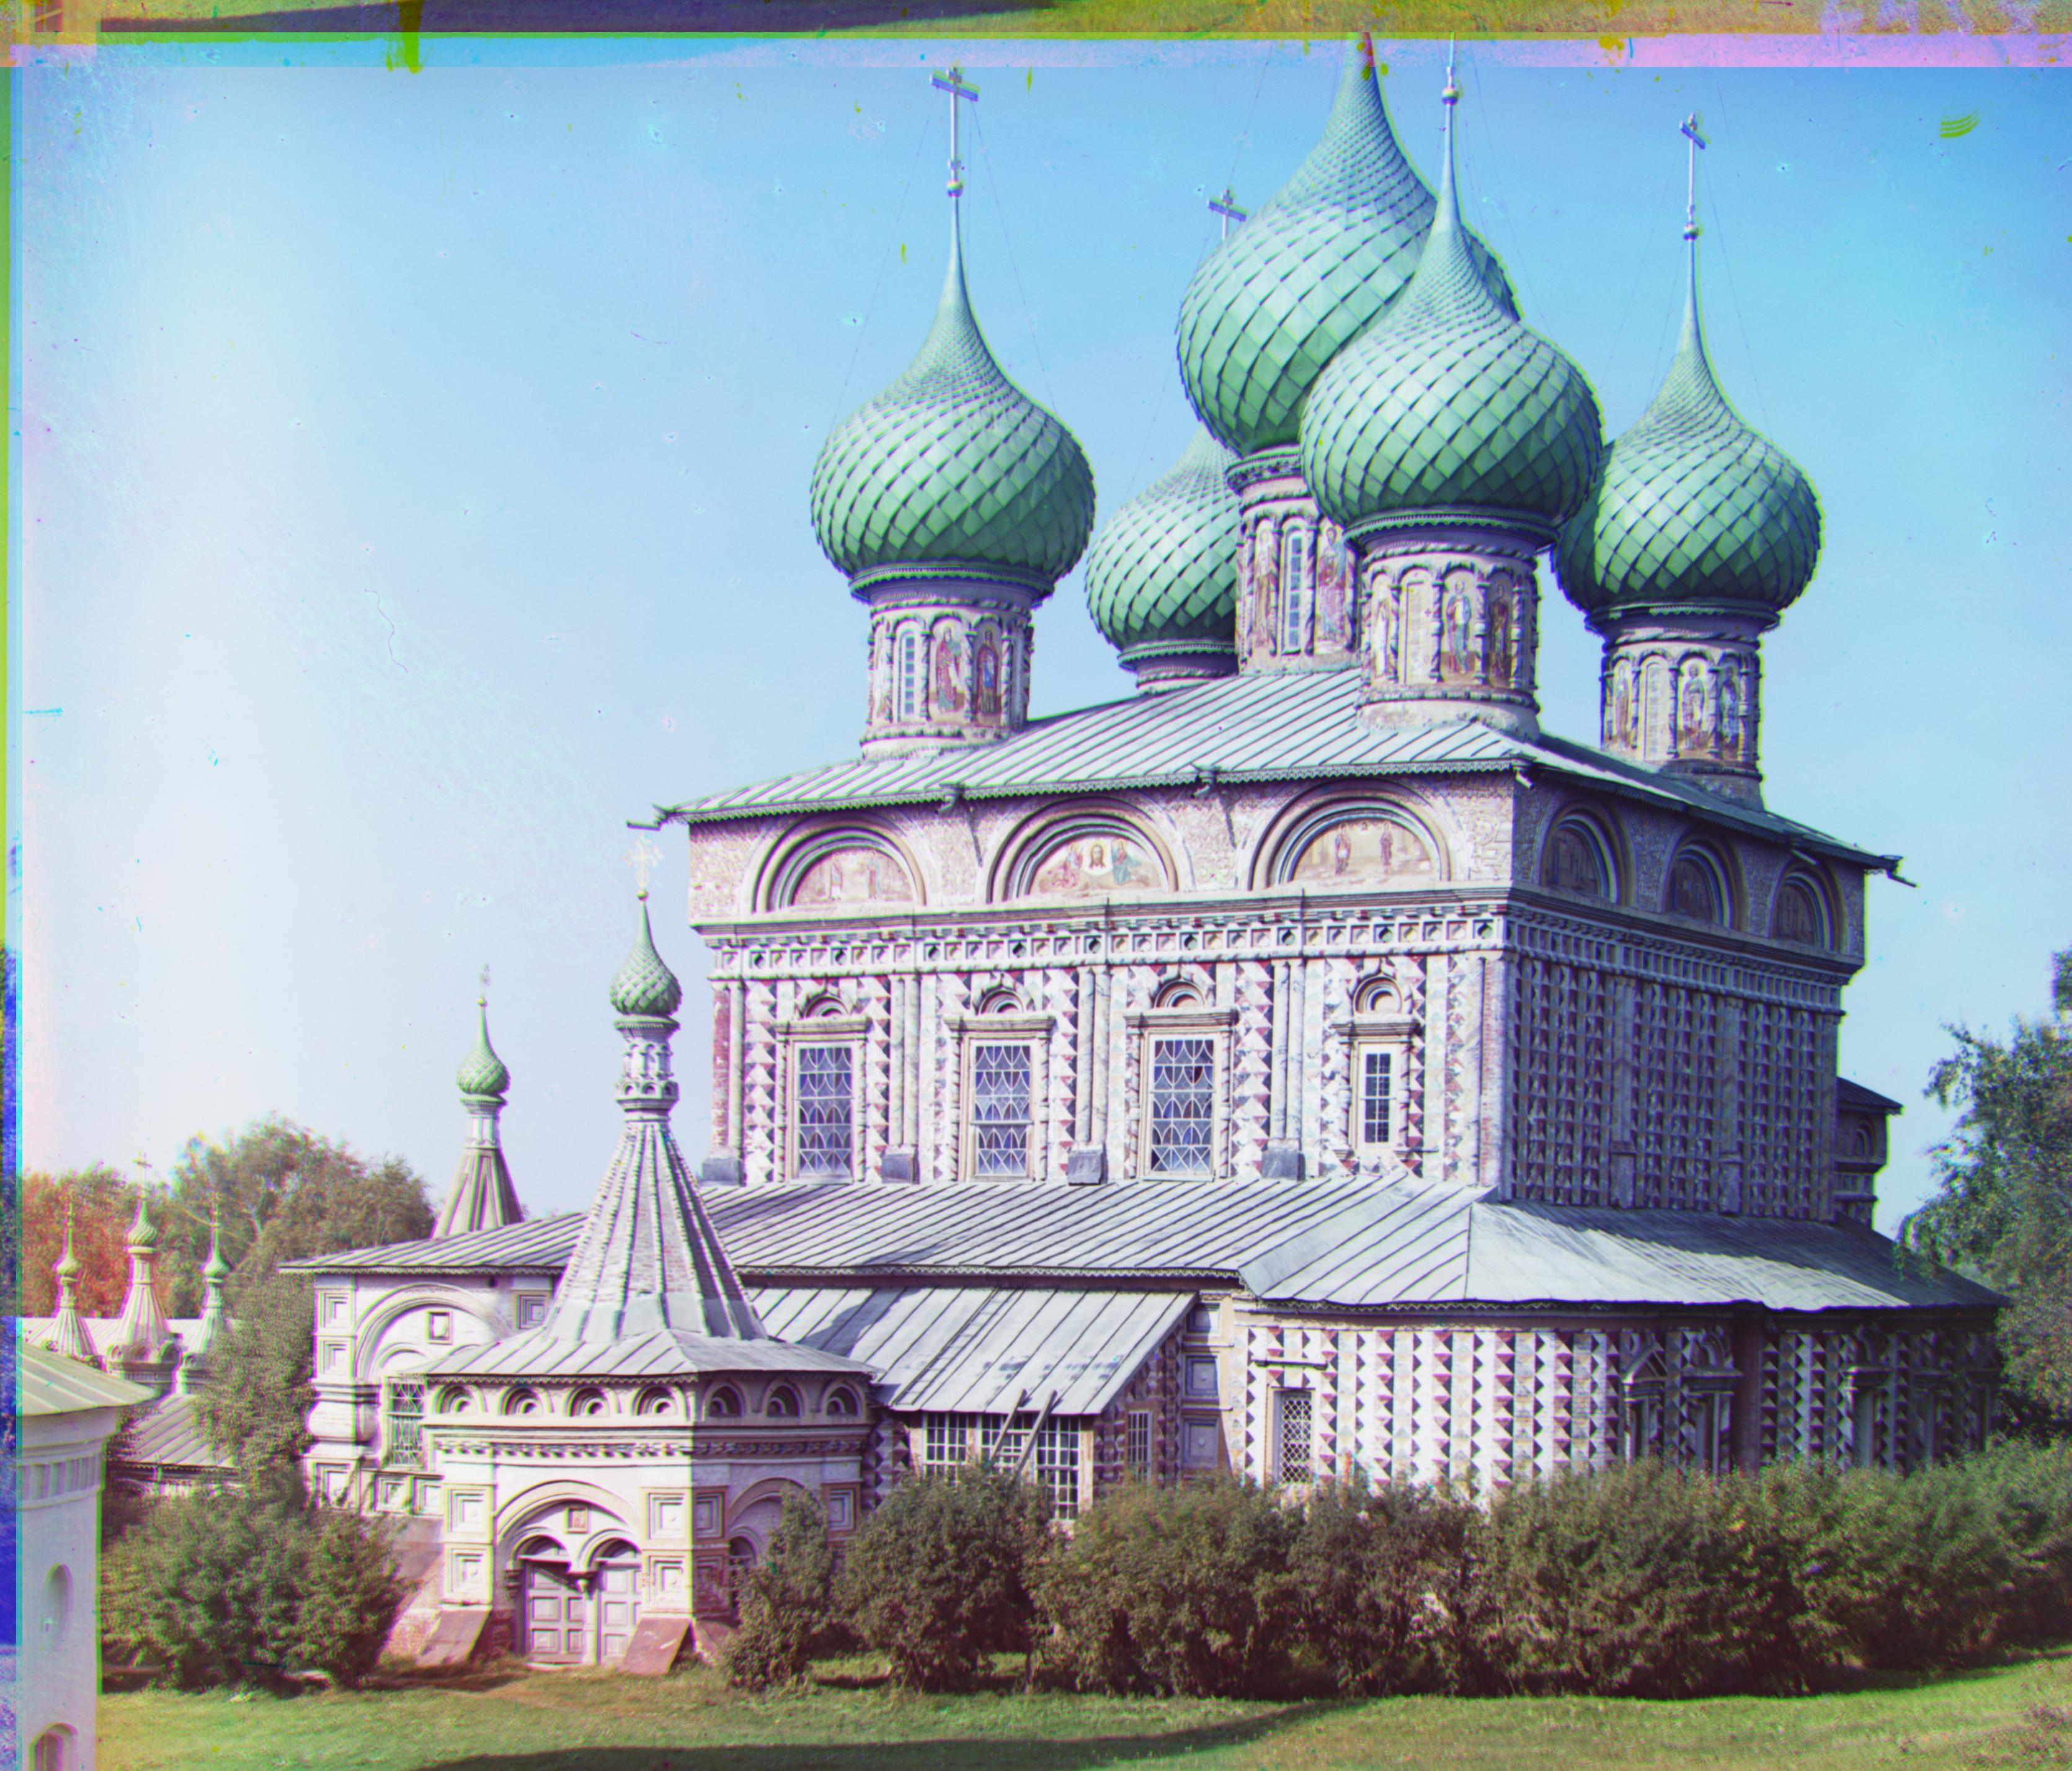 onion_church.jpg
r:[26, 52], g:[36, 108]
|
 self_portrait.jpg
r:[28, 78], g:[0, 4]
|
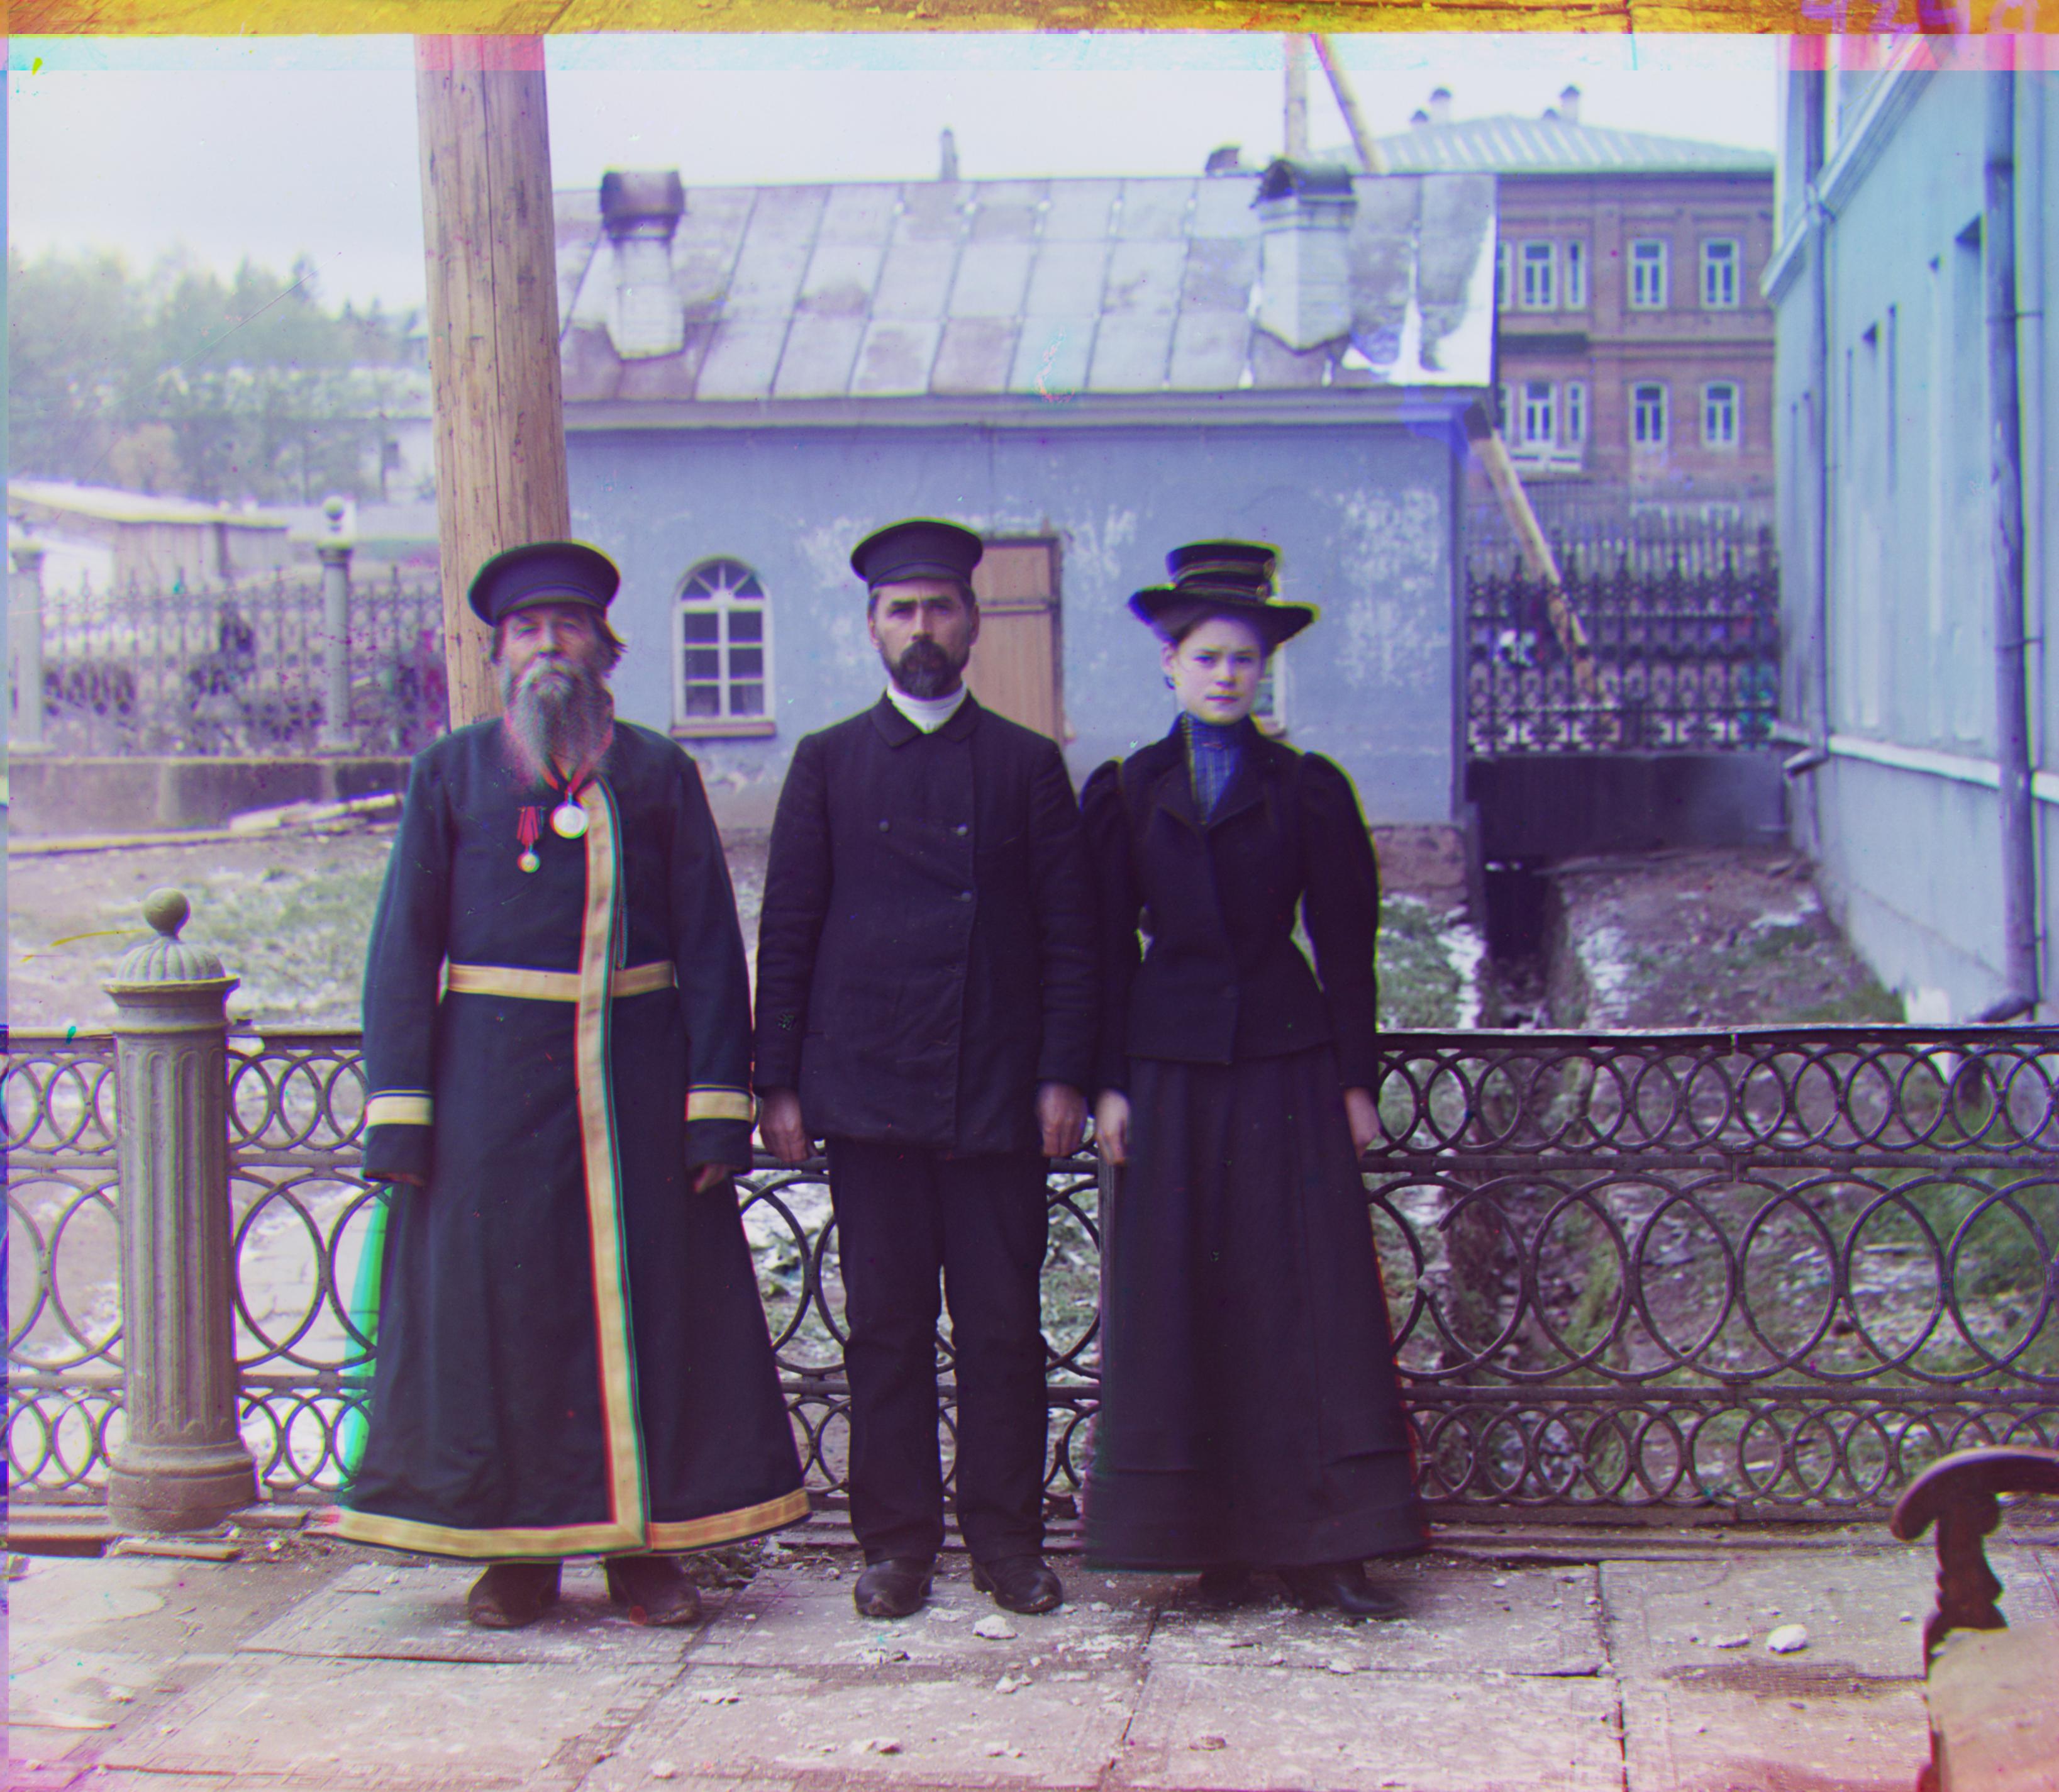 three_generations.jpg
r:[14, 54], g:[11, 112]
|
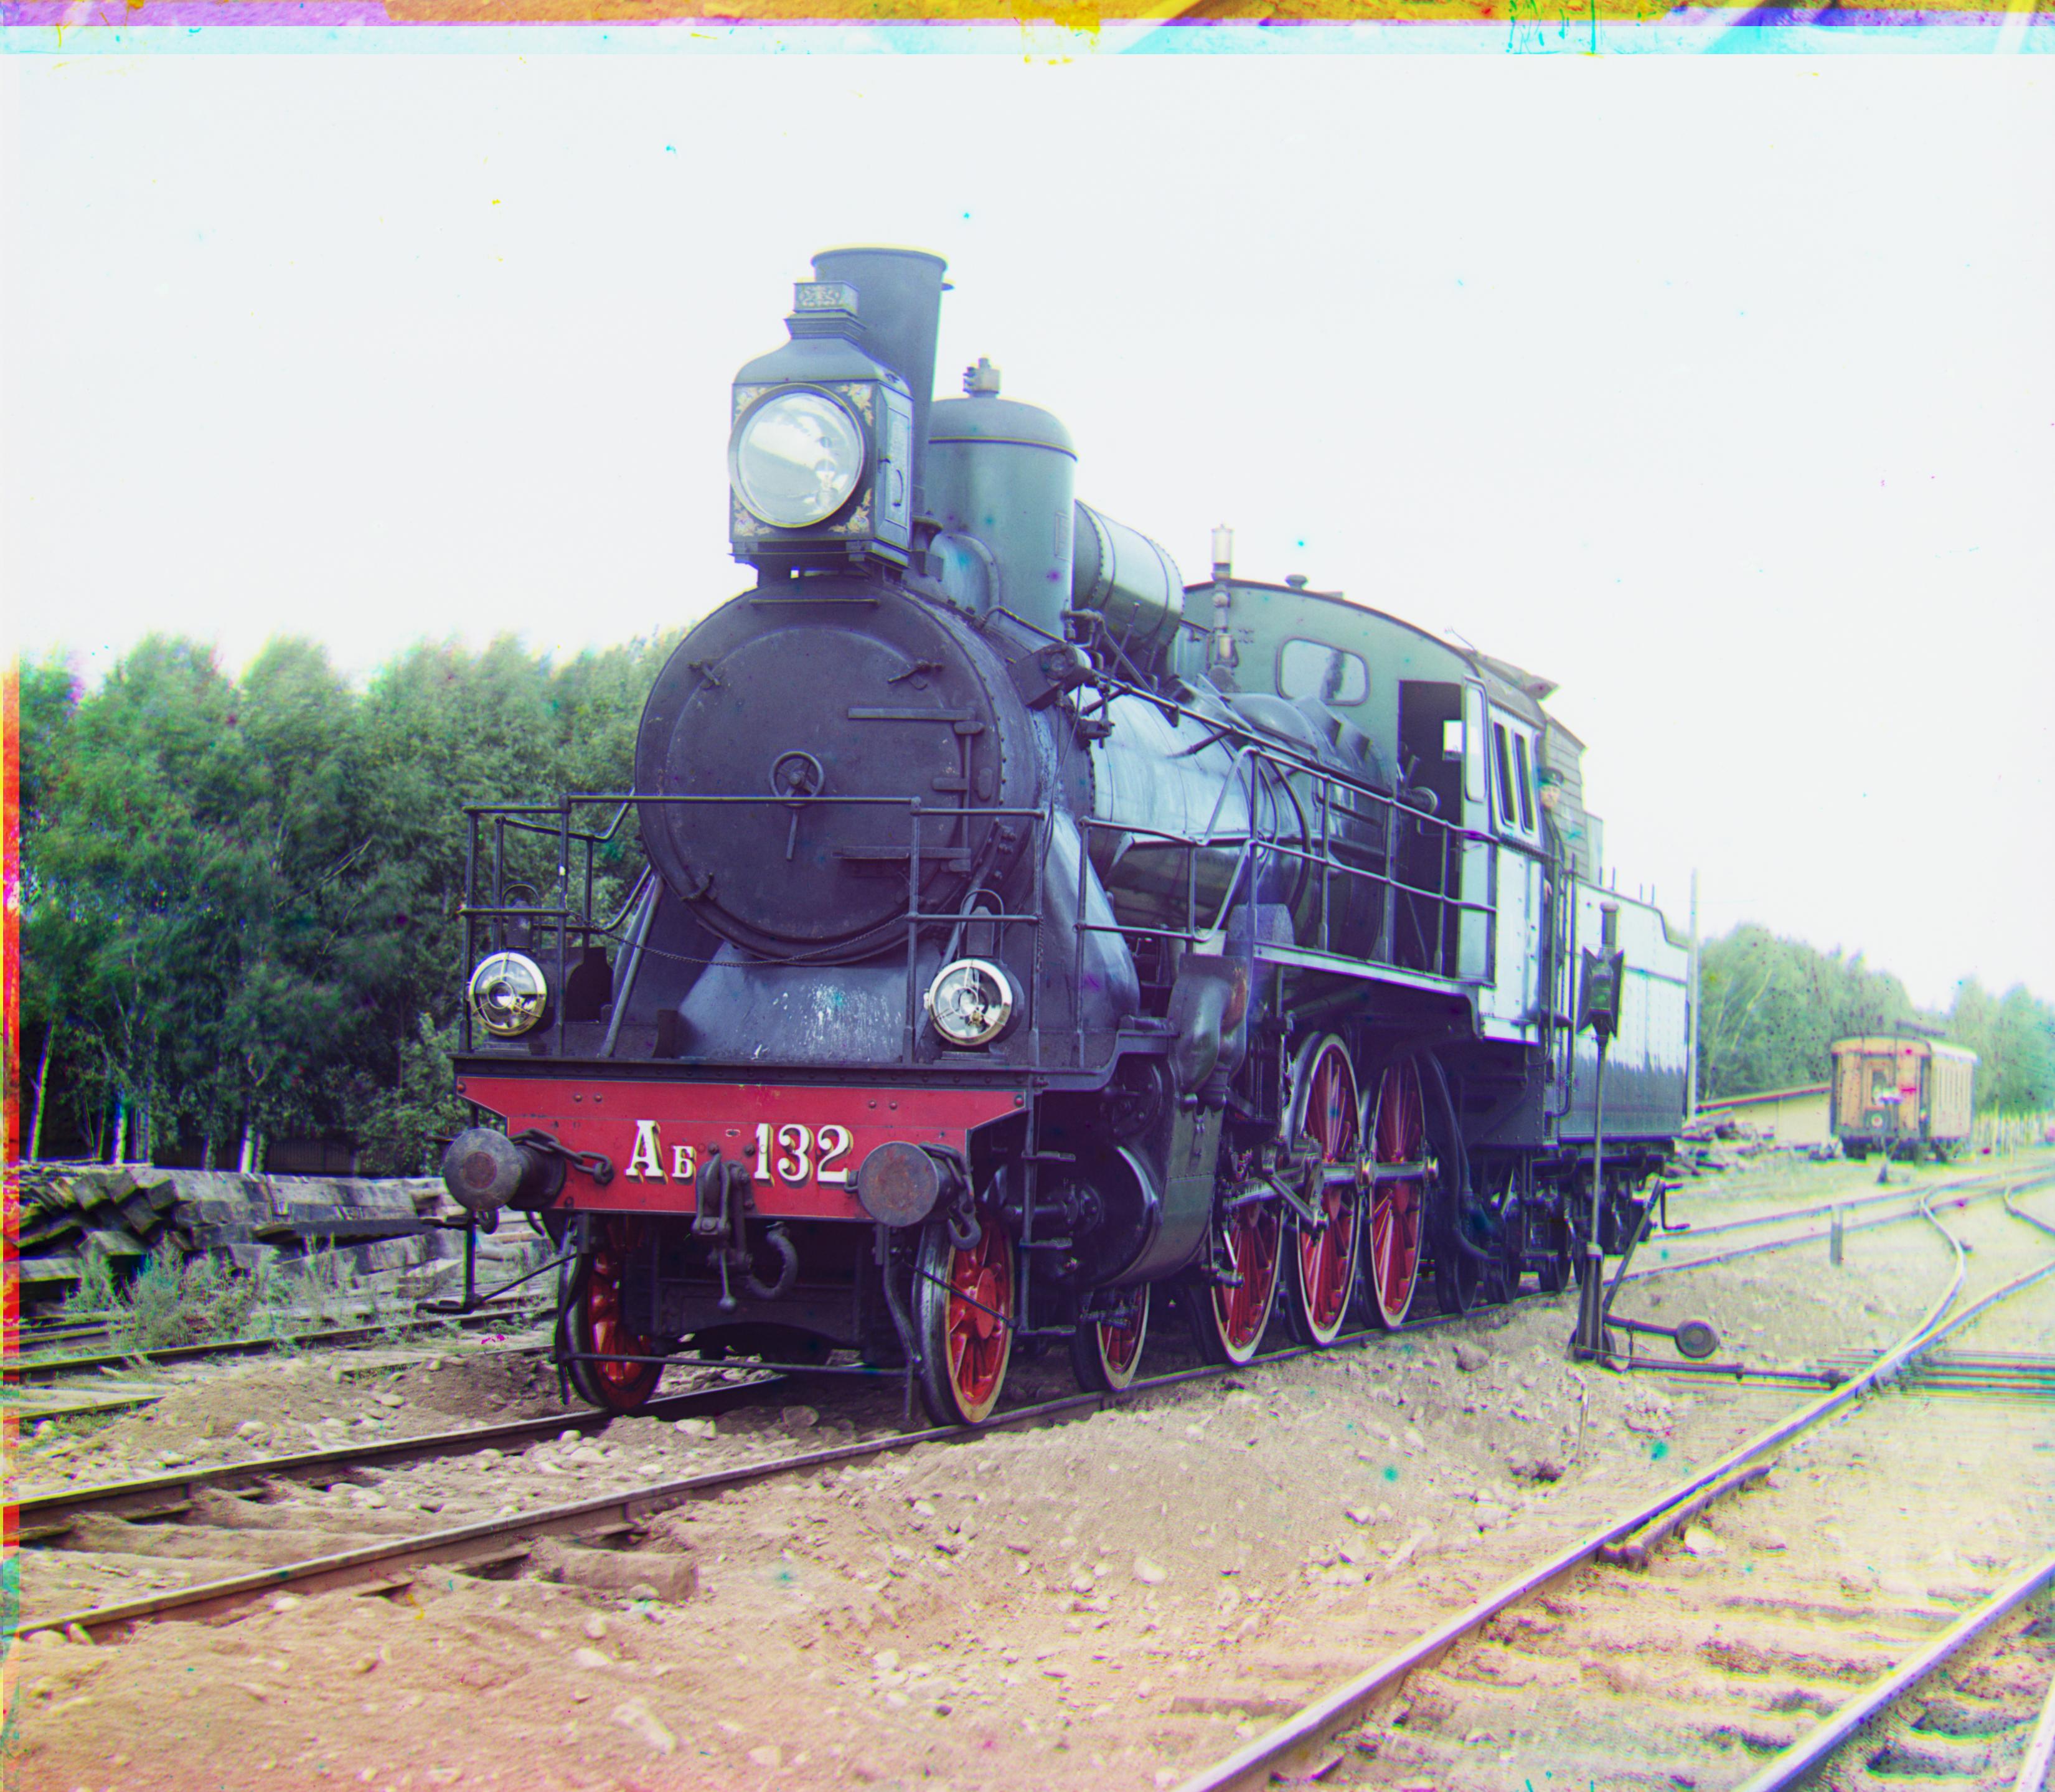 train.jpg
r:[5, 42], g:[31, 87]
|
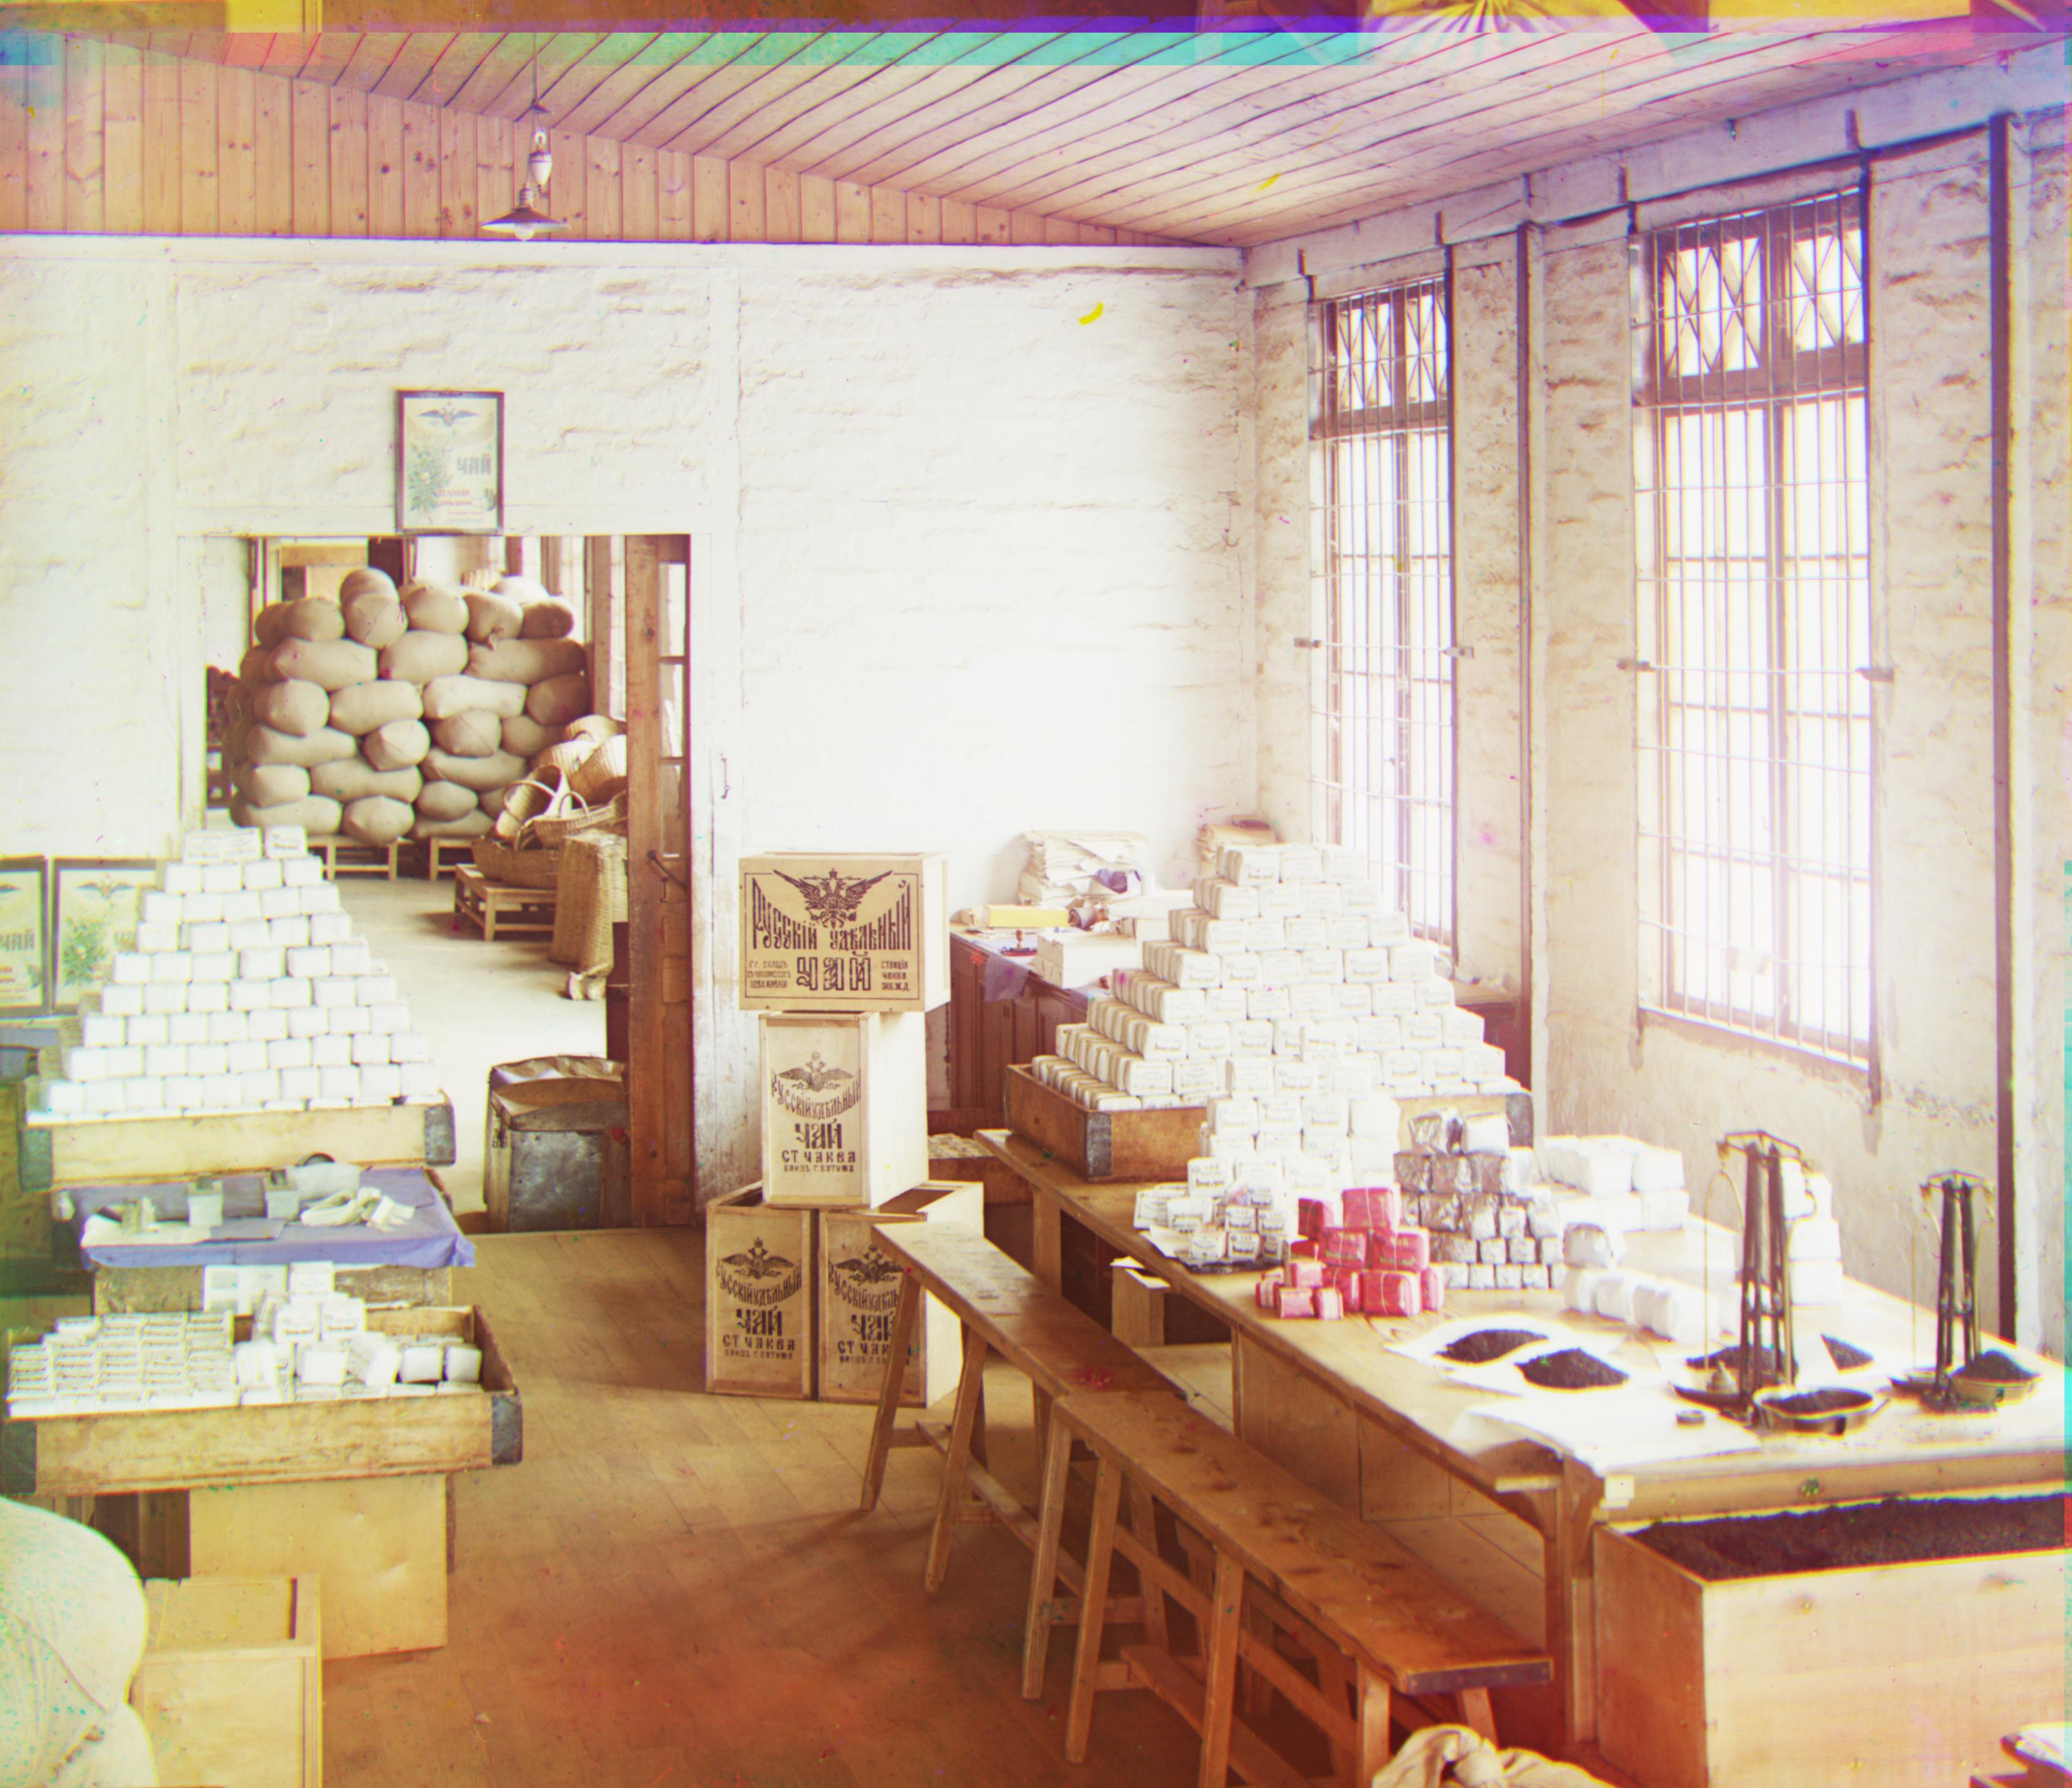 workshop.jpg
r:[0, 52], g:[-12, 104]
|
Miscellaneous:
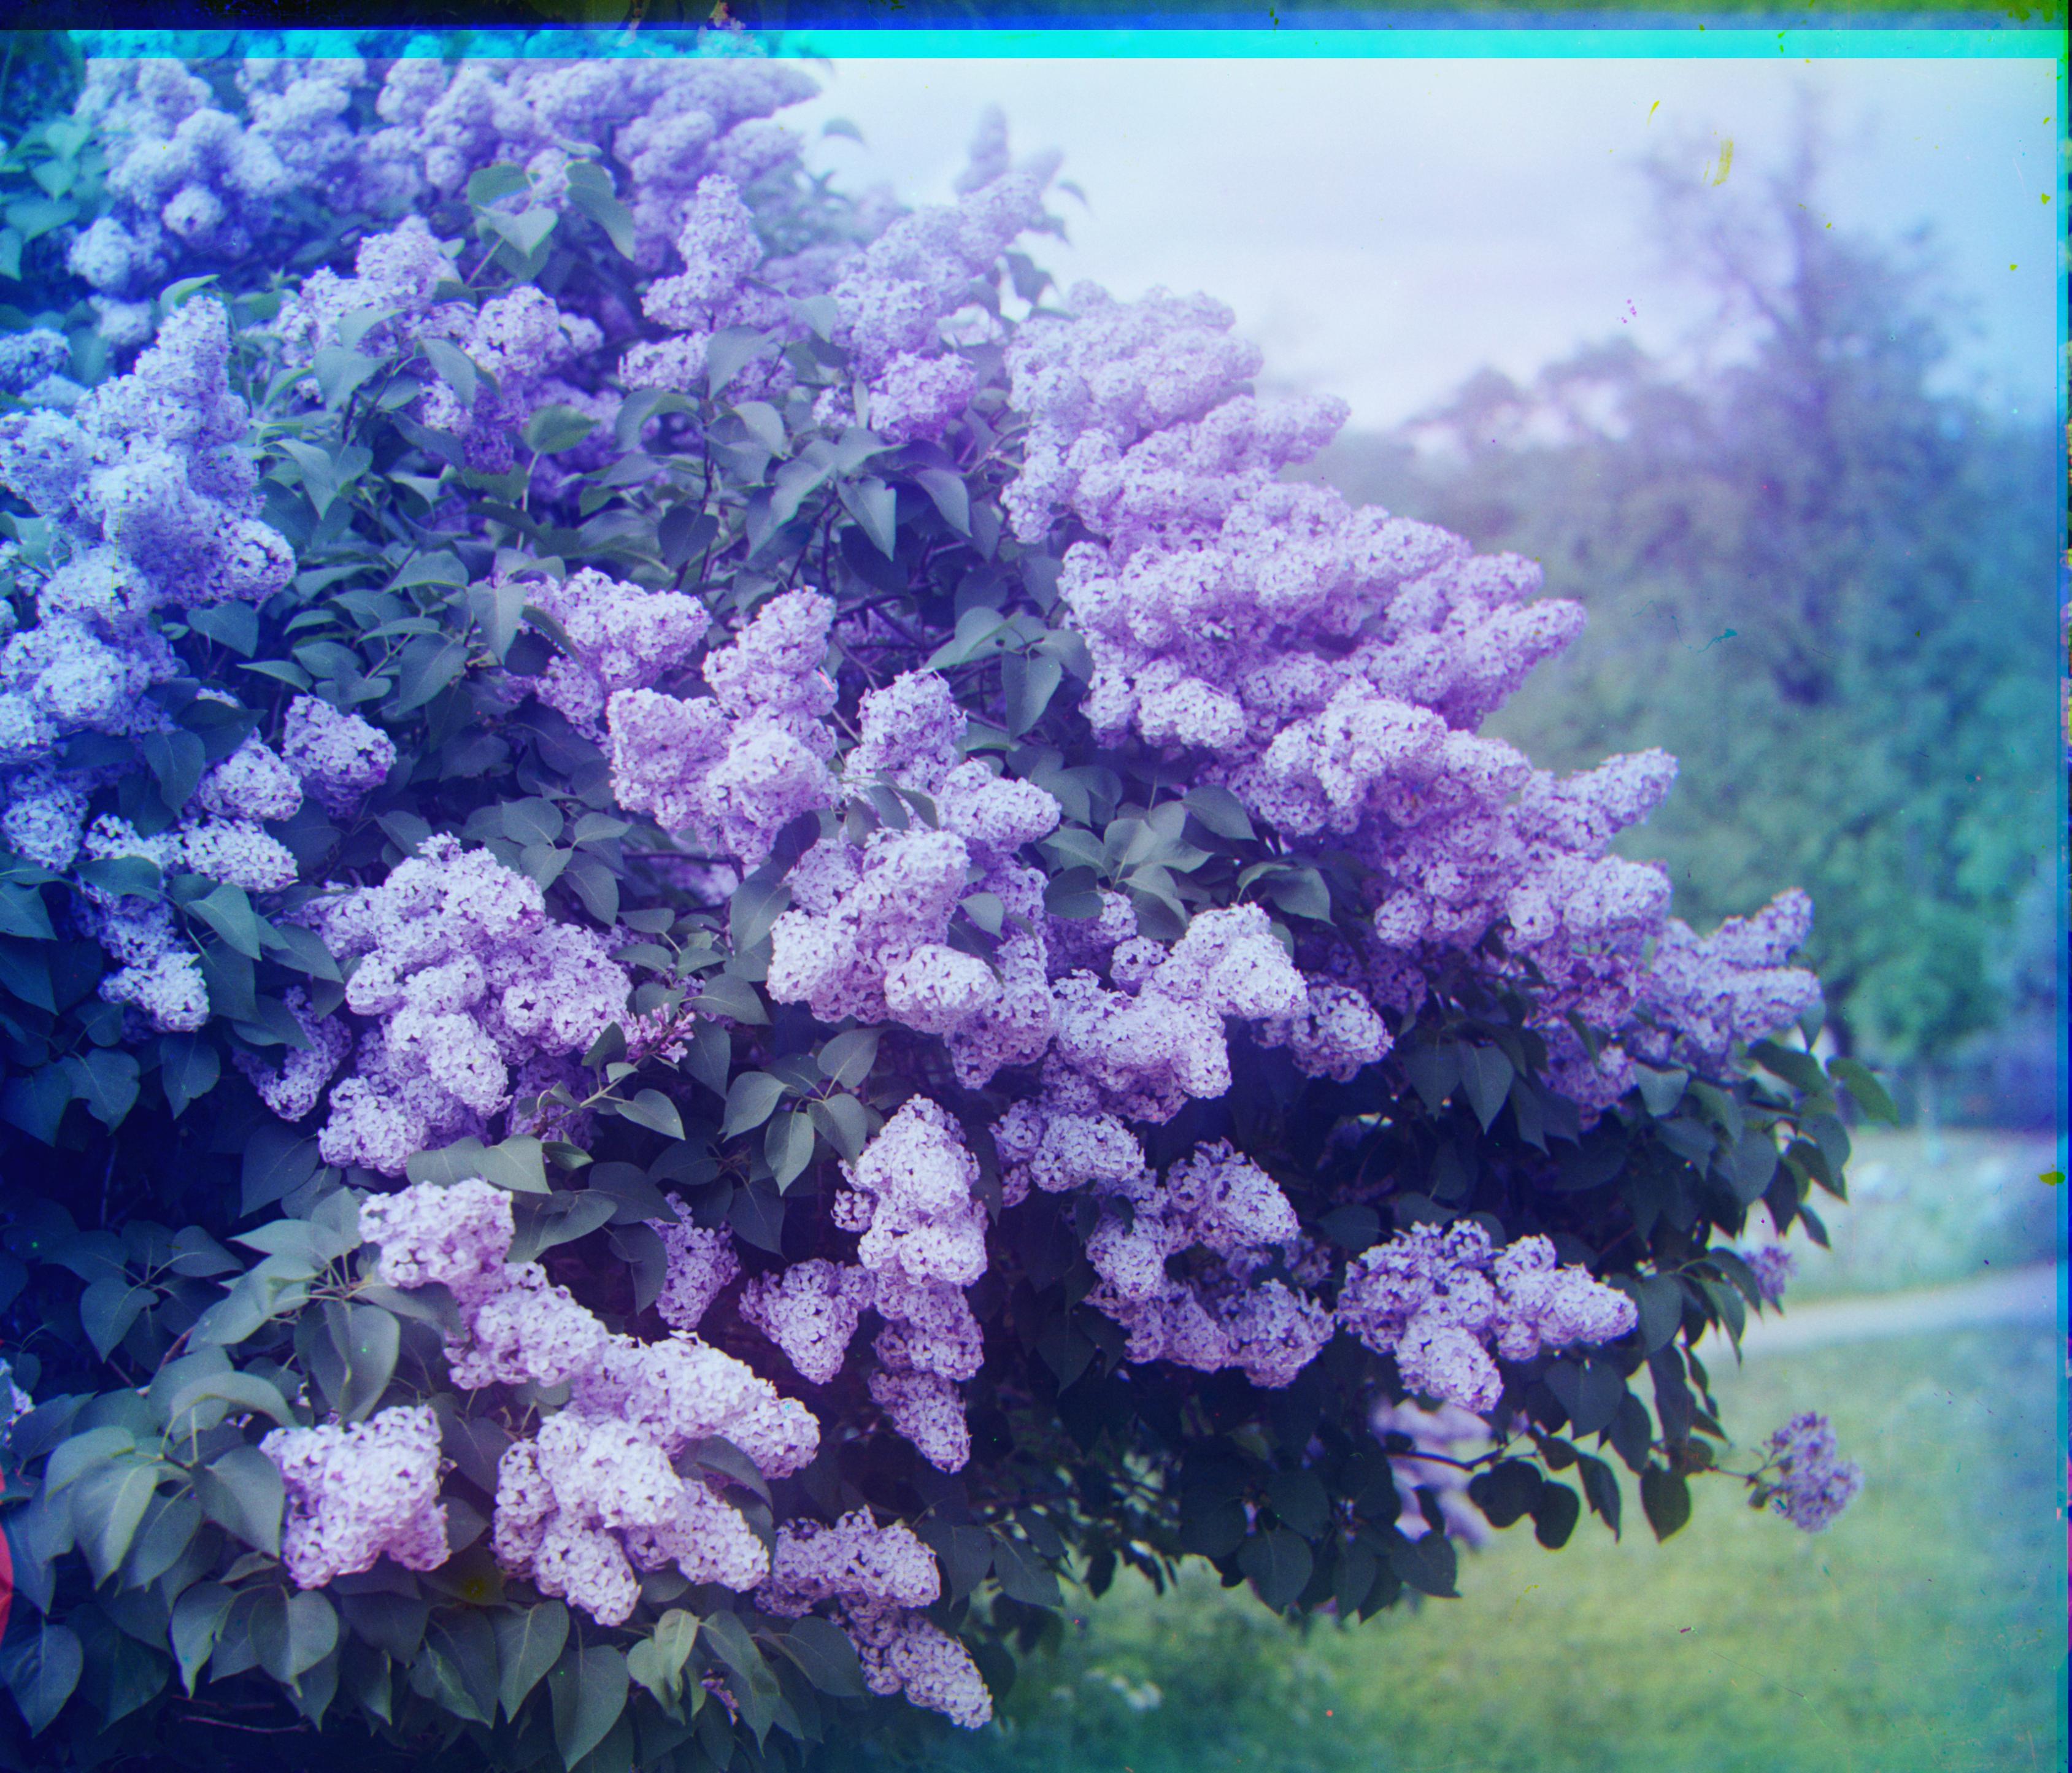 lavender.jpg
r:[-6, 49], g:[-25, 95]
|
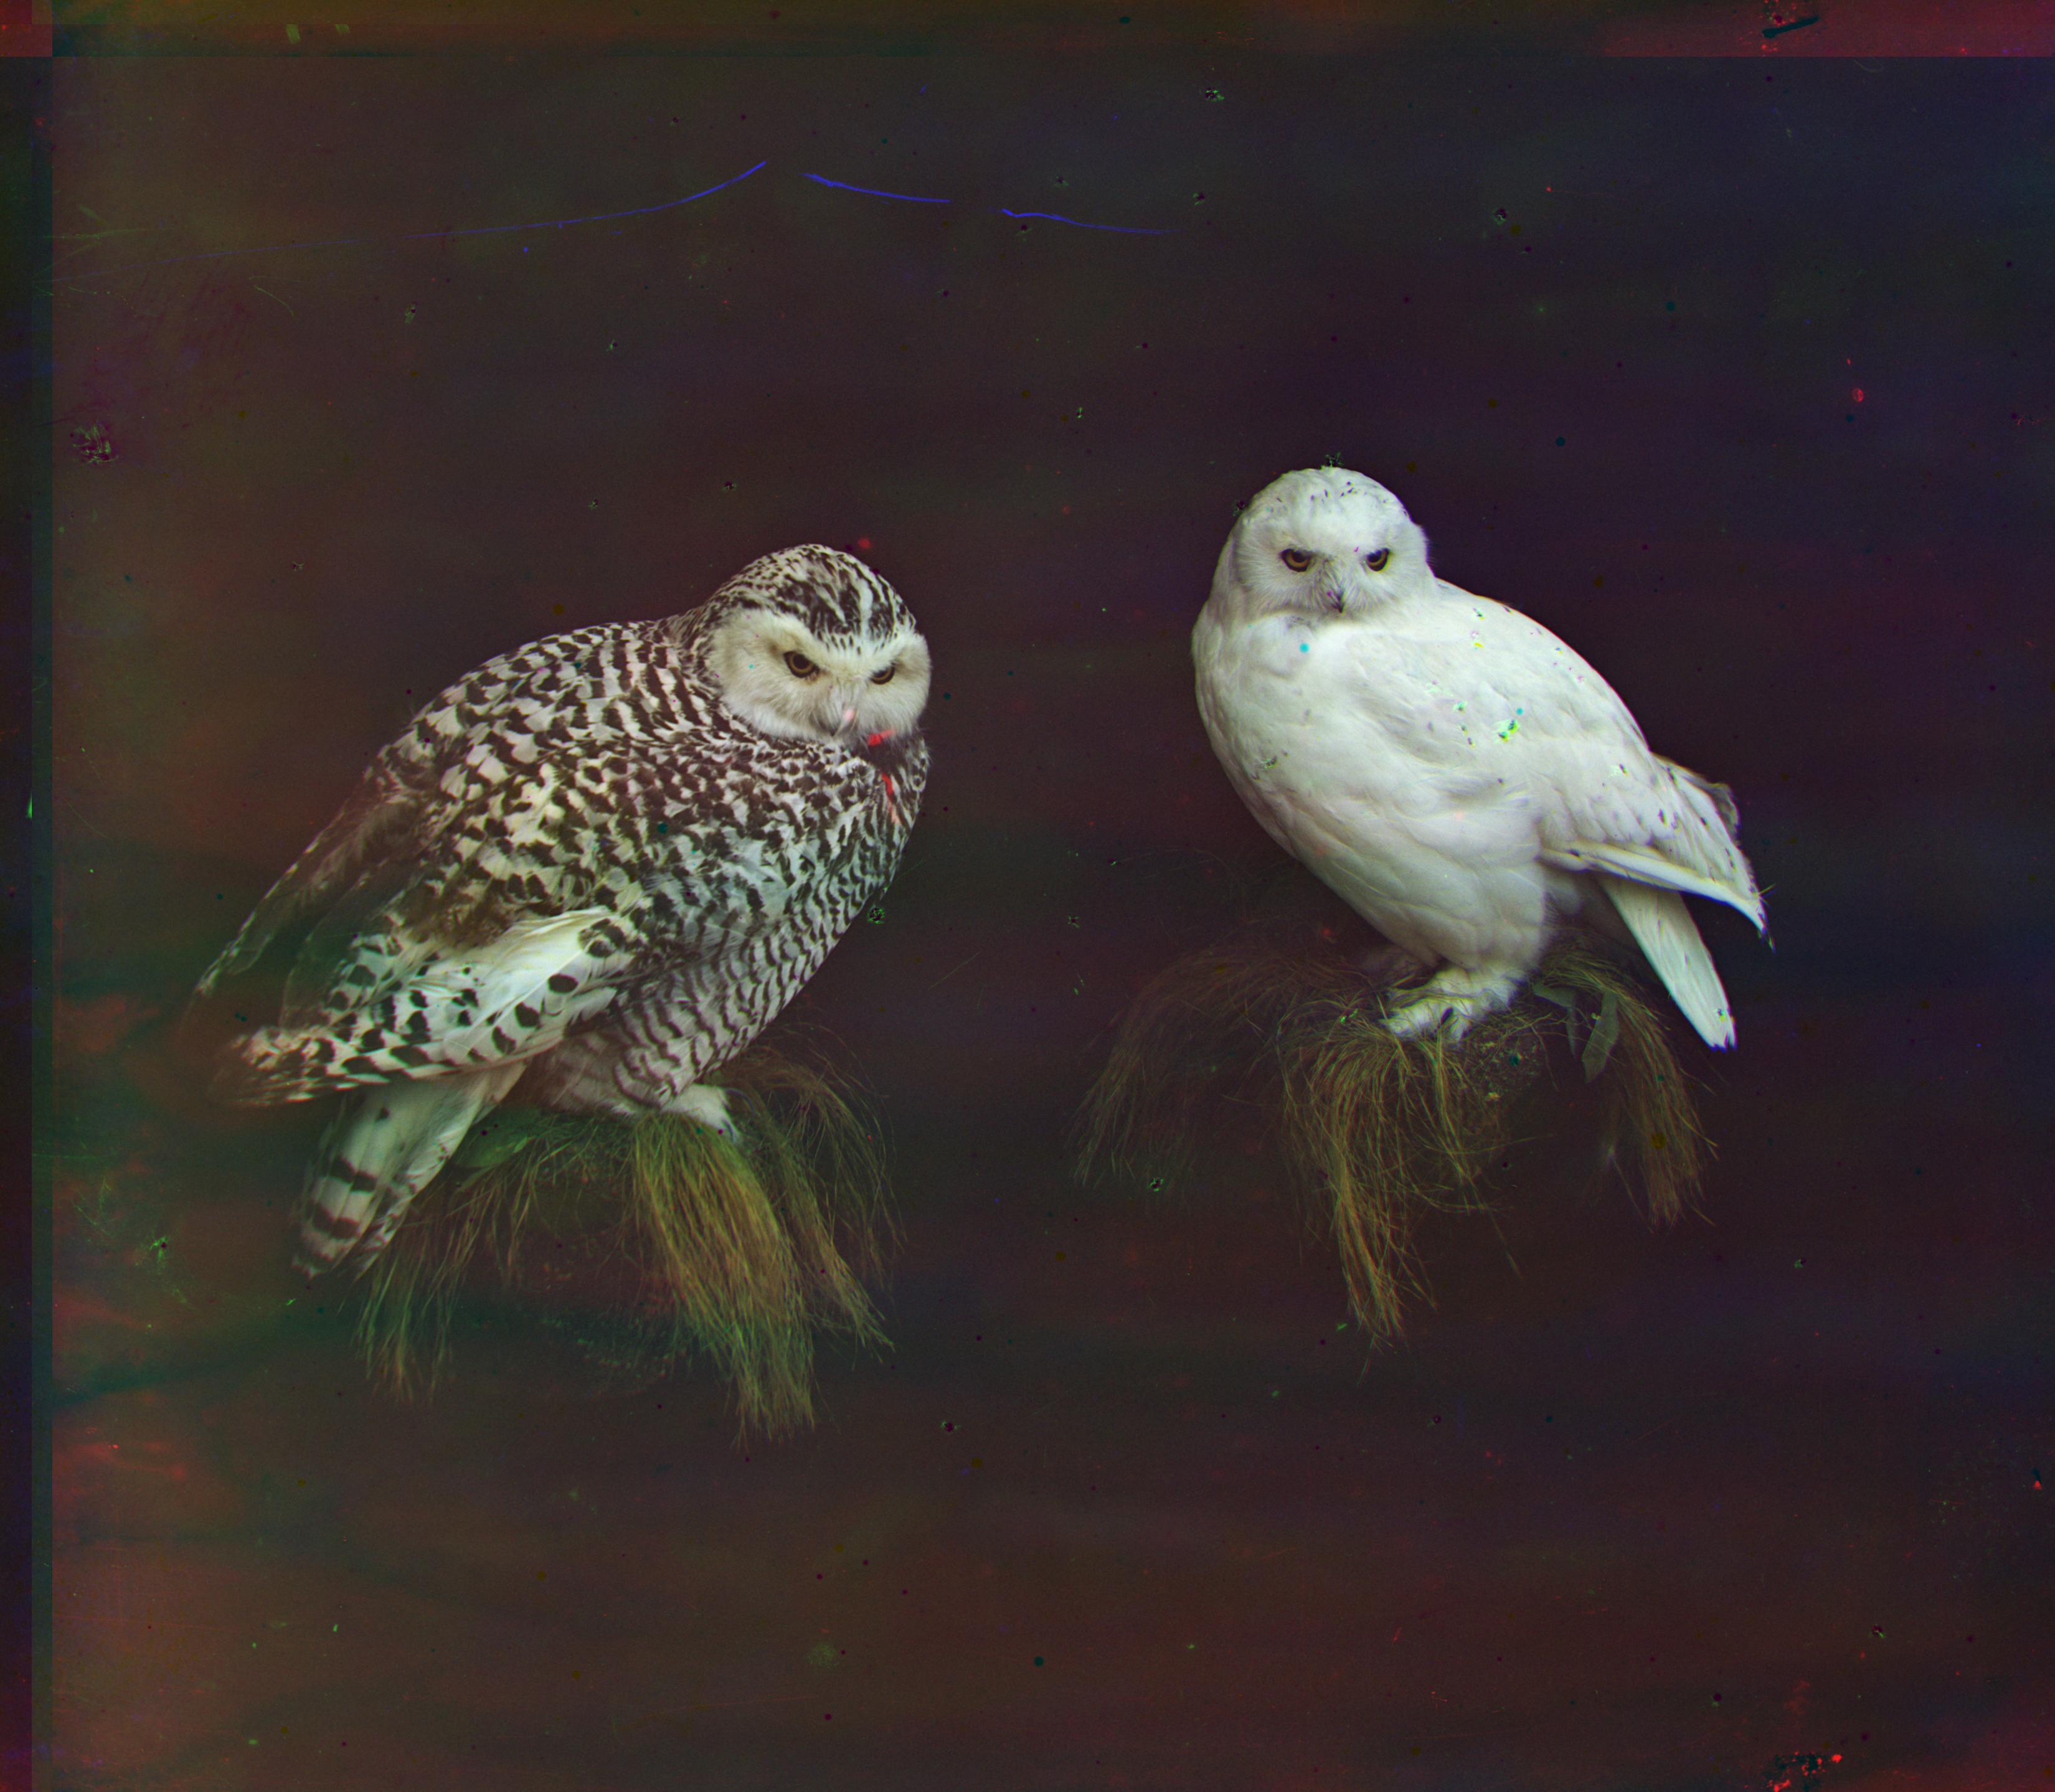 owls.jpg
r:[51, 39] g:[84, 91]
|
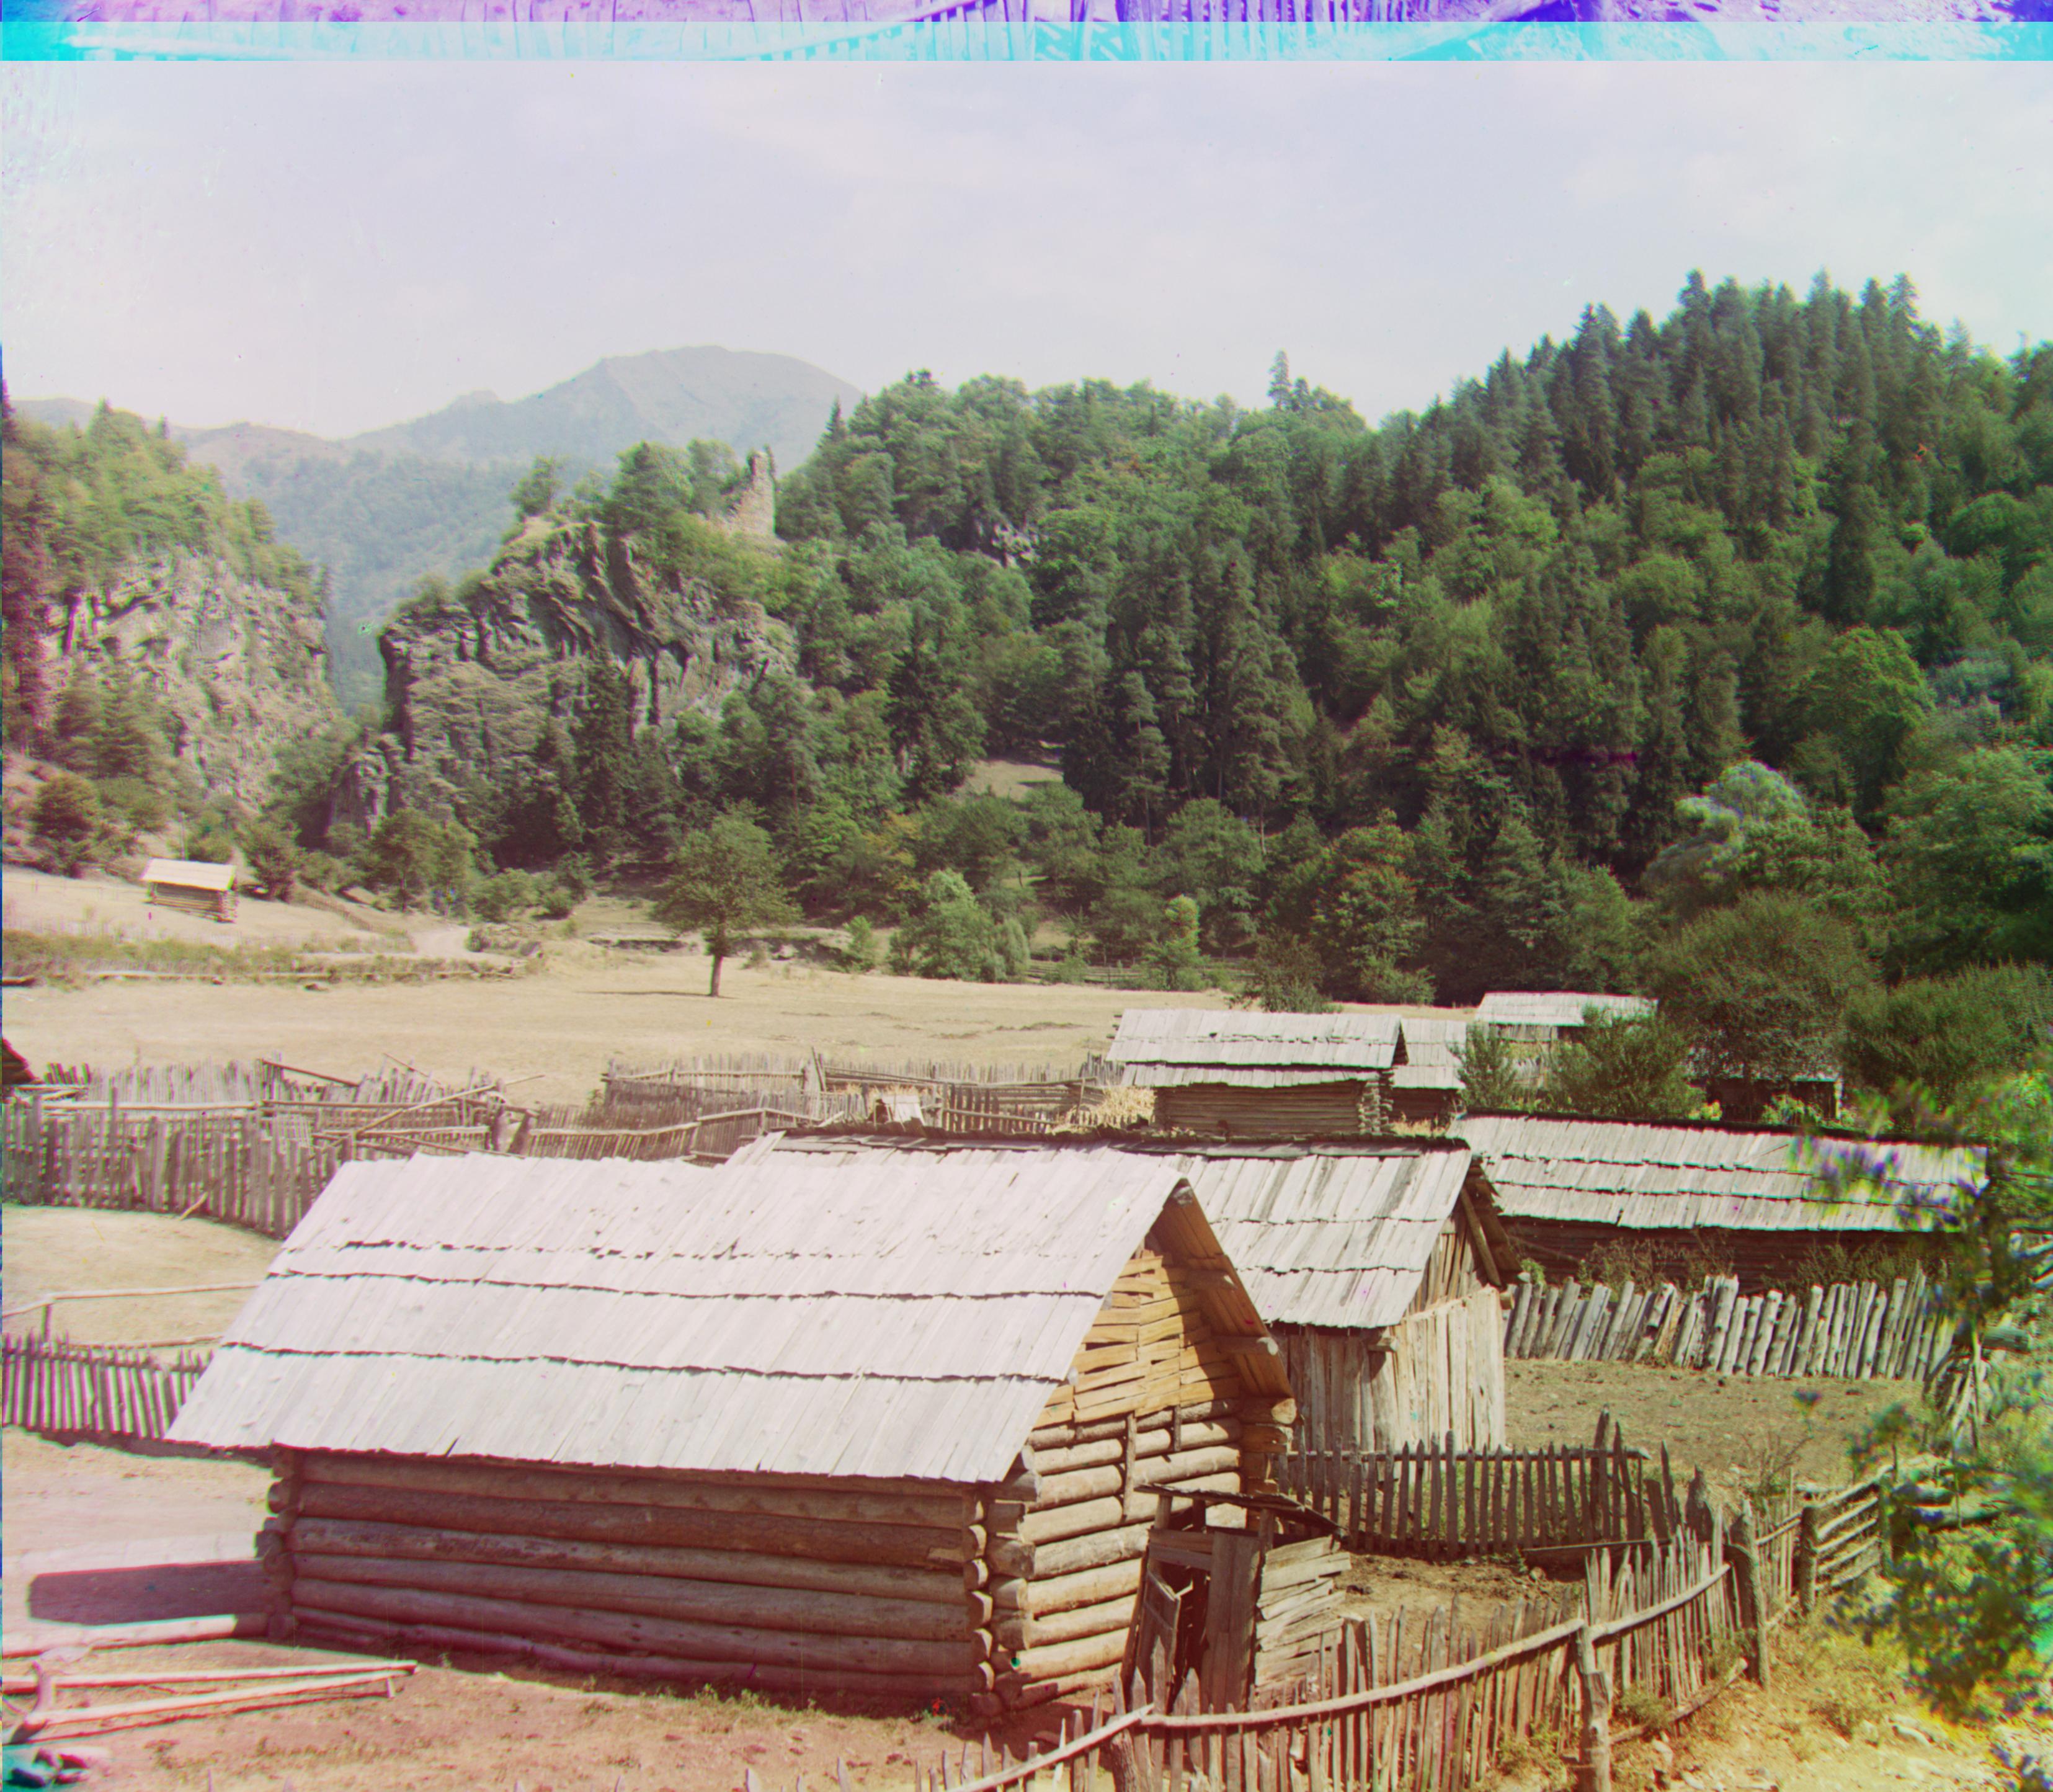
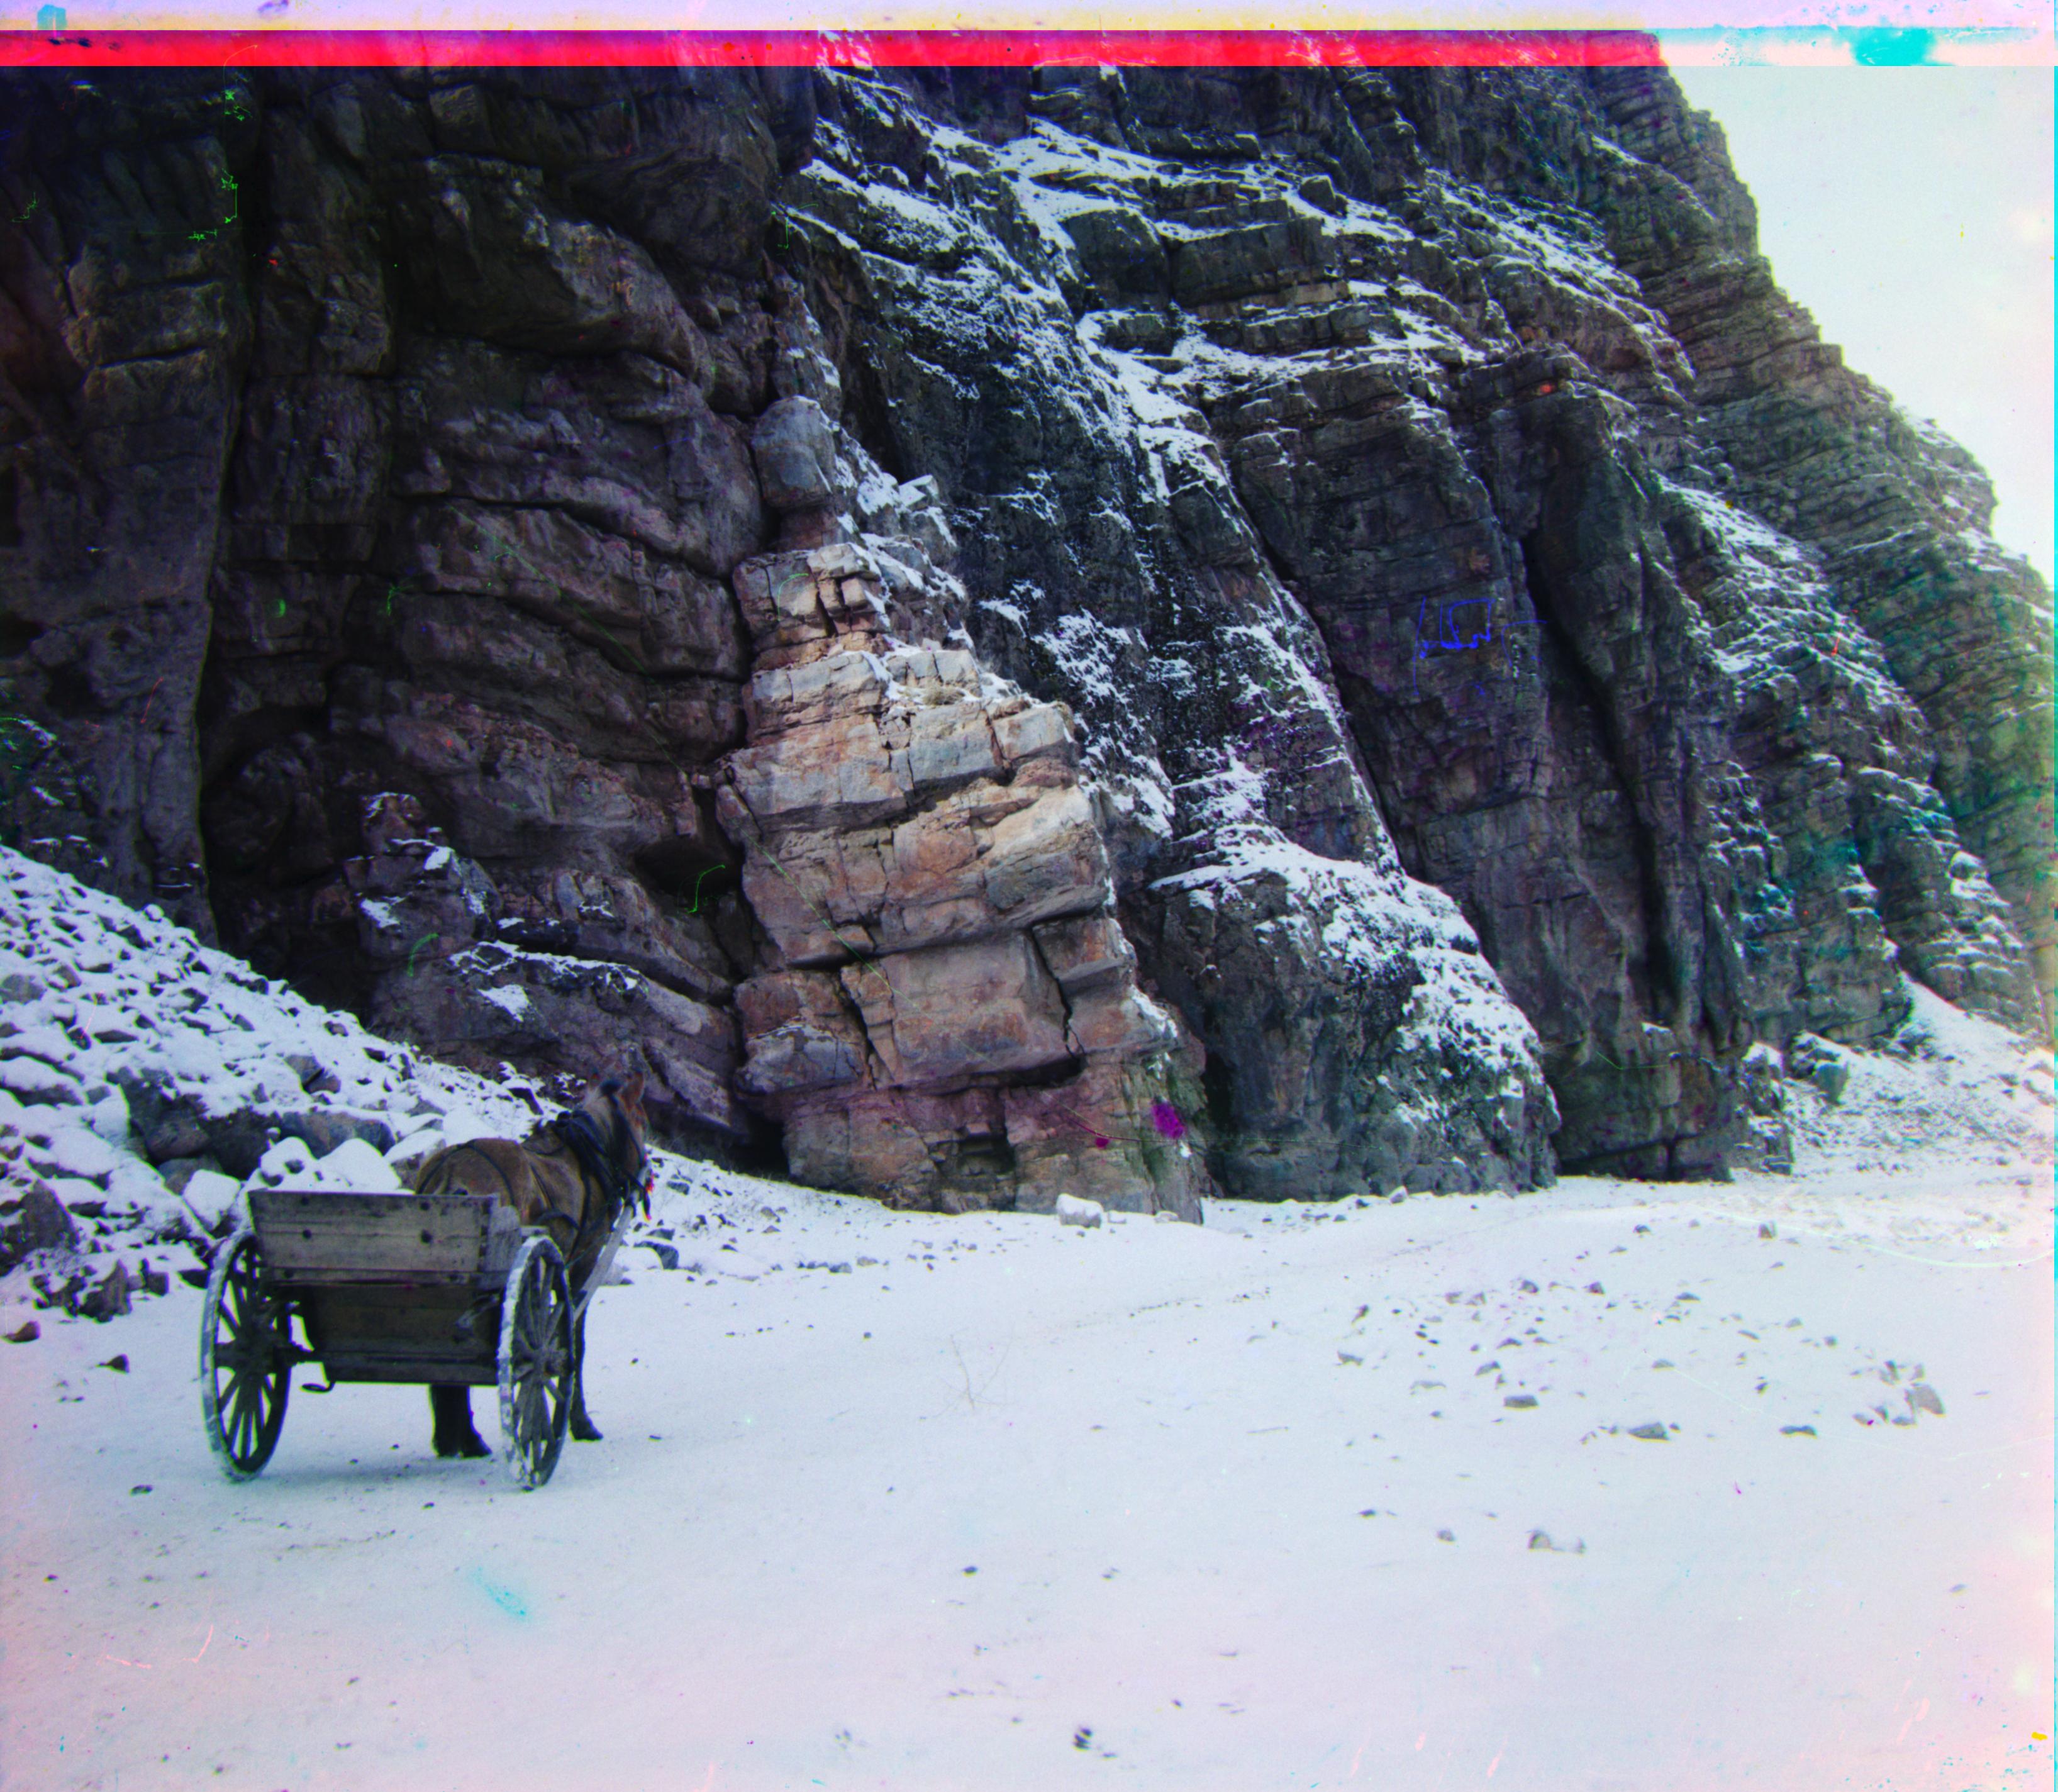 snowy_cliff.jpg
r:[0, 48], g:[-6, 105]
|
 snowy_hut.jpg
r:[16, 10], g:[32, 90]
|
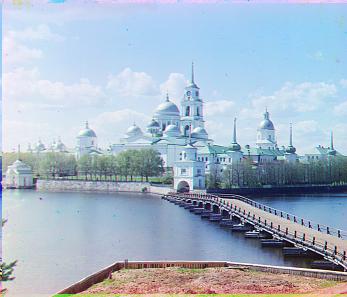
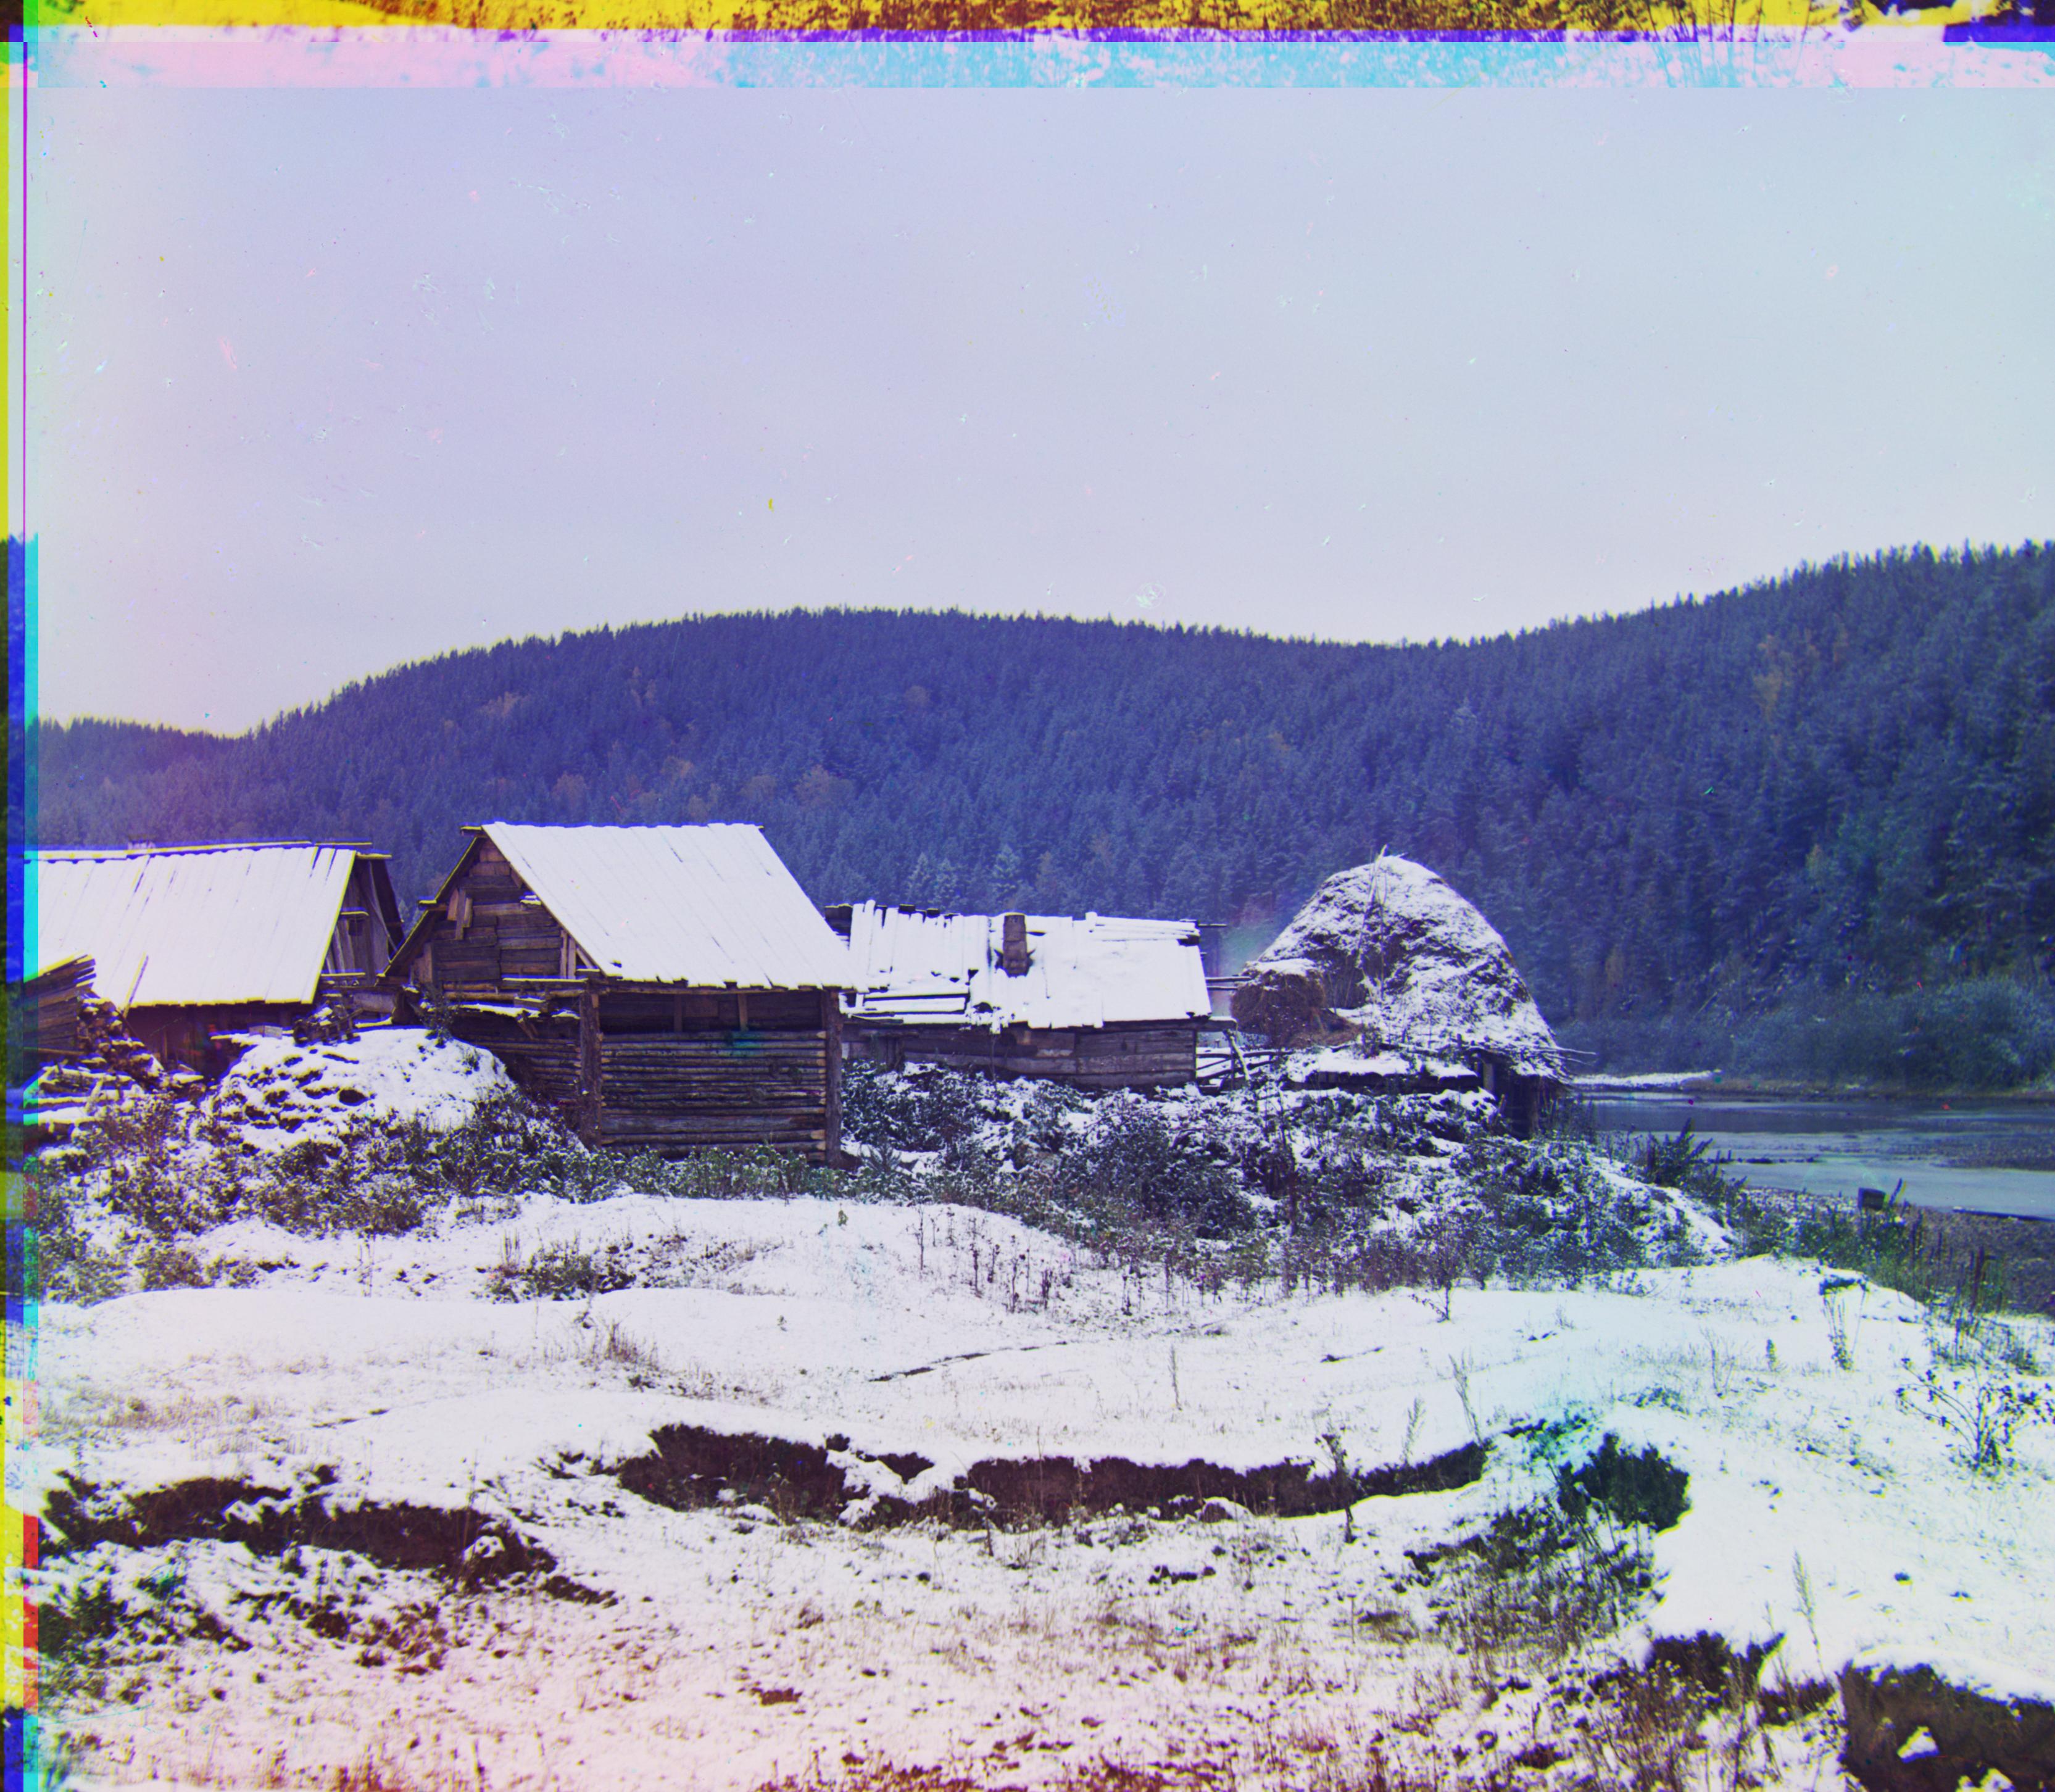
snowy_riverside.jpg
r:[35, 39] g:[54, 88]
|
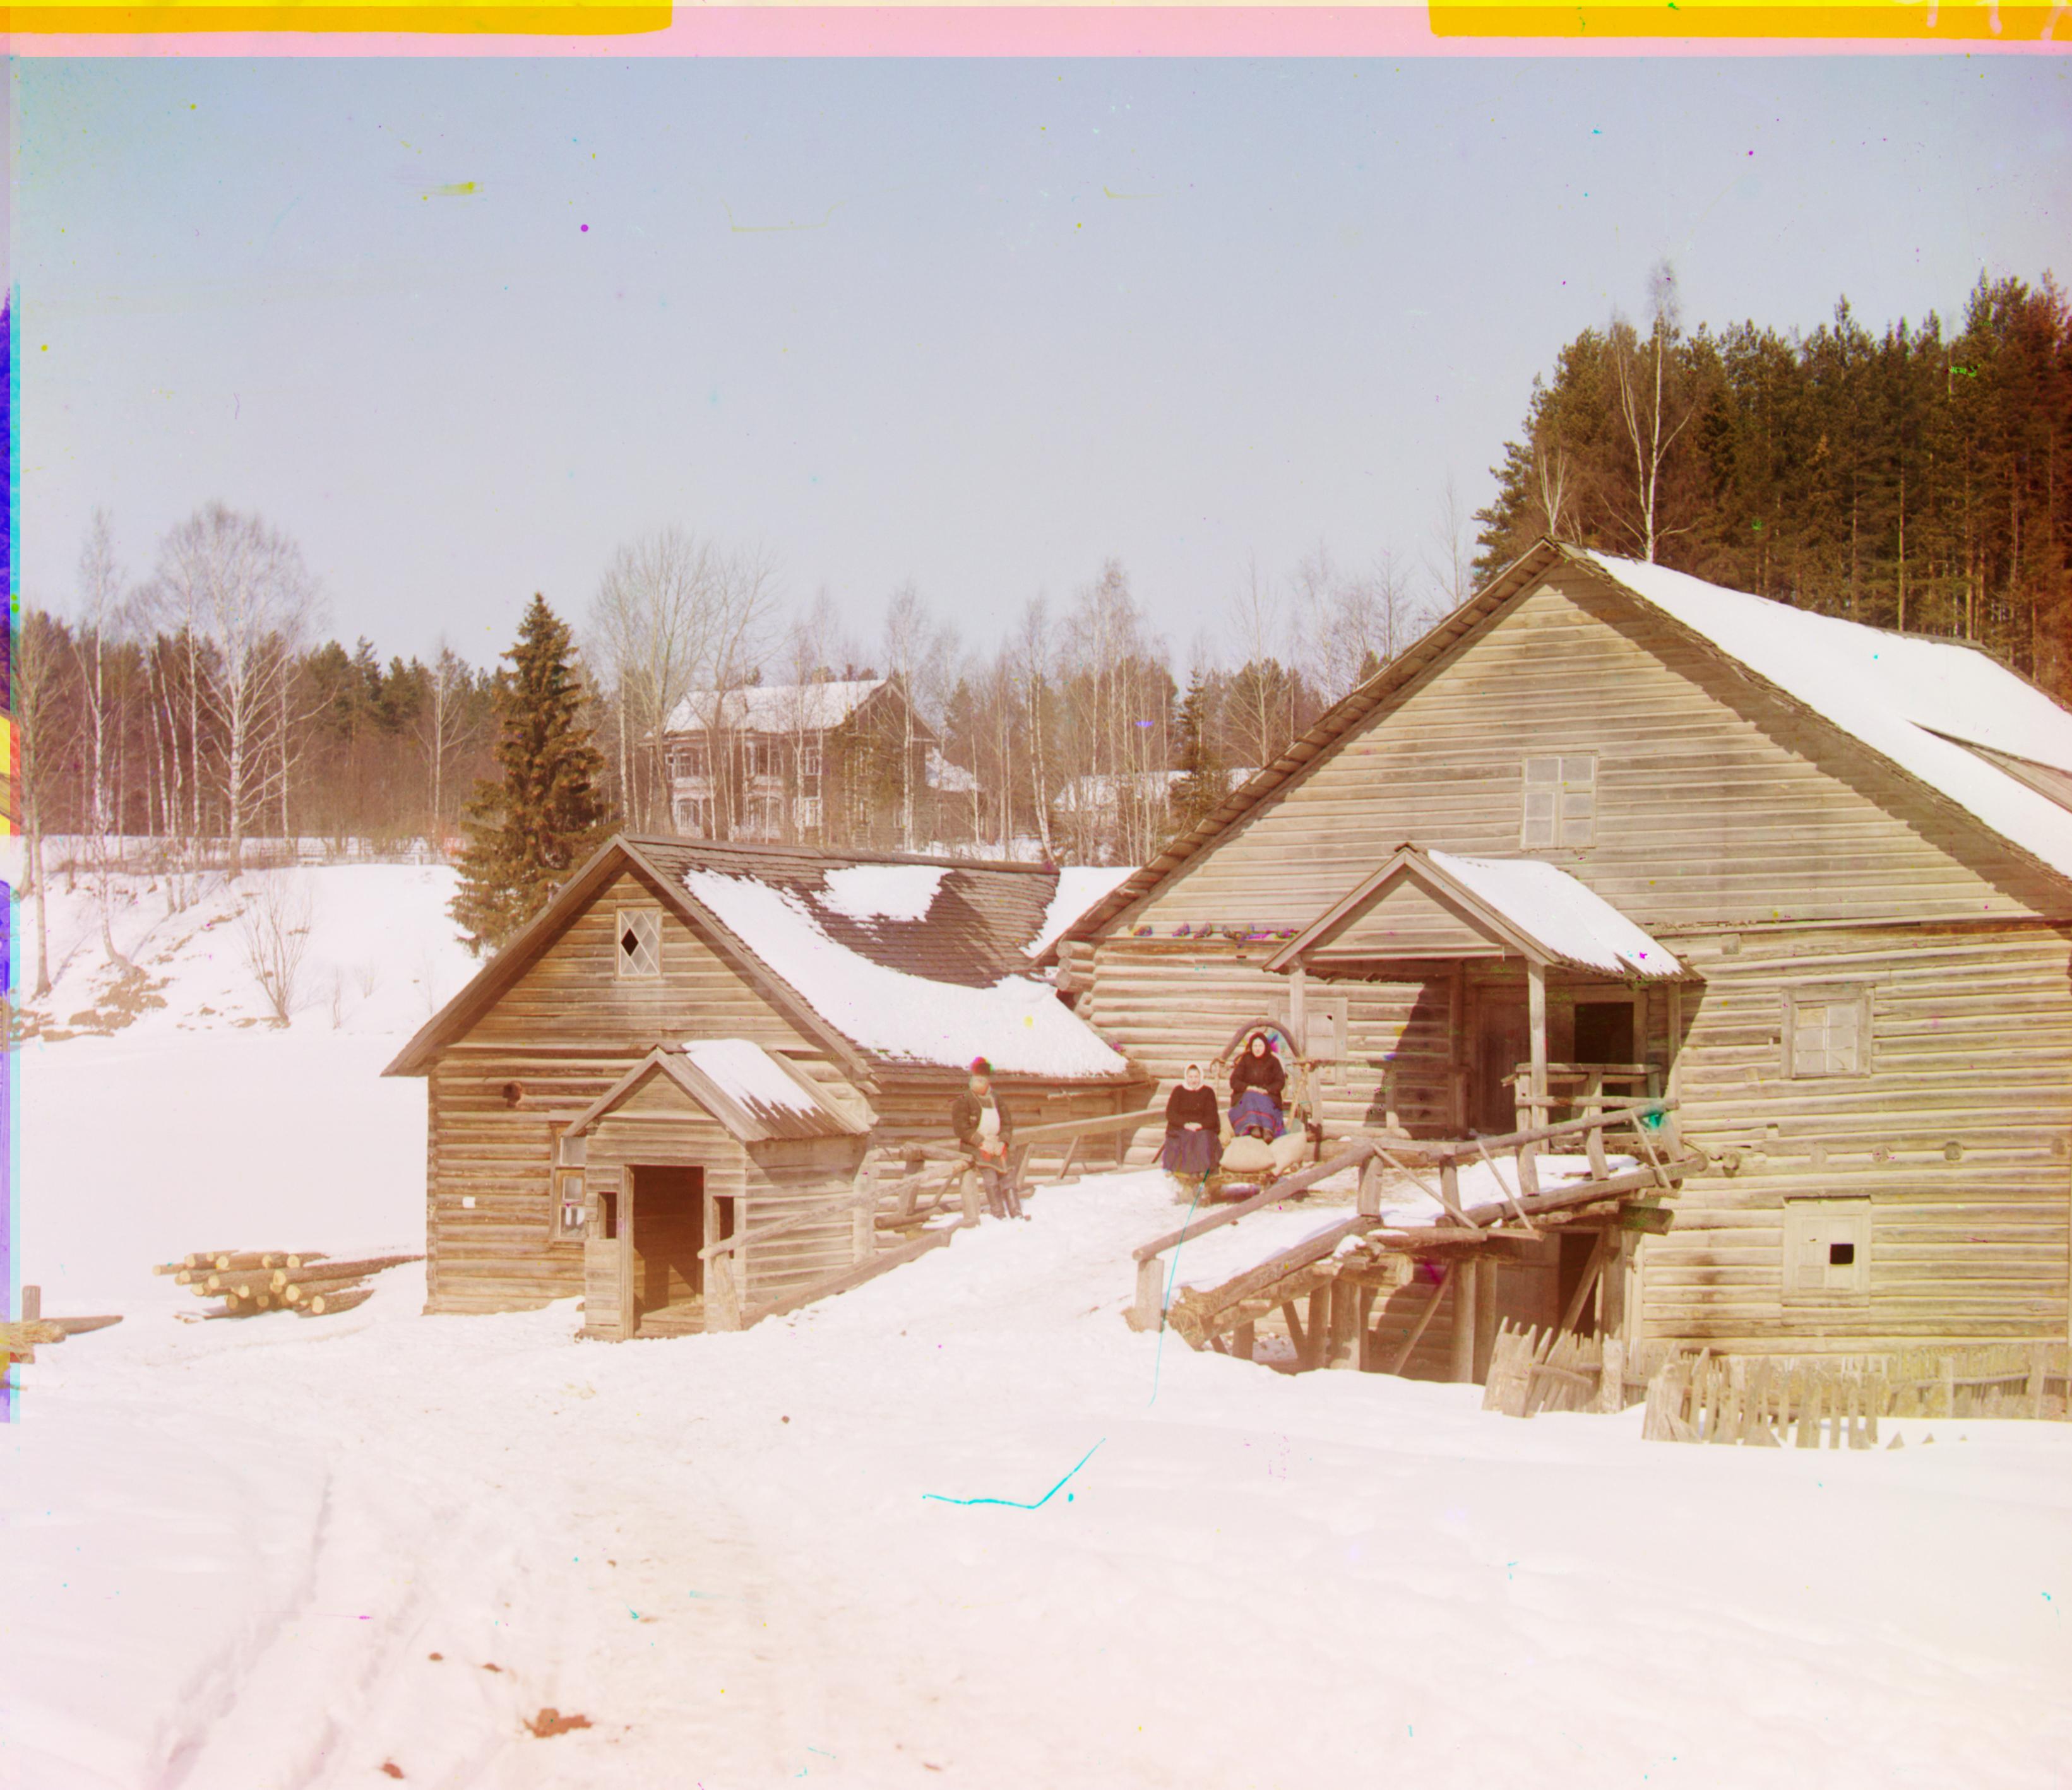
 snowy_village.jpg
r:[38, 68] g:[62, 142]
|
Problems
So even though most of the images look nice and well colorized, two stand out as looking pretty wrong, emir.jpg, and self-portrait.jpg. Why is this? Emir.jpg looks all wonky because of inherent
faults in our metric. There's no normed brightness across the color negatives, which means unfortunately, the SSD metric becomes super biased towards the value of the brightest channel. An analogous
situation is to think why we use standard units in statistics; it prevents a variable with a very high standard deviation from messing up similarity metrics like SSD. How about self-portrait.jpg?
To answer that we need to talk about cropping first. It turns out if you just break the images so that each one is a third of the total height, the images will look pretty bad. The reason is, if you
were to investigate the full glass plate negatives, you'll see there are some really weird uneven borders due to aging in the plates. Now most of the glass plates have uneven borders between the color negatives,
but the key is, the unevenness is consistent across most of the plates, so we can just crop the images such that we get rid of the weird borders, but maintain congruence in the color negative size and content.
The issue, I suspect, with self_portrait.jpg is that there's this really odd section of dead pixels in the middle negative, and some other weird spots on the lowest negative. Since these areas
are actually pretty substantial in size, it can really mess with our metric if we don't crop out a big section to get them out of the negatives, leading to the odd resulting image.
Citations