|
Overview
|
|
|
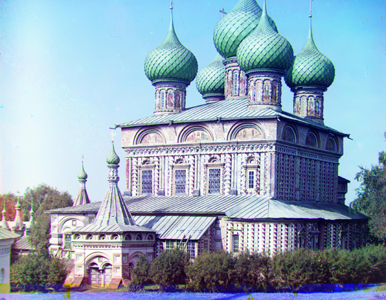
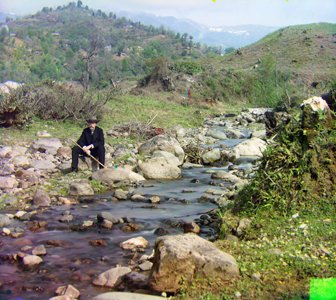
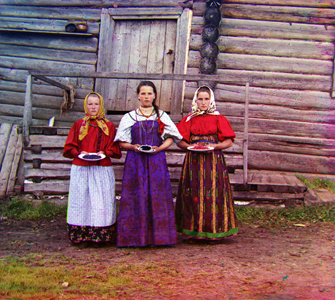
The intent of this project is to take images collected by Sergei Mikhailovich Prokudin-Gorskii of the Russian empire. These images are of particular noteworthiness because they were captured in sets of 3, corresponding to exposures with red, green, and blue filters. These images were produced before the advent of color photography. Using basic methods of calculus and statistics, I scripted a process to automatically detect edges, crop the photos, and align to produce the intended RGB witnessed by Prokudin-Gorskii himself.
|
|
|
Methods
|
|
|
The algorithm in place operates as follows:
Segmentation
The image is sectioned into thirds to separate the green, blue, and red channels.
|
|
|
Border Detection
The detect borders function determine the likely position where a black border is.
This automatic cropping function was essential to the successful completion of this project. While an automatic procedure was included in the "bells and whistles" section of the project, no manual cropping was performed.
|
|
|
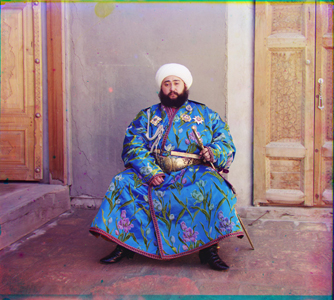
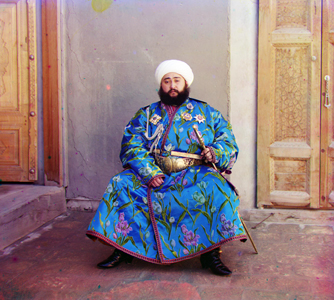
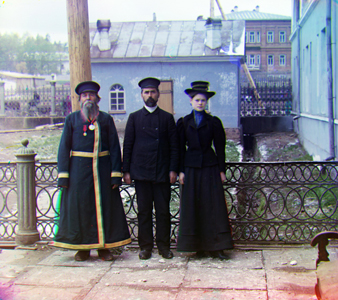
After properly cropping the images, the channels are then overlaid in one stack. The color channels need to be properly aligned. Green was selected as the reference channel. This was a decision made through pure trial and error, as this is what yielded the best results, especially in the emir.tif file.
|
|
|
Naive Algorithm
In the naive version of this algorithm, two for loops are used to cycle through different offsets of row and column shifts via np.roll. In the exhaustive version of this method, the bounds are set such that the last trial ends with the top left corner of the shifting image aligned with the bottom right corner of the reference image. 60% center crops were taken to evaluate the strength of the move. SSD was selected as the best loss function for this method. While normalized cross-correlation was tested, it did not perform as well as SSD.
Image Pyramid
In the Image Pyramid method, the image is compressed to 1/2, 1/4, 1/8,... etc size via a bicubic algorithm. The native algorithm is then performed on the smallest image that is larger than 64 pixels in either dimension, with initial bounds being set as 1/6 of the image dimensions. i.e. a 64x64 pixel image was shifted -20 to 20 pixels for both the row and columns. SSD was once again used to evaluate the performance. Once the best point was obtained, new bounds were calculated to perform a smaller sweep on the larger image. The new bounds were calculate to cover all pixels represented by the compressed one. i.e. if 2,3 was the best row, column shift on the 1/8 size image, [2*2-2,2*2+2],[2*3-2,2*3+2] = [2,6],[4,8] would be evaluated on the ¼ size image.
|
|
|
Results
|
|

|
Extras
|
|
|
Automatic Cropping
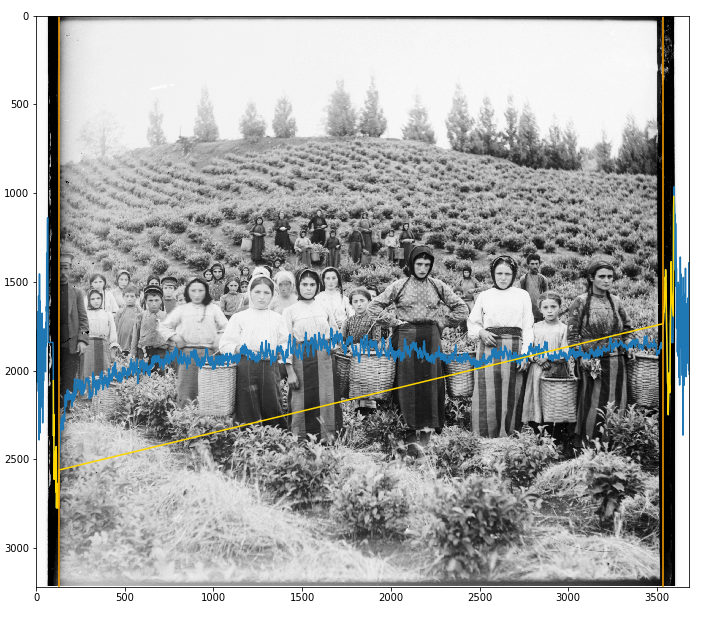
The border detection algorithm is based on where average derivative of the brightness values per row/column is greater than the global average derivative. Then, the value of the pixel intensity at those positions are evaluated to determine if they are below a threshold value (here calculated as the mean pixel value - 1.5 * standard deviation). The rationale here is that when there are large changes, this likely corresponds to the white to black transition on the exterior edges or the black border to image transition. It is, however, quite possible that other large features of the image will be picked up by this sweep. The threshold checking is done to maximize the likelihood that we are dealing with a black border. While the likely black border candidates are selected, a cutoff point needs to be determined. This is done by calculating the largest gap in the identified pixels, since it is likely that this gap corresponds to the image pixels which were deemed unimportant to the border detection function.
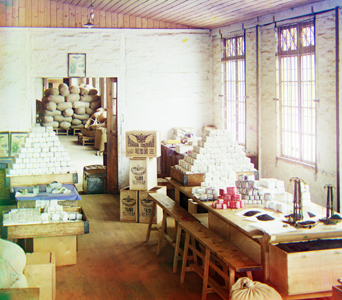
In the figure above, displaying the green channel of harvesters.tif, the blue line represents the average derivative of a pixel in the column. The gold line indicates those values with above average derivatives which have intensity values below the designated threshold. The diagonal line indicates the image pixels, and the orange line, drawn on the boundareis of said diagonal, is where the algorithm decides to crop.
|
|
|
Contrast Enhancement
A contrast enhancement filter was run on the images before export. The simplest color balance algorithm was sourced from DavidYKay. A threshold percent of 10 was set, meaning 10% of the dimmest pixels were set to black and 10% of the brightest pixels were set to white.
Additonal Cosmetic Enhancements
3% of the edge pixels were cropped from the image. This was done in order to remove fraying edges or artifacts like writing from the border, as well as some roll-over inclusions from np.roll.
|

|
Issues Encountered
|
|
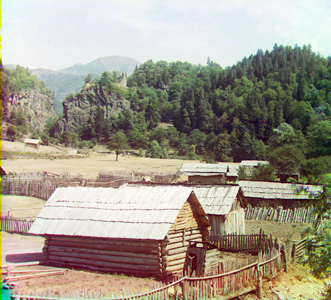
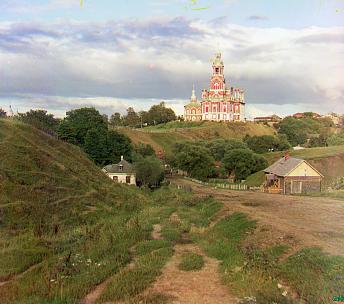
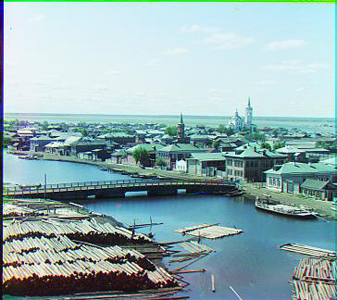
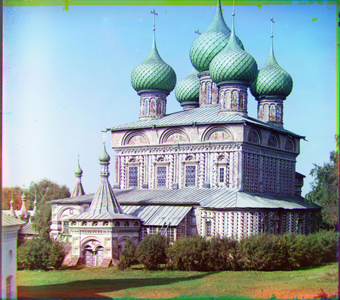
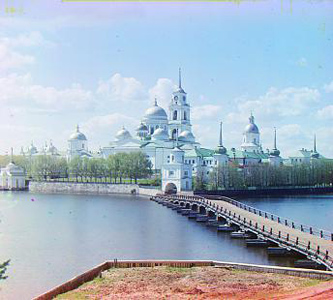
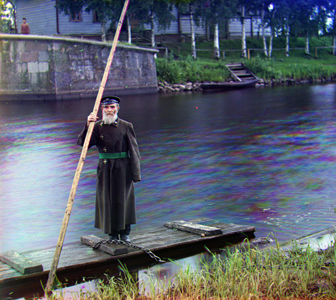
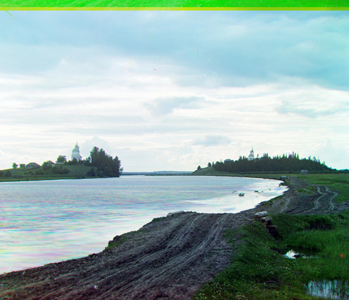
Minor issues occured on a couple of images, namely onion_church.tif and tobolsk.jpg. This is the result of features in the images which resembled a border, such as the bottom of the buishes in onion_church.tif and the reeds in tobolsk.jpg. This was resolved by changing the theshold pixel level from 1.25 * standard deviation to 1.5*standard deviation.
|