By Jing Yuan [Email: jingyuan10@berkeley.edu]
To measure the greenness of window views, Google Street View became a great source for green view index (GVI) calculation. For this study, I used a fully convolutional network (FCN) for semantic segmentation to separate street view into green space and other types. After obtaining the image segmentations by feeding the Google street view images into the trained network, the proportion of green space (e.g., trees, grass, plants) will be determined. To approximate human’s horizontal visual fields from a window, I selected the 3 images which equal peoples’ forward-facing view as the actual window view to calculate the window green view index (Window GVI) of this view. Finally, I extracted Google street view images of the neighborhood near UC Berkeley campus and created a window GVI heat map for this neighborhood.
DDuring the Cocvid-19 pandemic, “stay-in-place” order made most of the people work at home with limited outdoor activities. There are increasing mental health issues as the pandemic goes on[1]. A recently published study suggested that nature around people’s homes may help mitigate some of the negative mental health effects of the Covid-19 pandemic[2]. Thus, knowing the greenness level of the urban environment can not only facilitate designers with healthy architectural design by considering the naturalness of the surrounding urban environment, but also increase the value of real estate which will attract customers who are seeking for healthy living spaces.
Traditional methods of assessing built environment visual characteristics are time-consuming, labor heavy and difficult to generalize to different contexts. In recent years, with the development of computer vision[3], it is feasible to identify the semantic information such as plants, natural view and water features respectively from the urban environment without the labor of labeling items by hand. Moreover, the recent applications of machine learning techniques in urban and built environments [4] [5] [6] [7]as well as the accessibility of cameras, makes it possible to assess the naturalness of built environment by using urban environment images.
To help the designer understand the view quality of the building, we need to understand: How to get the window green view index (window GVI) of a given building? To solve this problem, this project is aiming to 1) Train semantic segmentation model with street view images; 2) Extract street view image from Google Street View (GSV); 3) Crop the image to mimic the view from window; 4) Assess the GVI of the window view; The results of this project will help architectural designers by assessing the naturalness of the window view, especially for facade designers to make better decisions when they are designing fenestrations of building facades.
Street level urban greenery. Computer vision has been used in urban environments for safety prediction[7], tree type detection[8] and city feature identification[9]. And Yang et al.[10] firstly proposed a “Green View” index to evaluate the visibility of urban forests through photography interpretation. Their GVI was defined as the ratio of the total green area from pictures taken at a street intersection to the total area of pictures. However, there are a limited number of studies in the literature using GSV images for evaluation of street greenery. Li et al.[11] were the first one to use GSV images for assessing the human-viewed street greenery by using three color bands to extract the greenness of the GSV.
Semantic segmentation. All the studies mentioned above get the greenery level of the street view picture by analyzing the color bands of each picture, which is time consuming. For the semantic segmentation of images, traditional image segmentation algorithms are typically based on clustering often with additional information from contours and edges[12]. With the development of deep learning, Helbich et al.[13] were able to separate the green and blue area of the GSV by using a fully convolutional neural network developed by Long et al. (i.e., the FCN-8s)[14], that they learn a mapping from pixels to pixels, without extracting the region proposals like RCNN.
Most of the studies assessing urban greenery are focusing on outdoor experience. Limited number of papers considered the window view greenery. For this project, I will apply semantic segmentation method on GSV by considering the field of view from window to assess the window greenery level of a given building.
First of all, in this study, the fully convolution network (FCN) model, which is based on a residual neural network (ResNet34), was constructed to improve the accuracy of segmentation because ResNet prevents the vanishing gradient problem.
During the model training, I used a small set of data from a larger dataset, Cityscapes (URL: https://www.cityscapes-dataset.com/) as training and validation datasets. Cityscapes is a new large-scale dataset that contains a diverse set of stereo video sequences recorded in street scenes from 50 different cities, with high quality pixel-level annotations of 5 000 frames in addition to a larger set of 20 000 weakly annotated frames.
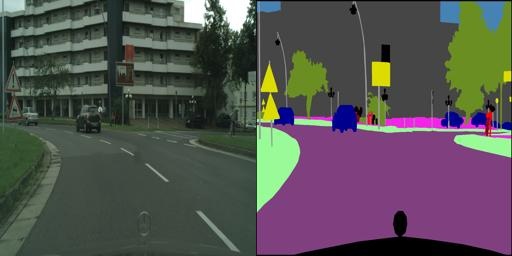
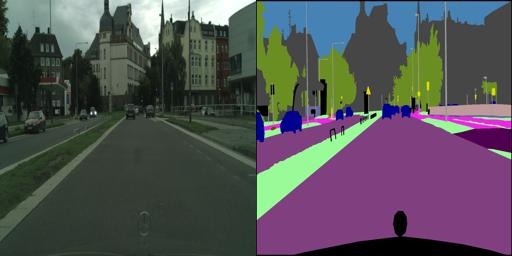
This version is a processed subsample created as part of the Pix2Pix paper[15]. The dataset contains still images and the semantic segmentation labels which was created from the original videos. This is one of the best datasets around for semantic segmentation tasks. This subsample of the dataset has 2975 training images files and 500 validation image files. Each image file is 256x512 pixels, and each file is a composite with the original photo on the left half of the image, alongside the labeled image on the right half (samples of the training and validation images are shown in Figure 1).
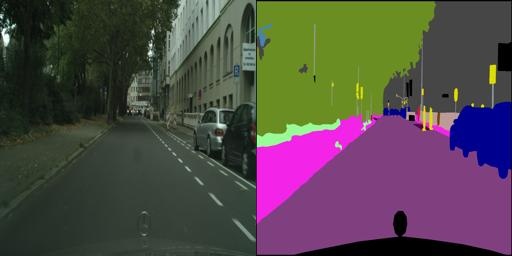
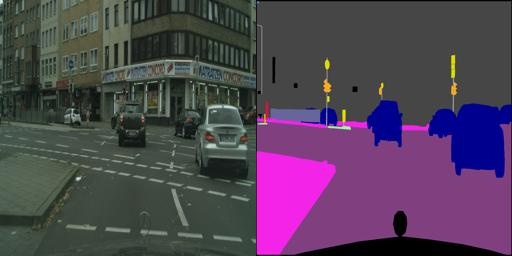
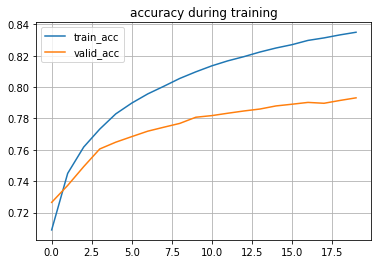
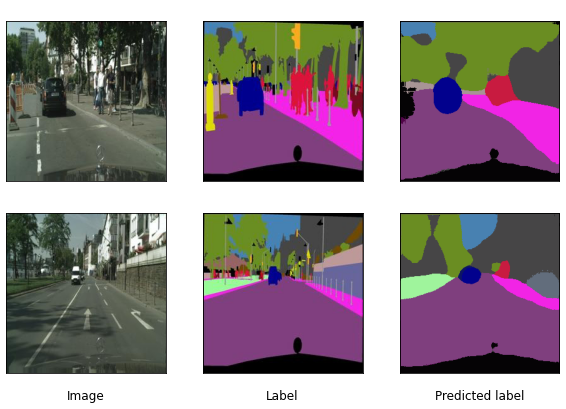
Finally, after 20 epochs of training with 0.01 learning rate, this model was able to predict the label of training and validation dataset with the accuracy of 83% and 79%, respectively (samples of the output image segmentation images are shown in Figure 2).
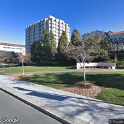
To approximate the view from window, I decided to use street views near the building as the window view. I extracted Google street view (GSV) by using the Google Street View API. In this study, I chose UC Berkeley campus as an analysis target and predicted the view greenery level of the building in this area.
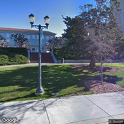
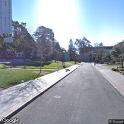
In order to approximate the field of view from windows, I get the street view based on the geolocation of the selected buildings. The total horizontal visual field (FOV) of human is 200 ° which is the union of monocular visual fields. But when people stand in front of the window, I only considered the outdoor view and ignored the indoor environment that could also be seen by people, which was not considered into the window view analysis. Thus, finally I used 180 ° as the total window visual field. Accommodating for the parameter of GSV API, I separate the total window visual field into three part, 0 °-60°, 60 °- 120 °,120 °- 180 °. Eventually, each window view was composed of three GSV images as shown in the following samples. After getting the window view, I used the image segmentation model to separate these views into different content as shown Figure 4.
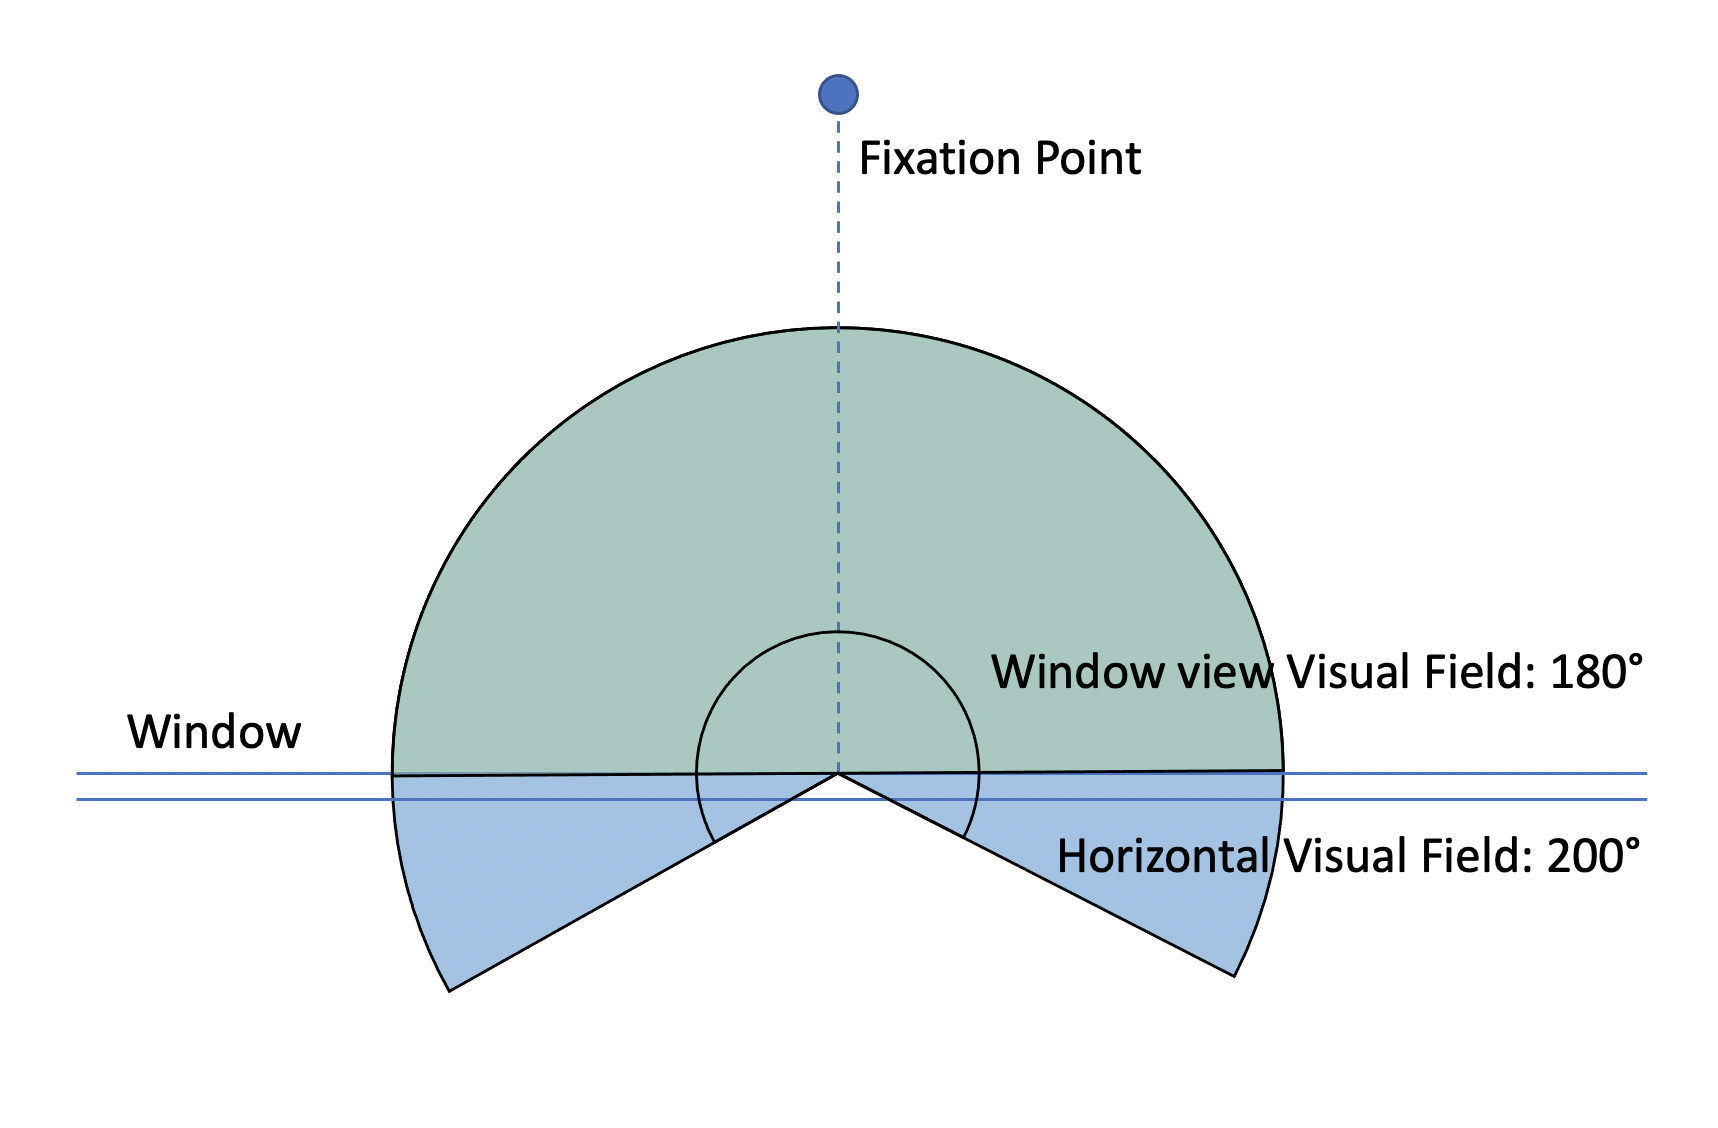
Thus, finally I used 180 ° as the total window visual field. Accommodating for the parameter of GSV API, I separate the total window visual field into three part, 0 °-60°, 60 °- 120 °,120 °- 180 °. Eventually, each window view was composed of three GSV images as shown in the following samples. After getting the window view, I used the image segmentation model to separate these views into different content as shown Figure 4.
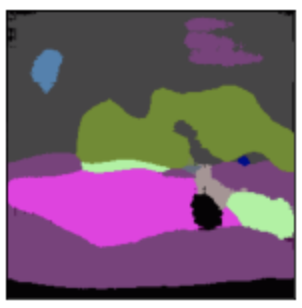
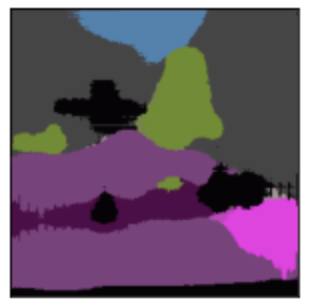
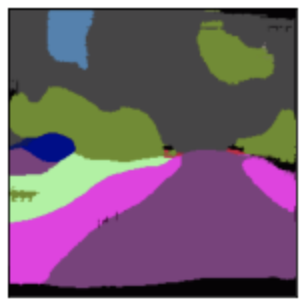
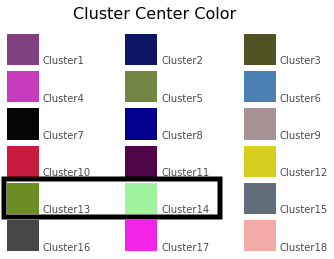
Each pixel in the GSV was labeled into 18 colors and each color represented one type of content on the street (e.g. trees, buildings and grass). But, only cluster 13 and 14 represented the green area inside the window view (Figure 5).
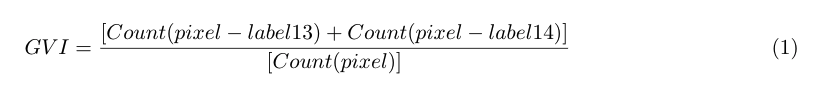
When I calculated the GVI of a single street view images, I used the following equation by getting the ratio of total number of pixels labeled as 13 and 14 to the total number of pixels in this image:
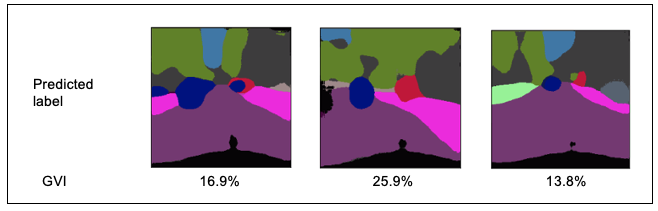
To test out the performance of the eqaution, I applied this equation to the training and validation set and calculate the GVI of several street views (examples of the GVI are shown in Figure 6):
For window GVI, window views were composed of three GSV images and the size of each GSV was the same. So, the equation of the window GVI were calculated as following by averaging out the GVI from each street view images:

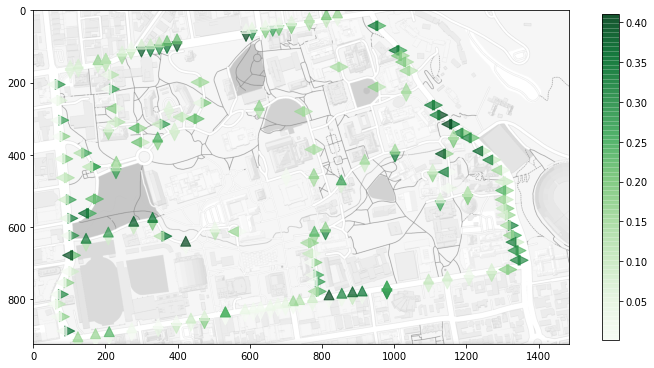
To make the results of this project more interpretable, I created a window GVI heatmap for UC Berkeley campus, which could be easily understood by architectural designers and they can refer to the map when they are designing the fenestration of the facades. For students, they can find a place with a better window view to study in order to help them recover from the stressful coursework.
By using the window GVI calculated and the geolocation of each building around UC Berkeley campus, I visualized the level of the window GVI on the campus map (Figure 7). In this map, the darker the green, the larger the window GVI, which indicates that there is more greenery in the window view of this location and the greenery level of this place is higher compared to other buildings. And the arrow in the map represents the direction of the window, because the view on different sides of the street is significantly different and we cannot ignore this parameter when we are assessing the window view quality. From the figure, we could easily find that the window GVI can be significantly different on different side of road.
In this study, I used the FCN model to separate street view into green space and other types. And using the labeled street image to calculate the window GVI. Finally, I created a window GVI map for UC Berkeley campus.
But there are some limitations of this project. For the trained FCN model, the prediction accuracy is still low. In the future, a better model and larger training epoch should be implemented to improve the performance of the model so as to get more accurate calculation of the window greenery. Then, when I get the window view, I only consider the horizontal field of view, but the vertical field of view is also important for view quality assessment. Besides, the result from this could only represent the window GVI for buildings with single floor. For the map creation, I only considered the existing buildings. But, places without buildings are also valuable for architectural designers who are designing new buildings from scratch.
In the next step, I will create a detailed window GVI map from which users can get the greenery level of any point along the road instead of only considering places with buildings. And also, I will extend the content of the map from campus wide to countywide or statewide so as to facilitate any type of architectural project in the area. Besides, to evaluate the naturalness of the window view, I will also consider the blue level and brown level of the given window view, eventually this model can be comprehensive enough to assess how much nature can occupants get access to through the window view.
[1] C. Son, S. Hegde, A. Smith, X. Wang, and F. Sasangohar, “Effects of COVID-19 on College Students’ Mental Health in the United States: Interview Survey Study,” J. Med. Internet Res., vol. 22, no. 9, p. e21279, 2020, doi: 10.2196/21279.
[2] M. Soga, M. J. Evans, K. Tsuchiya, and Y. Fukano, “A room with a green view: the importance of nearby nature for mental health during the COVID-19 pandemic,” Ecol. Appl., vol. n/a, no. e2248, p. e2248, Nov. 2020, doi: https://doi.org/10.1002/eap.2248.
[3] M. R. Ibrahim, J. Haworth, and T. Cheng, “Understanding cities with machine eyes: A review of deep computer vision in urban analytics,” Cities, vol. 96, p. 102481, Jan. 2020, doi: 10.1016/j.cities.2019.102481.
[4] J. M. Keralis et al., “Health and the built environment in United States cities: measuring associations using Google Street View-derived indicators of the built environment,” BMC Public Health, vol. 20, no. 1, p. 215, Feb. 2020, doi: 10.1186/s12889-020-8300-1.
[5] V.-A. Darvariu, L. Convertino, A. Mehrotra, and M. Musolesi, “Quantifying the Relationships between Everyday Objects and Emotional States through Deep Learning Based Image Analysis Using Smartphones,” Proc. ACM Interact. Mob. Wearable Ubiquitous Technol., vol. 4, no. 1, p. 7:1–7:21, Mar. 2020, doi: 10.1145/3380997.
[6] X. Wang, Y. Shi, B. Zhang, and Y. Chiang, “The Influence of Forest Resting Environments on Stress Using Virtual Reality,” Int. J. Environ. Res. Public. Health, vol. 16, no. 18, Sep. 2019, doi: 10.3390/ijerph16183263.
[7] N. (Nikhil D. Naik, “Visual urban sensing : understanding cities through computer vision,” Thesis, Massachusetts Institute of Technology, 2017.
[8] J. D. Wegner, S. Branson, D. Hall, K. Schindler, and P. Perona, “Cataloging Public Objects Using Aerial and Street-Level Images - Urban Trees,” 2016, pp. 6014–6023, Accessed: Dec. 16, 2020. [Online]. Available: https://www.cv-foundation.org/openaccess/content_cvpr_2016/html/Wegner_Cataloging_Public_Objects_CVPR_2016_paper.html.
[9] C. Doersch, S. Singh, A. Gupta, J. Sivic, and A. Efros, “What Makes Paris Look like Paris?,” ACM Trans. Graph., vol. 31, no. 4, Jul. 2012, Accessed: Dec. 09, 2020. [Online]. Available: https://hal.inria.fr/hal-01053876.
[10] J. Yang, L. Zhao, J. Mcbride, and P. Gong, “Can you see green? Assessing the visibility of urban forests in cities,” Landsc. Urban Plan., vol. 91, no. 2, pp. 97–104, Jun. 2009, doi: 10.1016/j.landurbplan.2008.12.004.
[11] X. Li, C. Zhang, W. Li, R. Ricard, Q. Meng, and W. Zhang, “Assessing street-level urban greenery using Google Street View and a modified green view index,” Urban For. Urban Green., vol. 14, no. 3, pp. 675–685, Jan. 2015, doi: 10.1016/j.ufug.2015.06.006.
[12] D. Weinland, R. Ronfard, and E. Boyer, “A survey of vision-based methods for action representation, segmentation and recognition,” Comput. Vis. Image Underst., vol. 115, no. 2, pp. 224–241, Feb. 2011, doi: 10.1016/j.cviu.2010.10.002.
[13] M. Helbich, Y. Yao, Y. Liu, J. Zhang, P. Liu, and R. Wang, “Using deep learning to examine street view green and blue spaces and their associations with geriatric depression in Beijing, China,” Environ. Int., vol. 126, pp. 107–117, May 2019, doi: 10.1016/j.envint.2019.02.013.
[14] J. Long, E. Shelhamer, and T. Darrell, “Fully convolutional networks for semantic segmentation,” in 2015 IEEE Conference on Computer Vision and Pattern Recognition (CVPR), 2015, pp. 3431–3440, doi: 10.1109/CVPR.2015.7298965.
[15] P. Isola, J.-Y. Zhu, T. Zhou, and A. A. Efros, “Image-to-Image Translation with Conditional Adversarial Networks,” Nov. 2016, Accessed: Dec. 15, 2020. [Online]. Available: https://arxiv.org/abs/1611.07004v3.