|
|
|
|
|
|
|
|
|
|
|
|
|
|
|
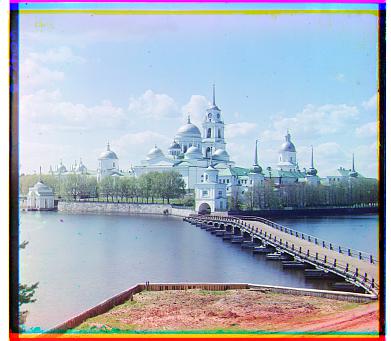
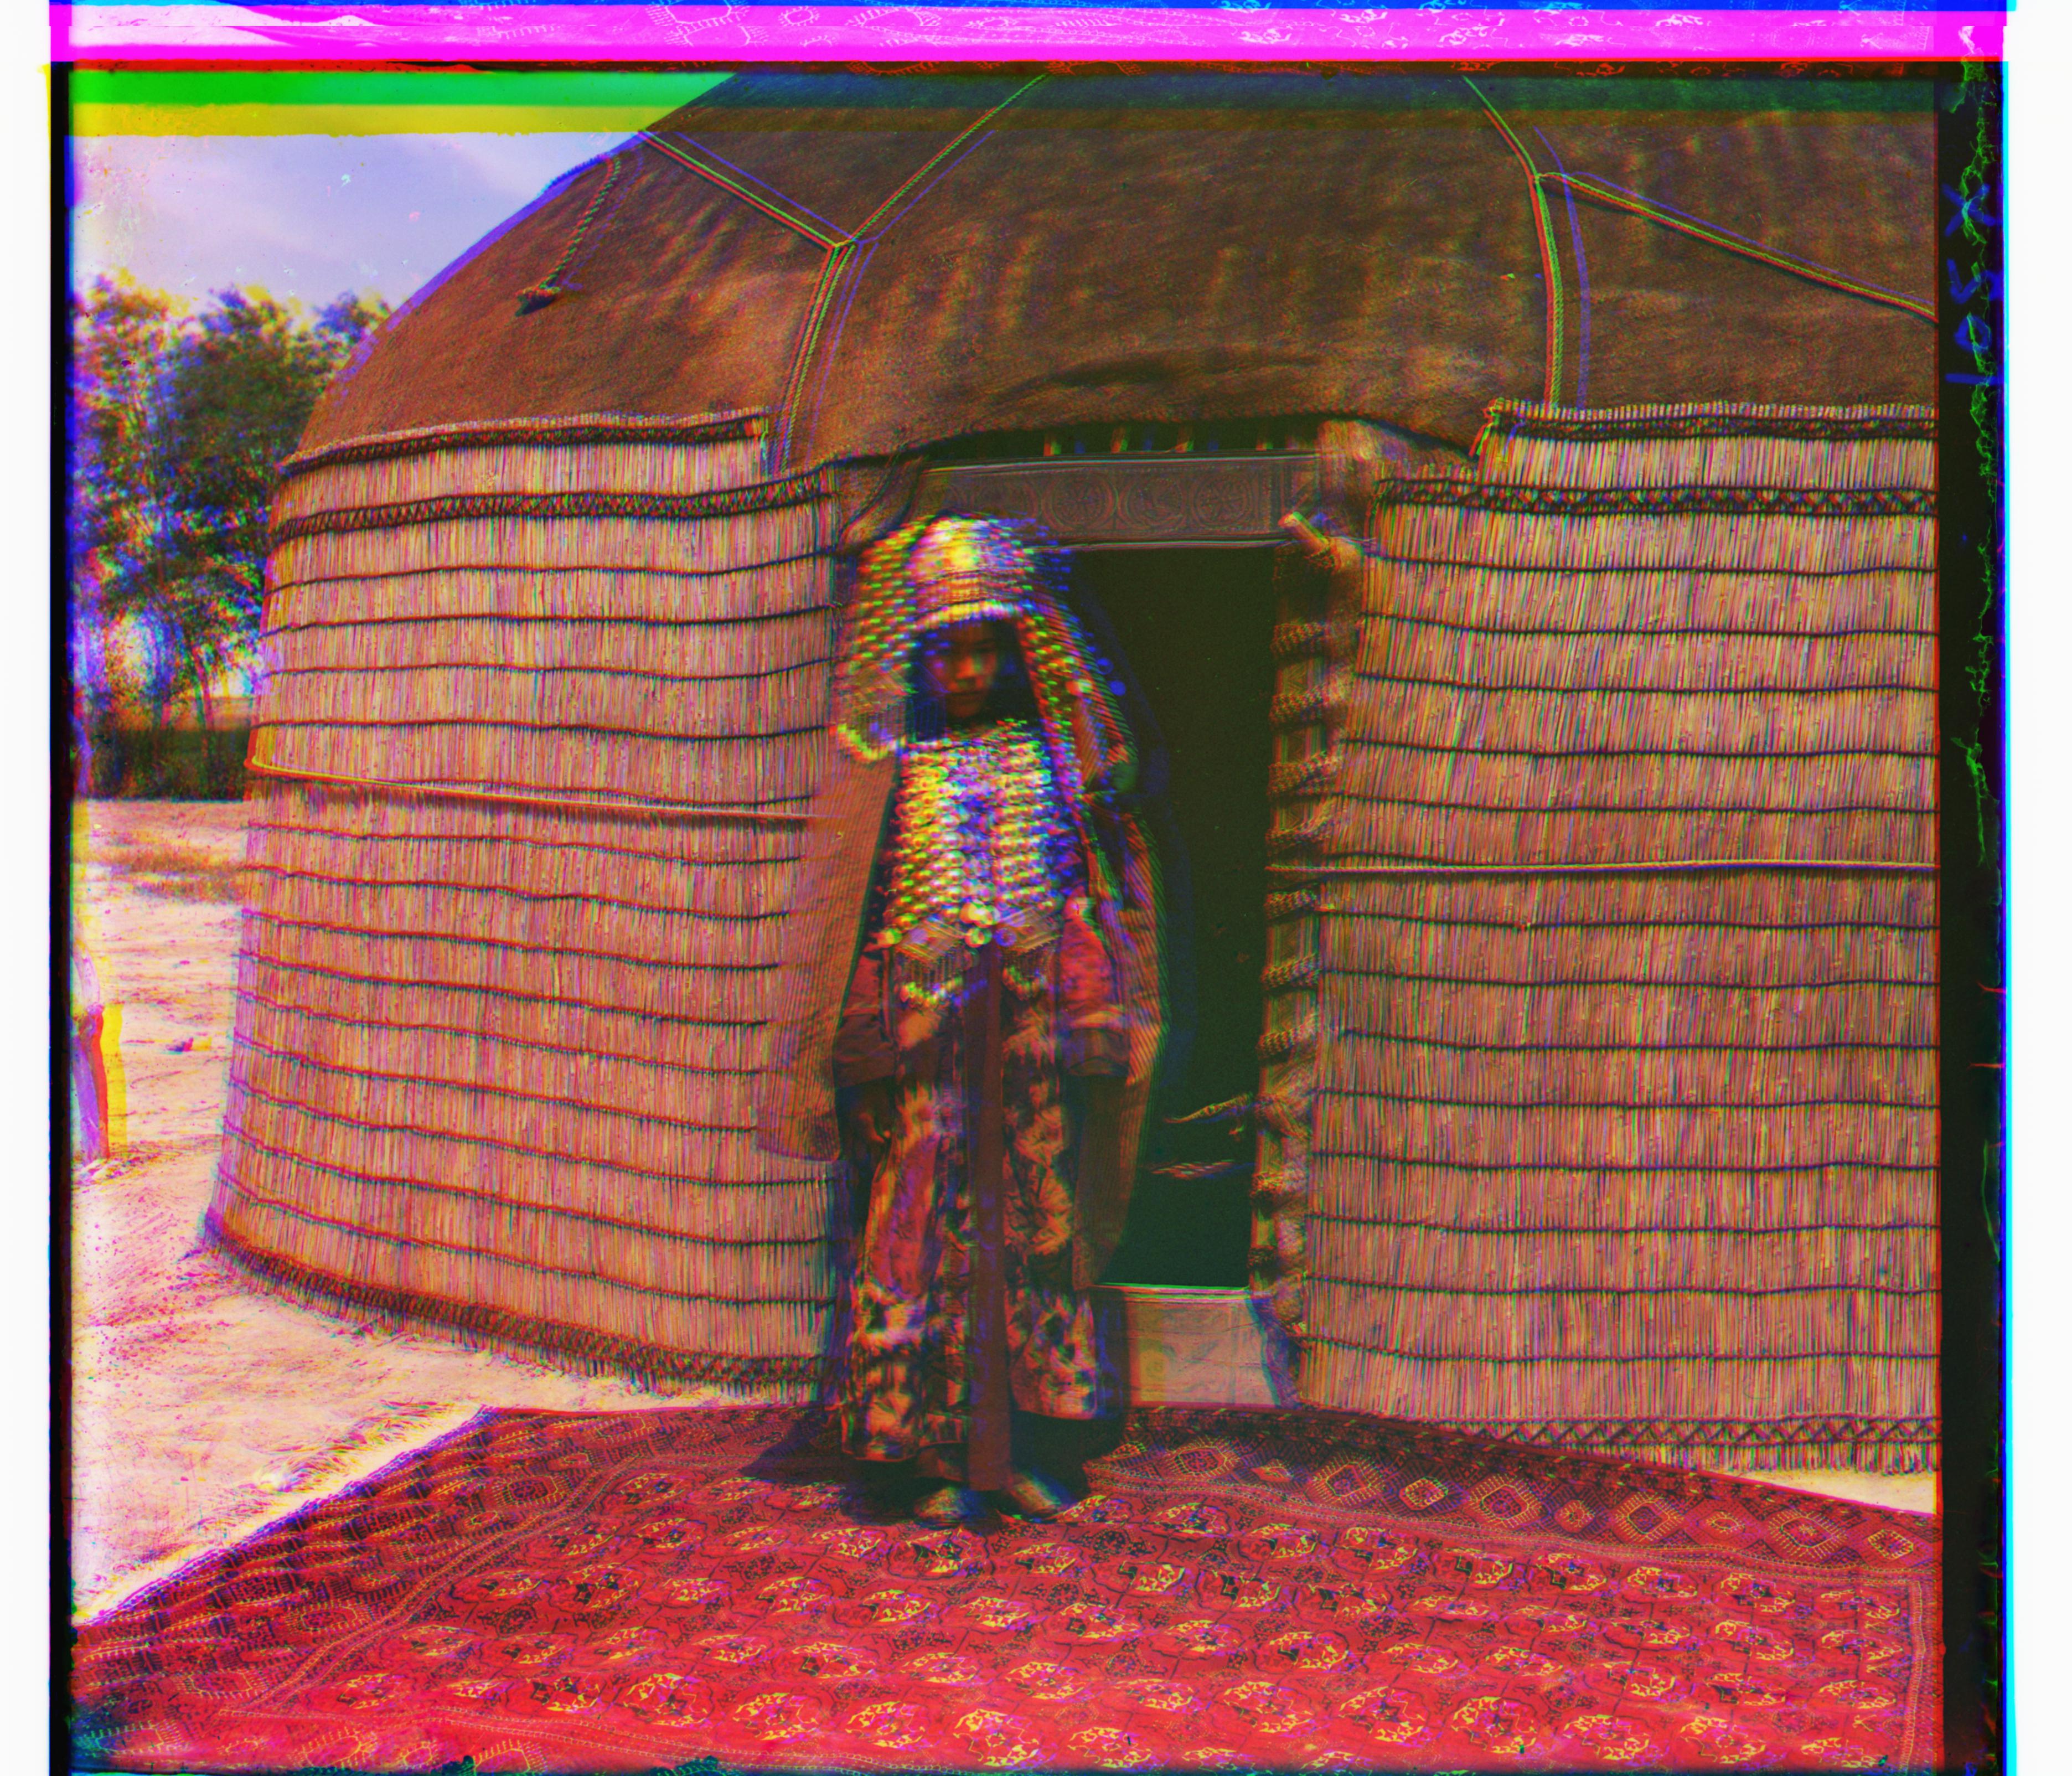
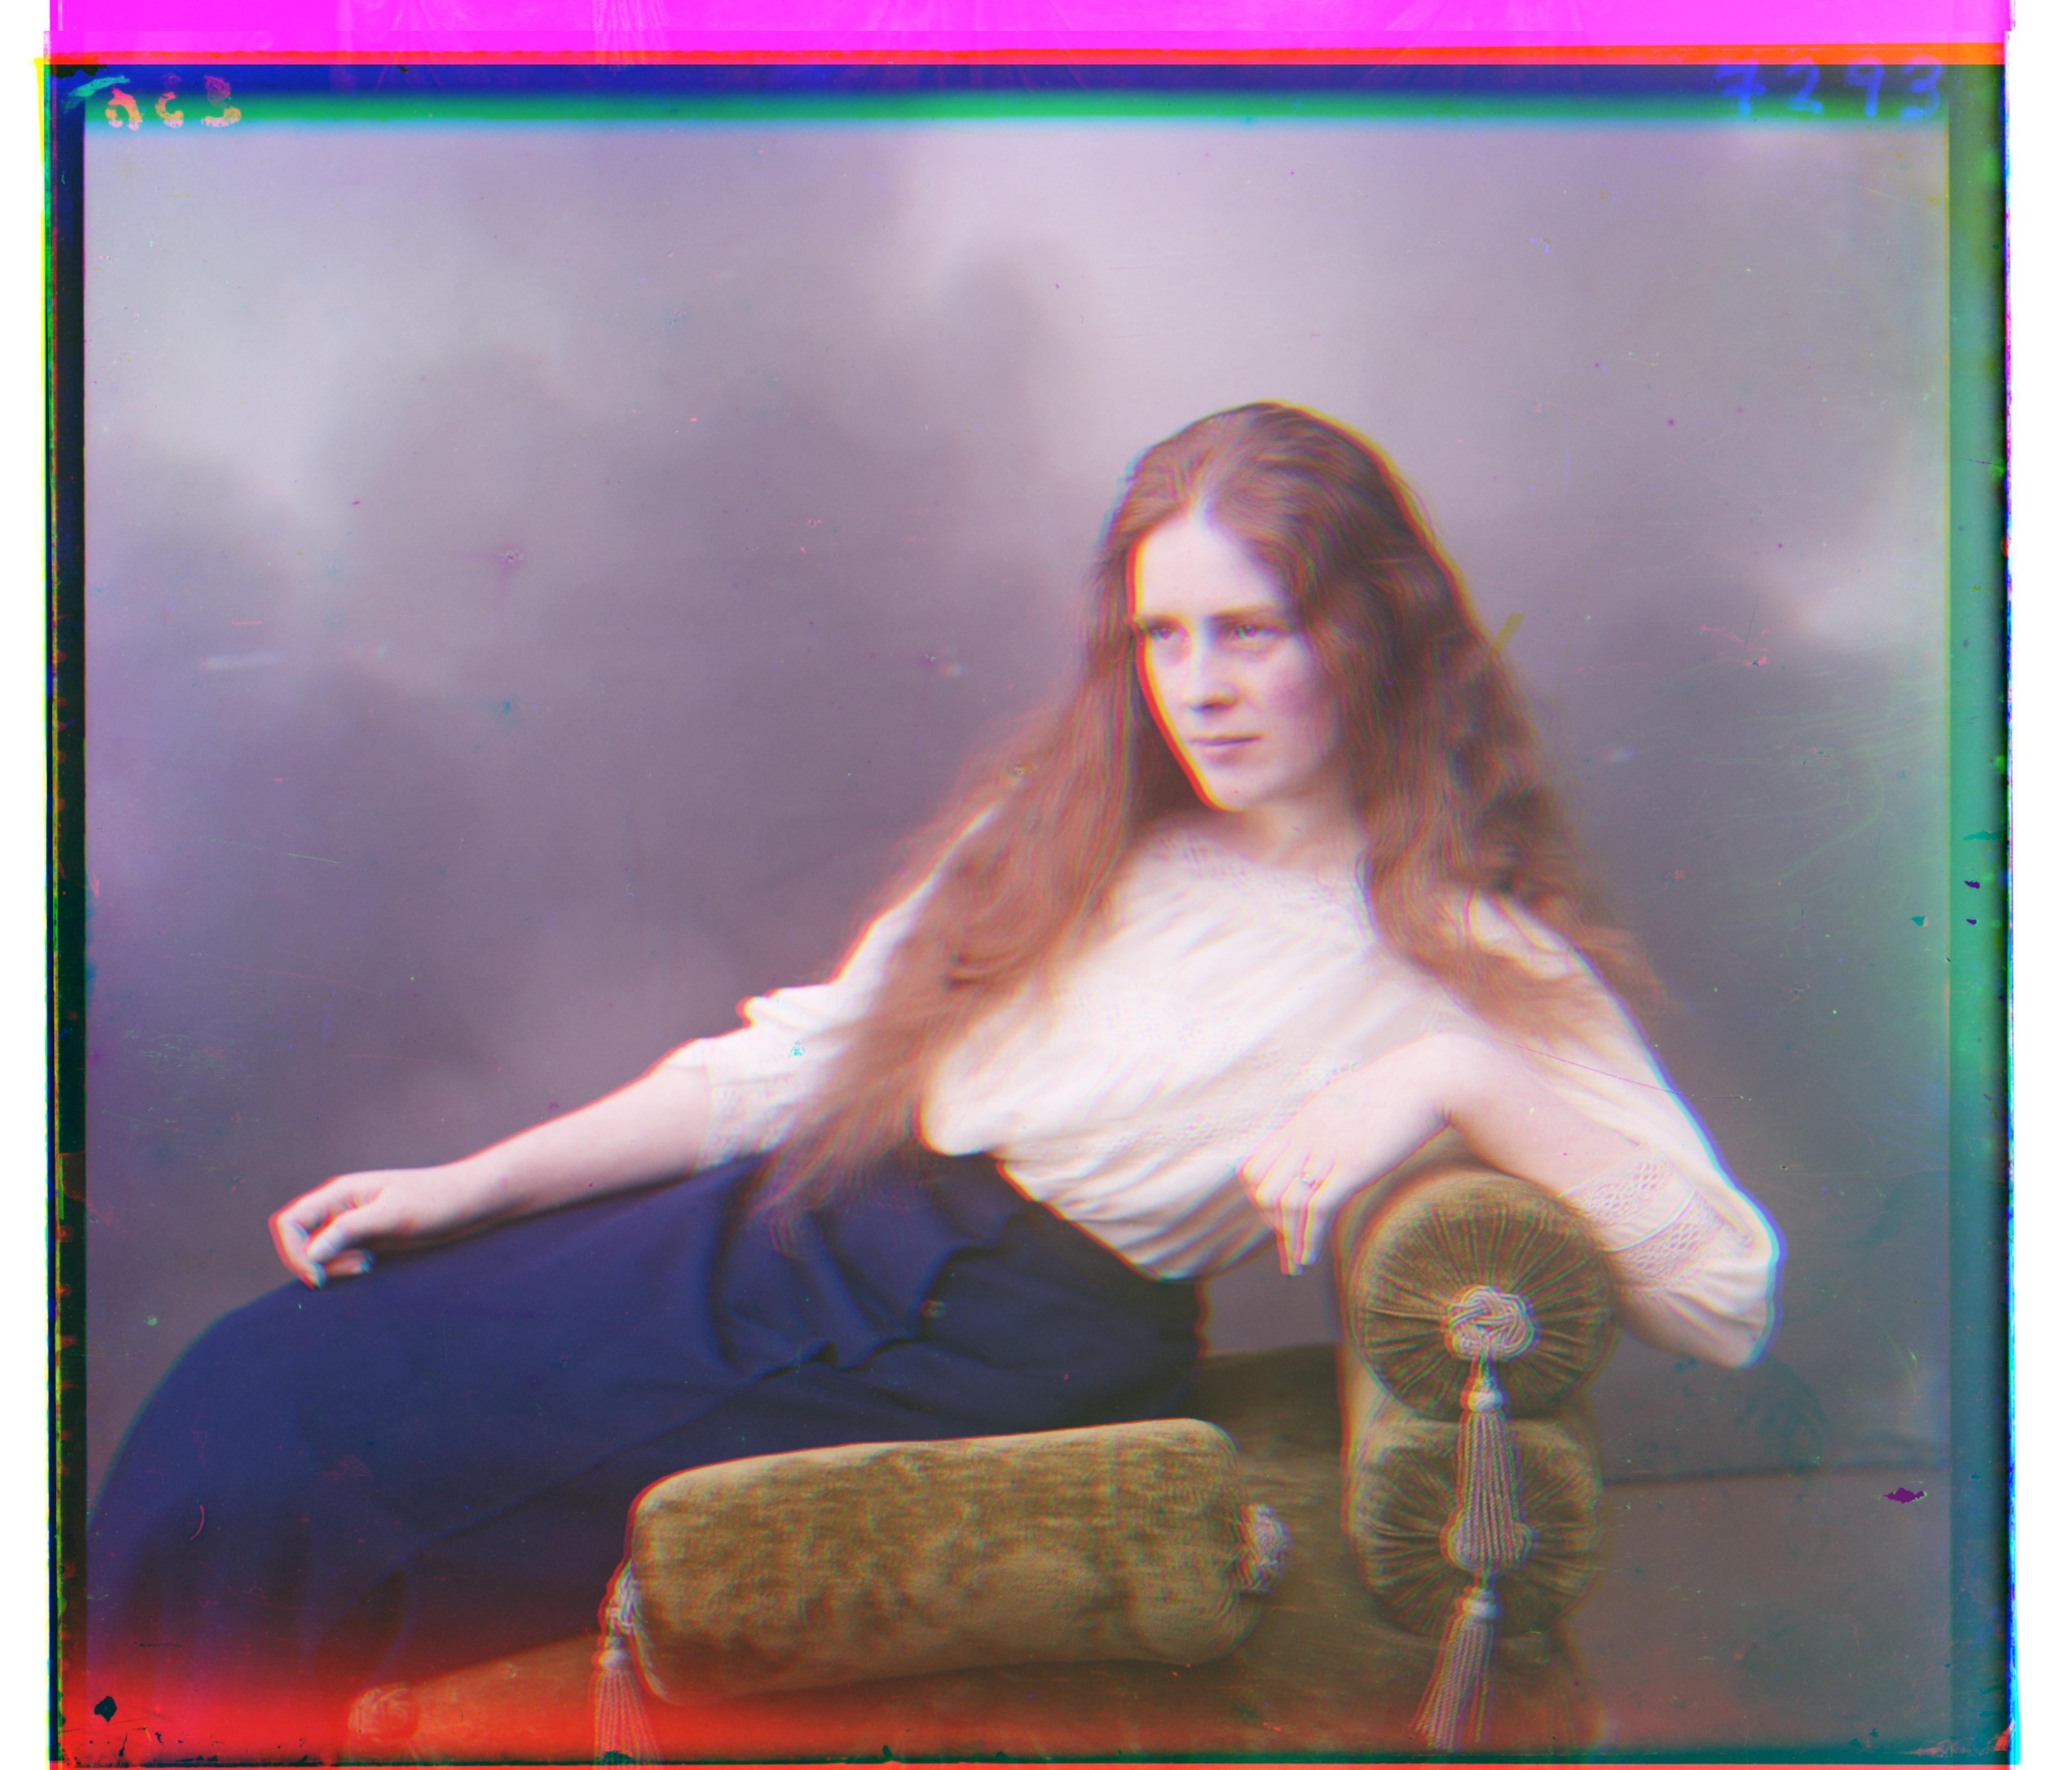
For project 1, the task consisted of properly aligning the three separate exposure takes for images in the collection created by Sergei Mikhailovich Prokudin-Gorskii. The images were separated into Red, Green, and Blue components, and were provided in greyscale stacked on top of each other. The goal of the program, then, is to determine the amounts that each component should be shifted against each other to produce realistic color.
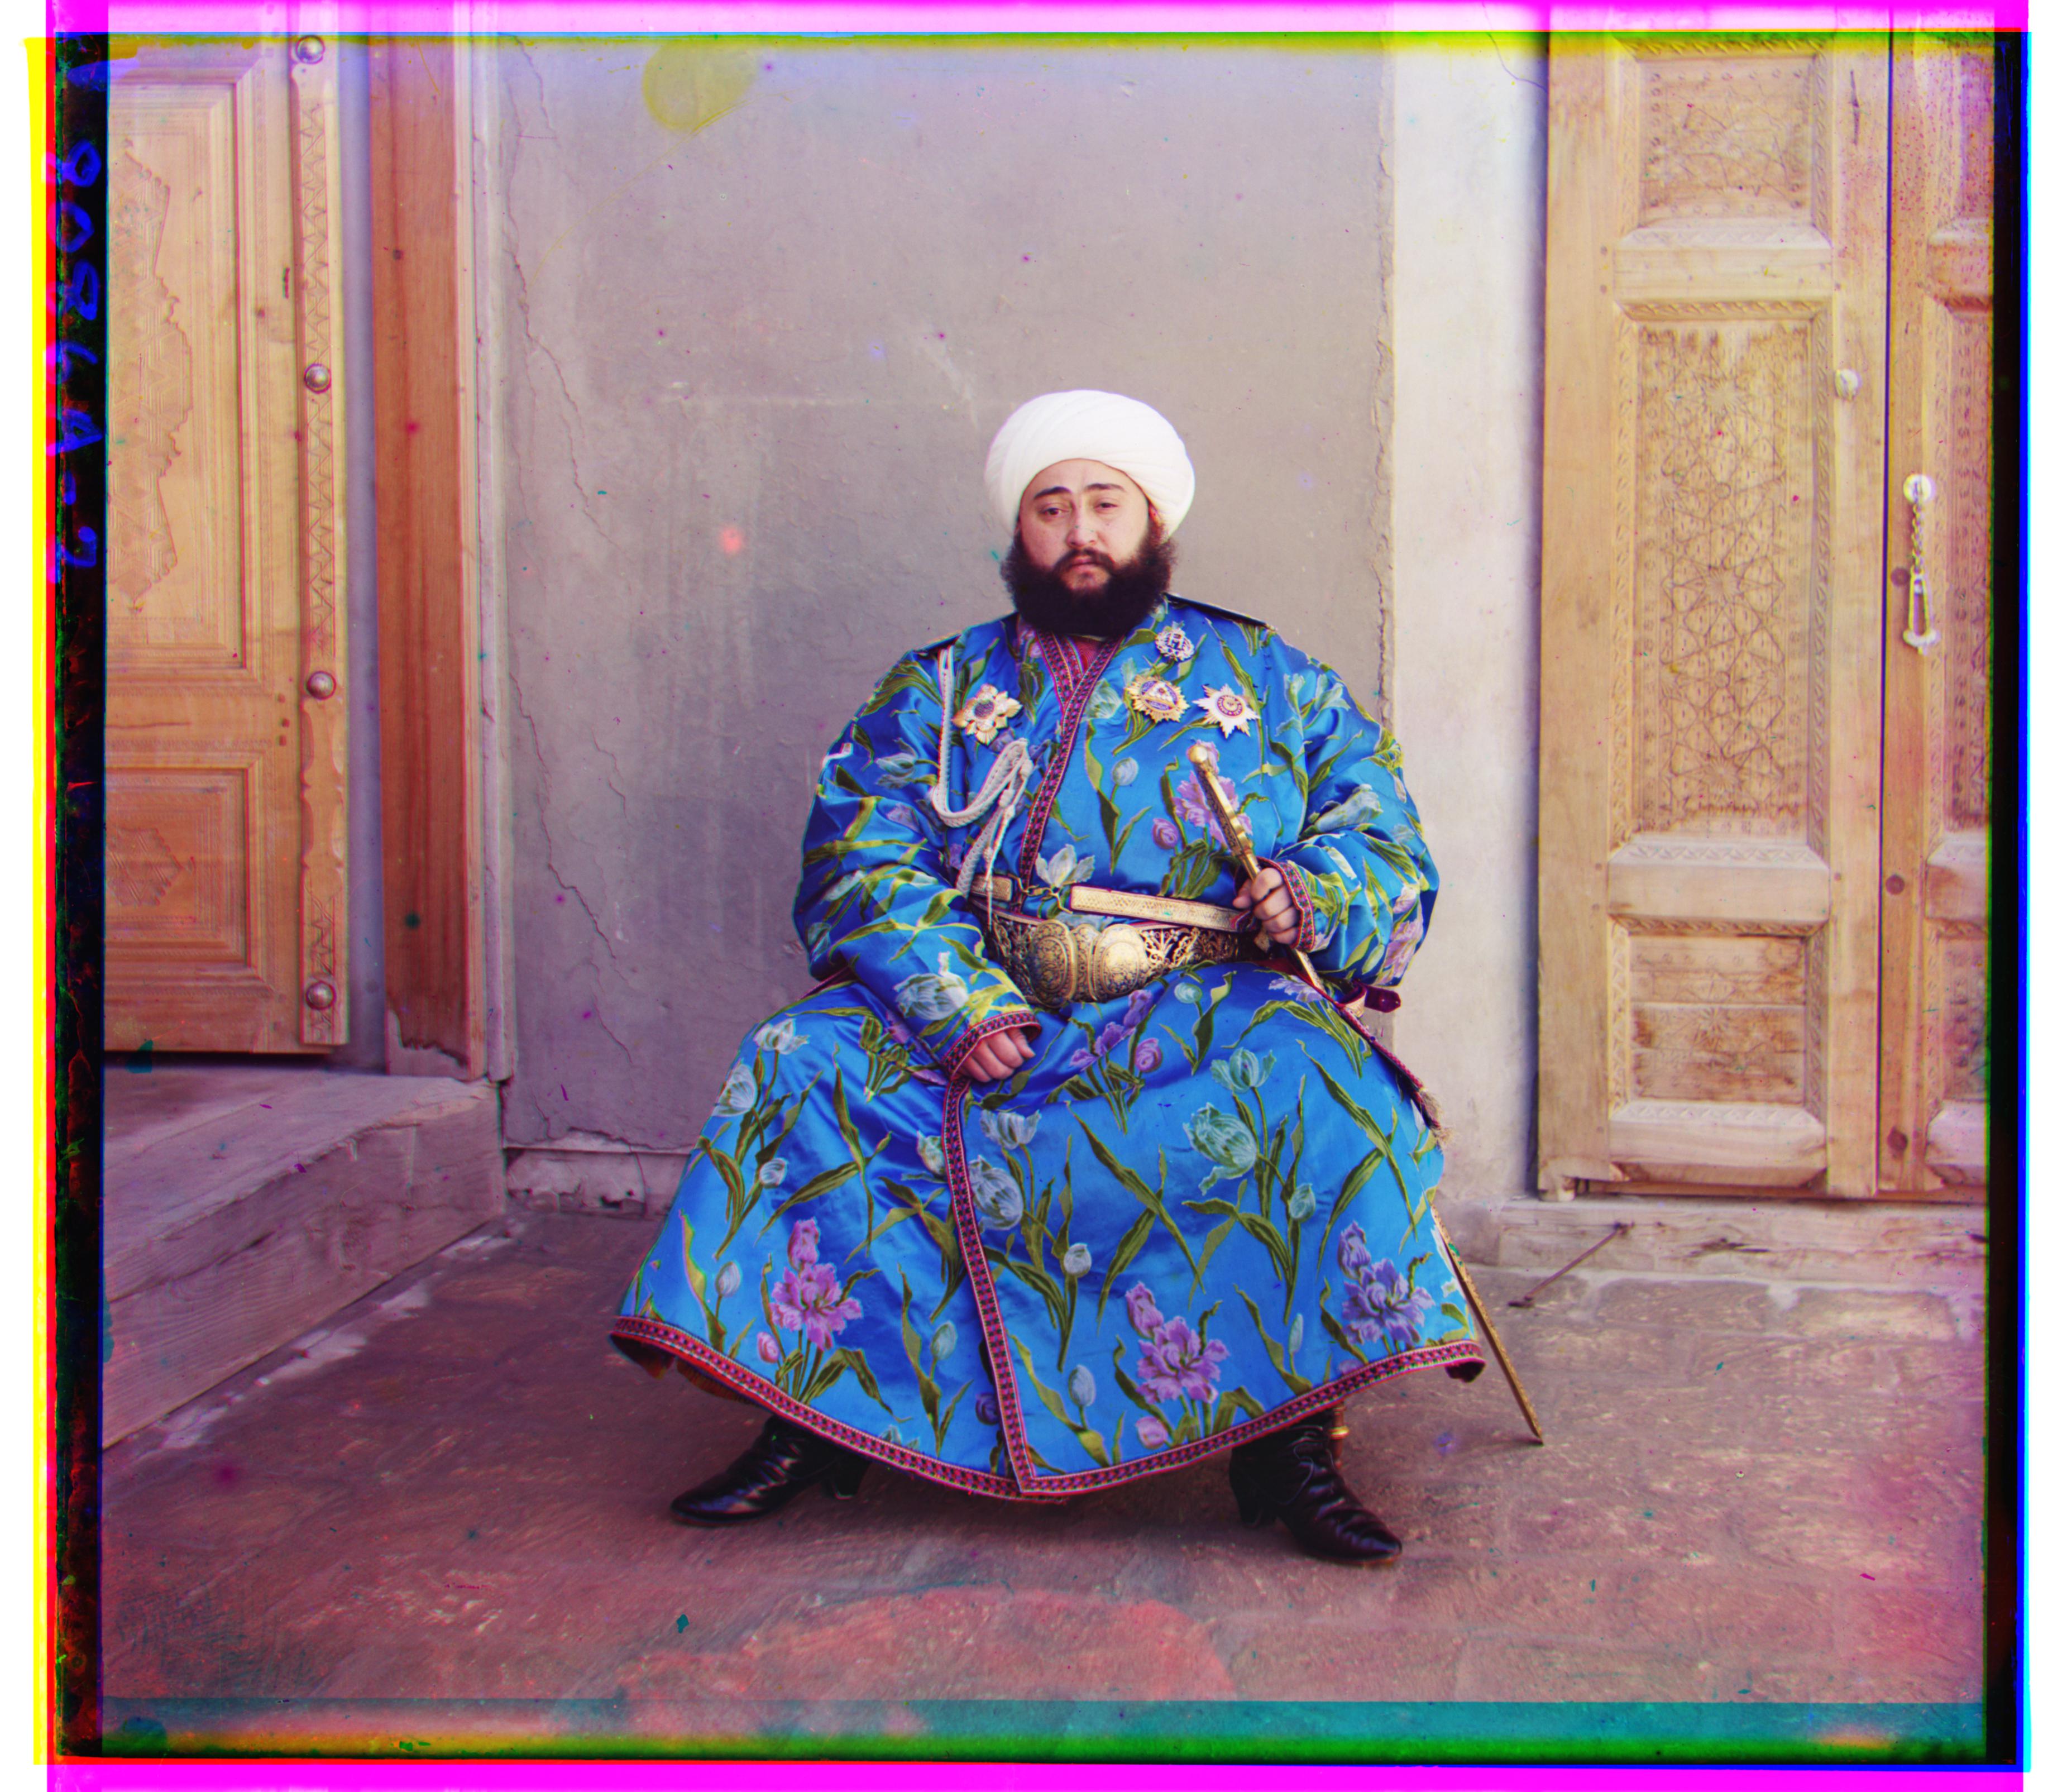
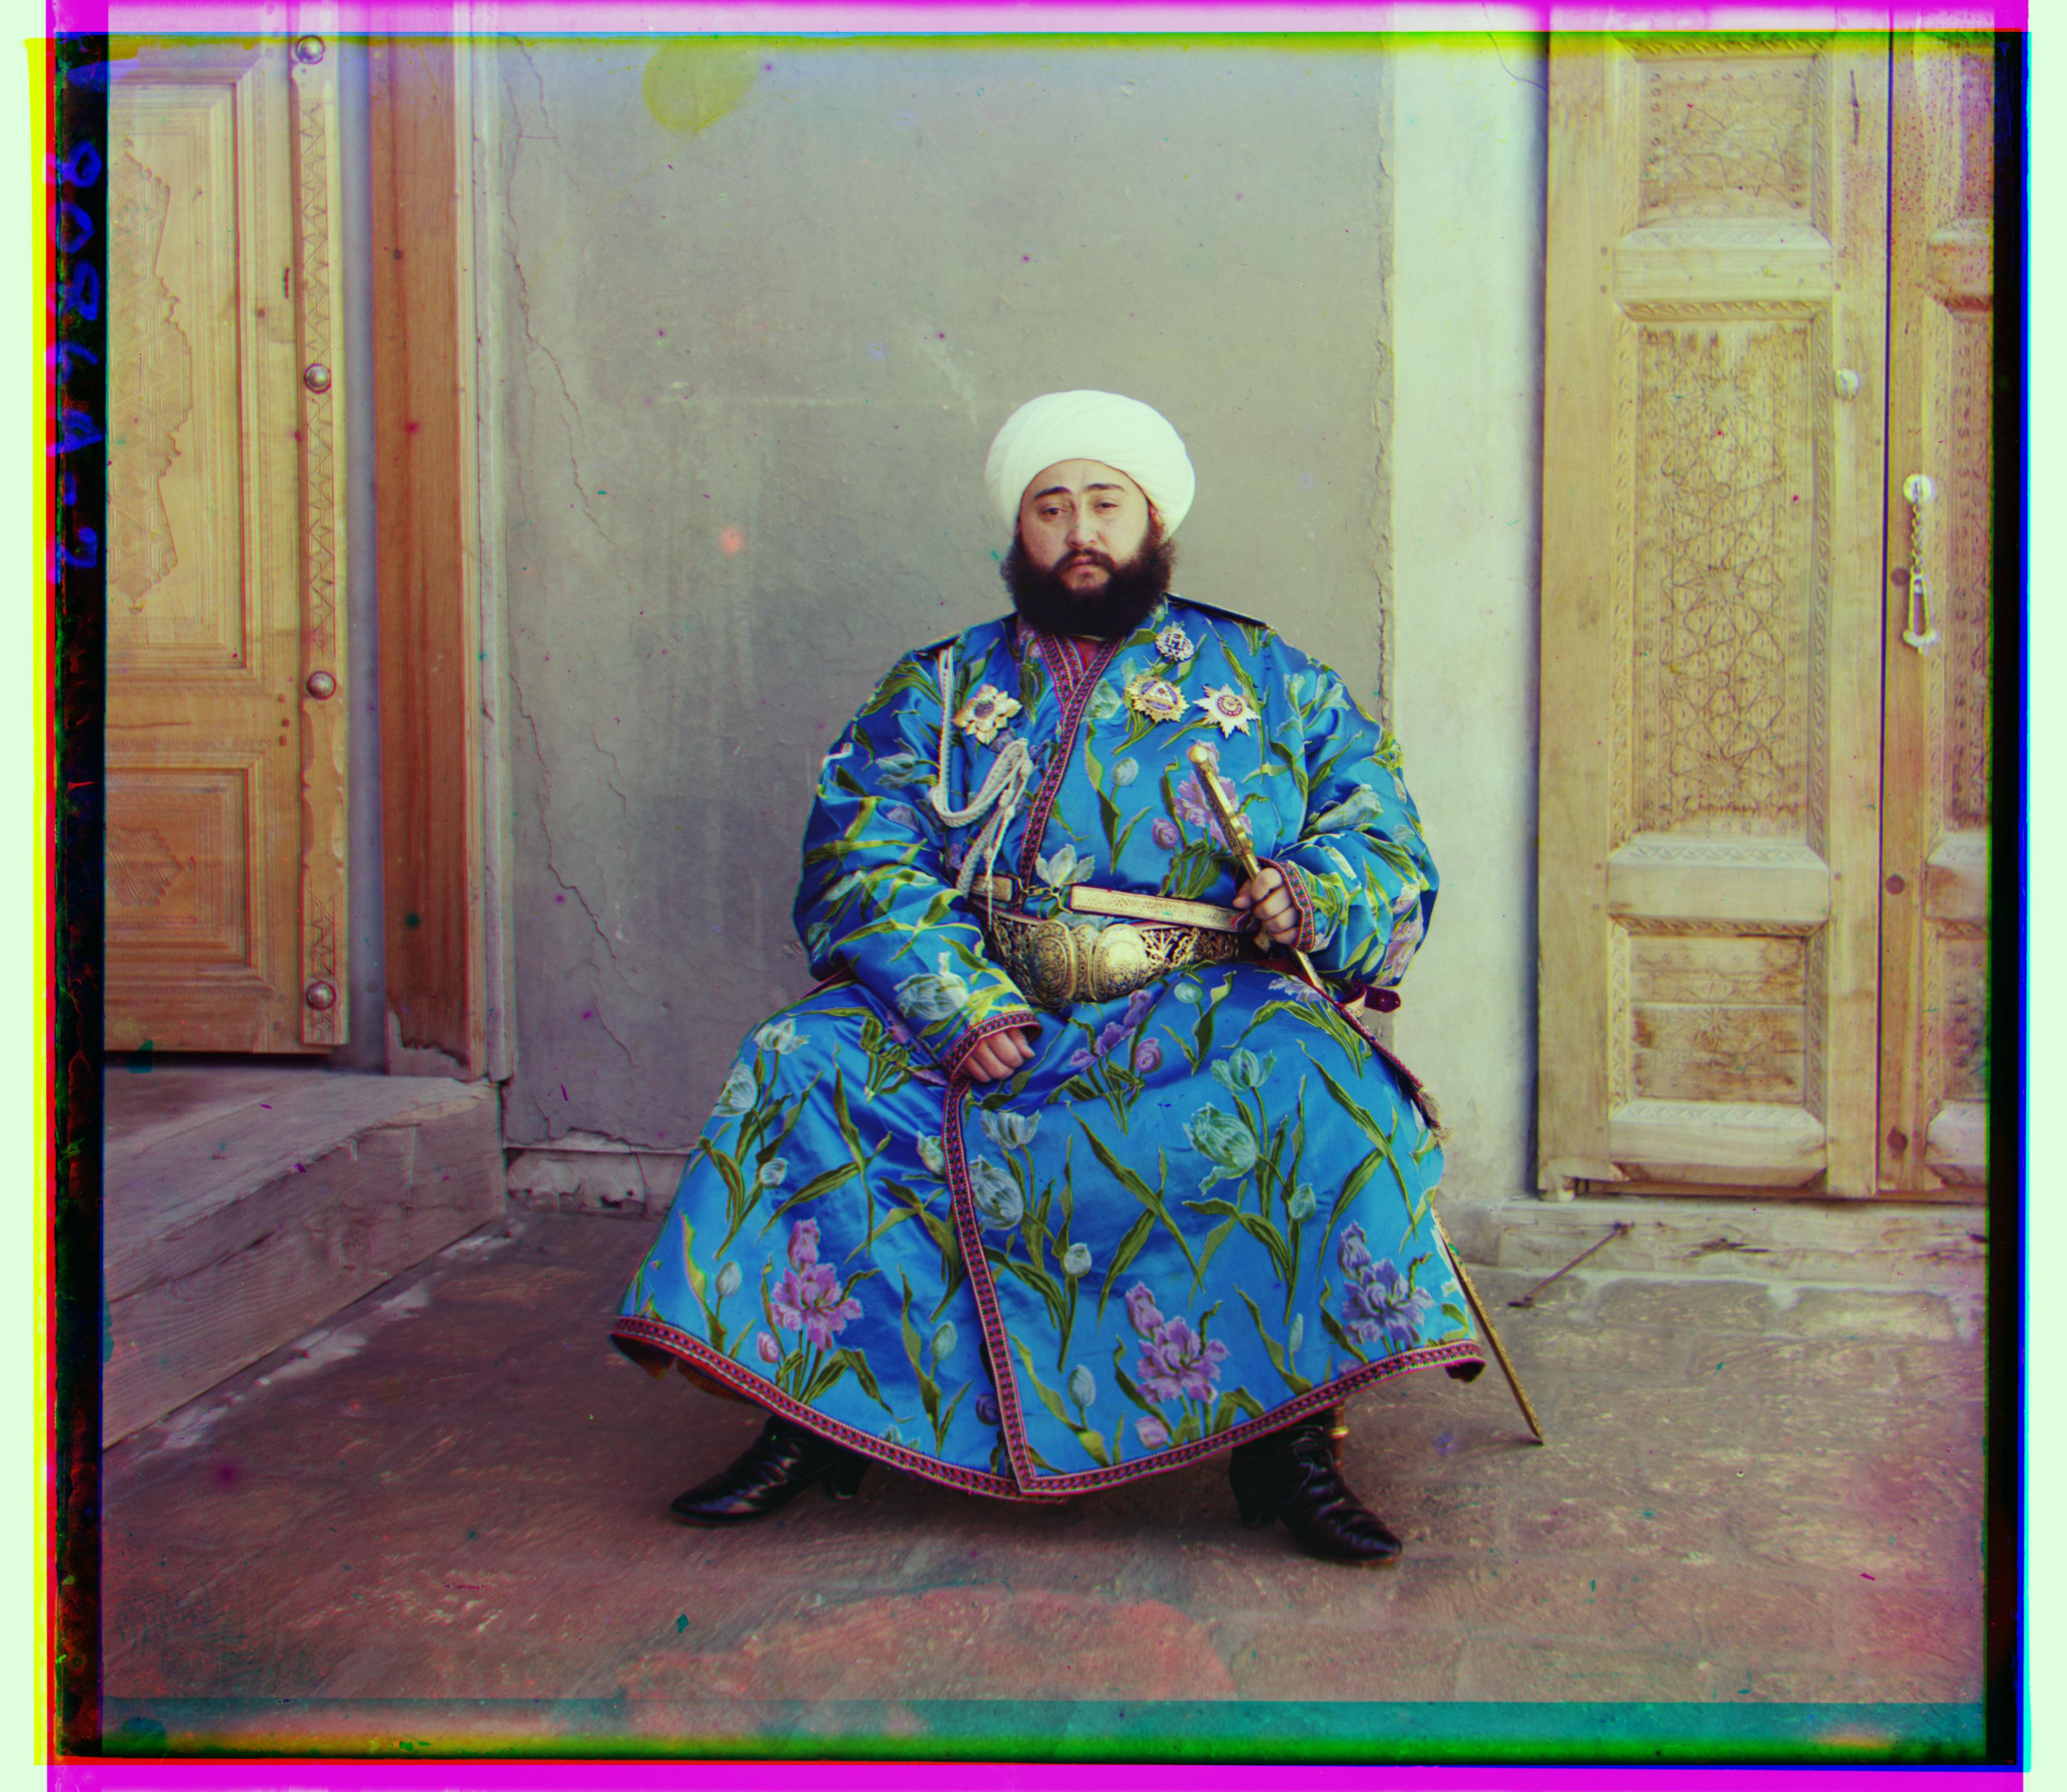
The first step in implementing the project involved developing an exhaustive search over a range of alignments. For this problem, I chose to check the alignment of one color against another fixed one on the range [-15, 15] across both axes. For most images, this involves fixing the Blue component and determining the best alignments for Red and Green separately, then combining all three together. For Emir.tif specifically, the algorithm produces a very misaligned image if the Blue component is fixed. To solve this, Emir.tif alignment is performed where the Green component is fixed, and the Blue and Red ones are checked against it, which I found produced far better results than the other fixings. To determine the "quality" of an alignment, I used the Sum of Squared Differences (SSD) as my metric, taking the squared difference between the fixed component and the one currently being searched. The lower the SSD, the better the alignment. When calculating the SSD, I use a function to slice off 10% of the image from each side. The first reason for this is to cut off odd values at the edges of the image that may be created by rolling the non-fixed component for alignment. Secondly, cutting the image speeds up computation, as fewer calculations need to be performed.
The second step in implementing the proejct involved developing a recursive image pyramid algorithm to evaluate larger images. This is because the fixed [-15, 15] displacement range is not enough for larger scale images, but increasing that range will greatly increase computation time. To deal with this issue, my pyramid algorithm recursively scales the image by a factor of 1/2 until it is small enough for an exhaustive search (400 pixels on any axis). When scaling back up the original size, the displacement value from the smaller image size is doubled, and alignment is then performed again at the current level and its displacement value added to the total. This way, alignment is still being performed at each level of the pyramid, but the alignment of the smallest size image (top of the pyramid) has the greatest impact, as it searches a greater area of the image than lower levels.
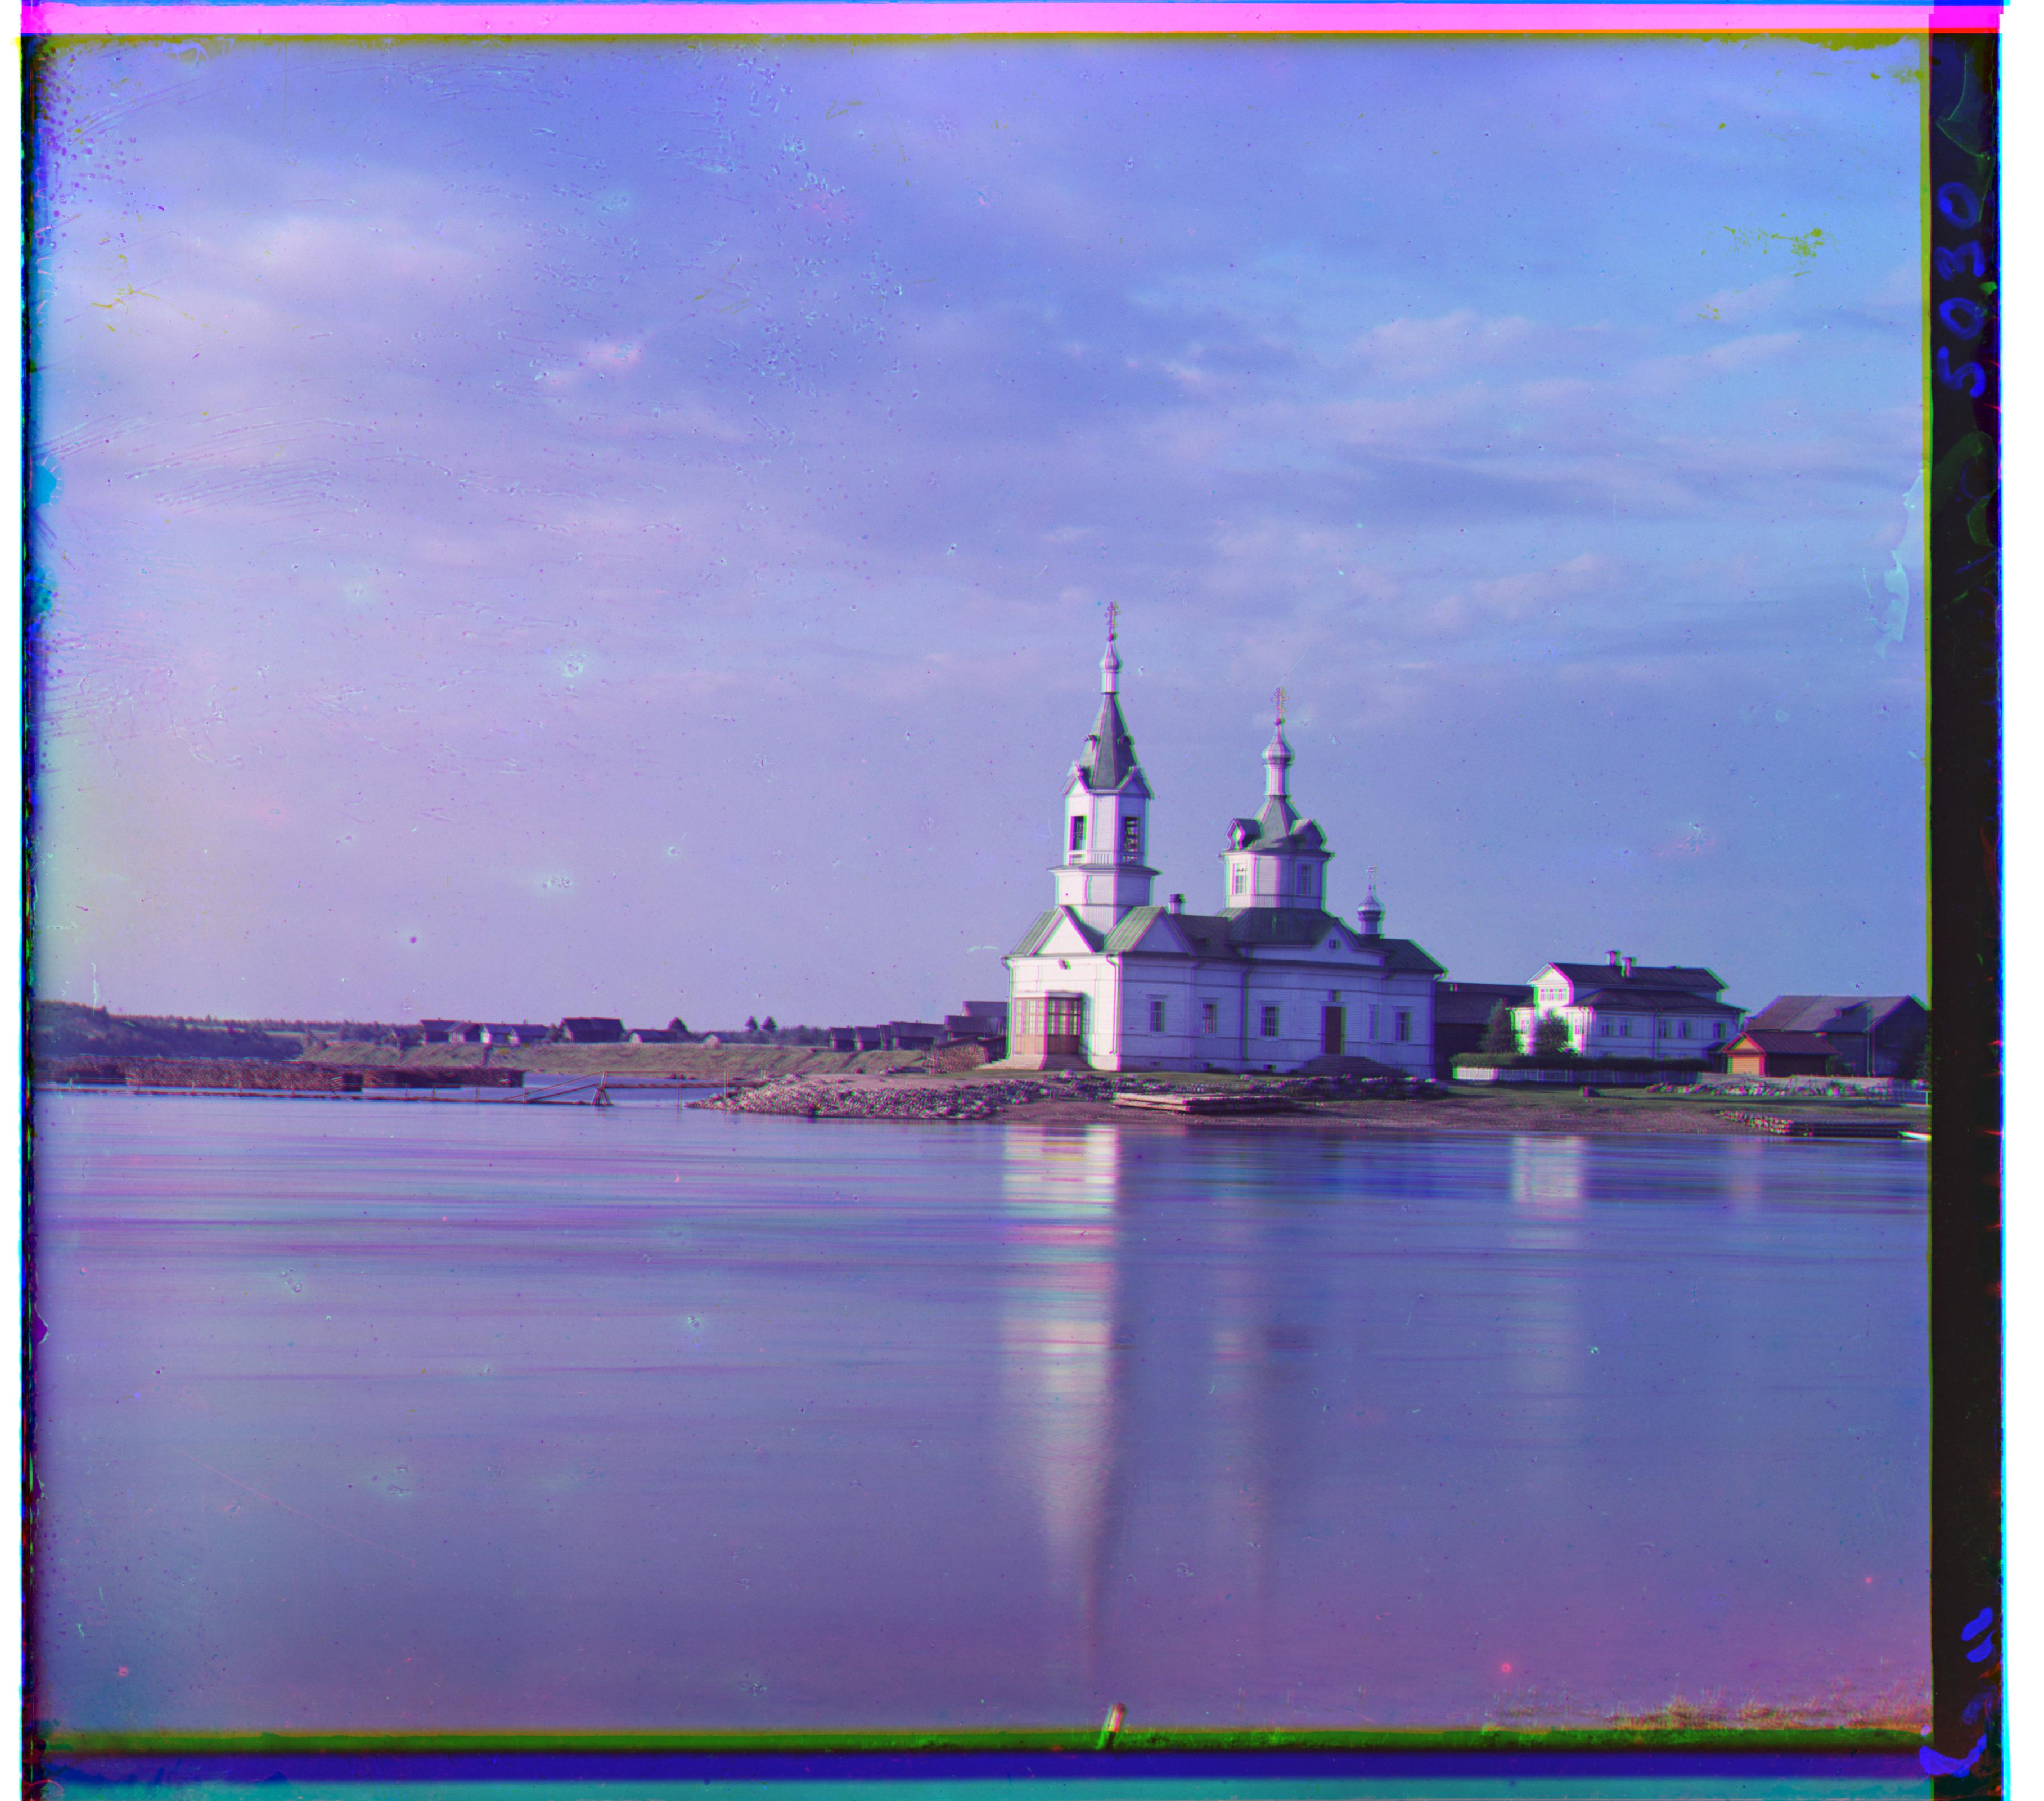
Below are the resulting images when run using the above algorithm. The displacement amounts of each fixed component is listed for each image.
|
|
|
|
|
|
|
|
|
|
|
|
|
|
|
|
|
|
|
|
|
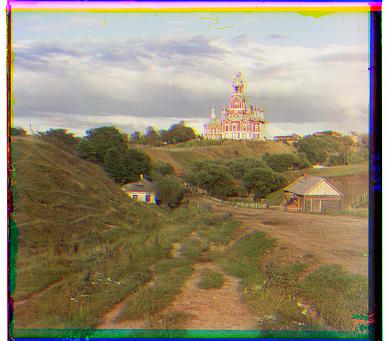
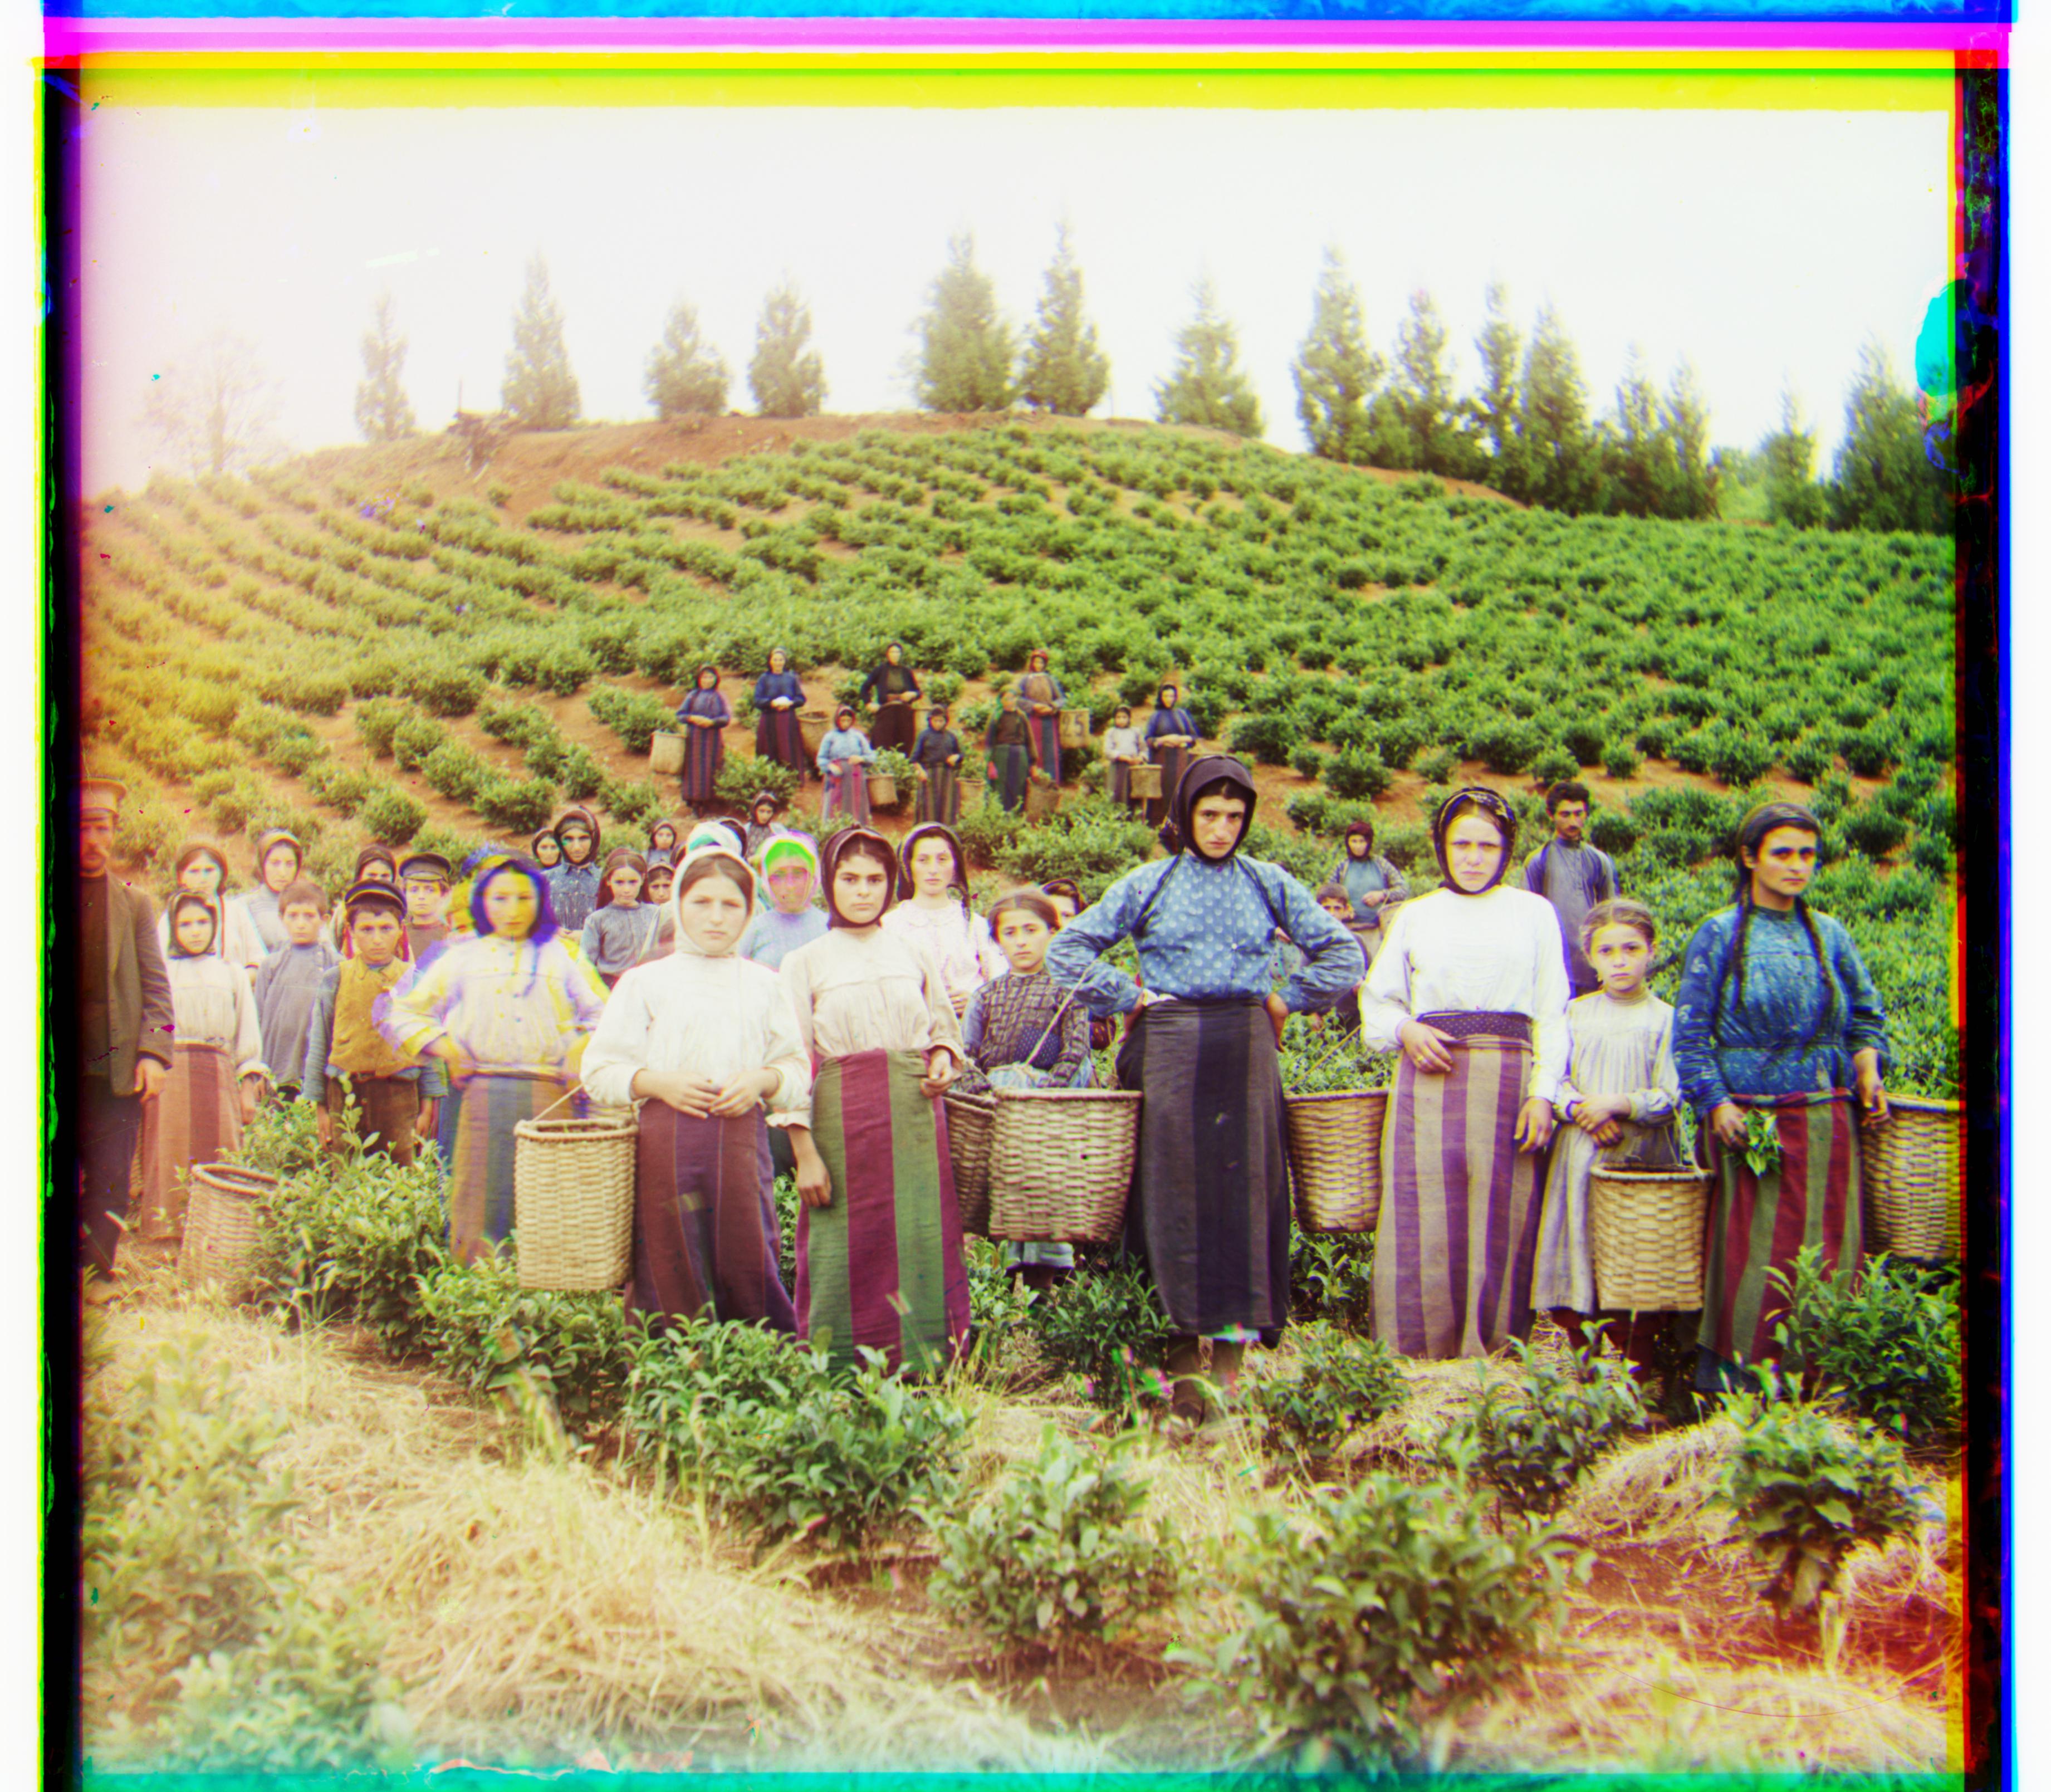
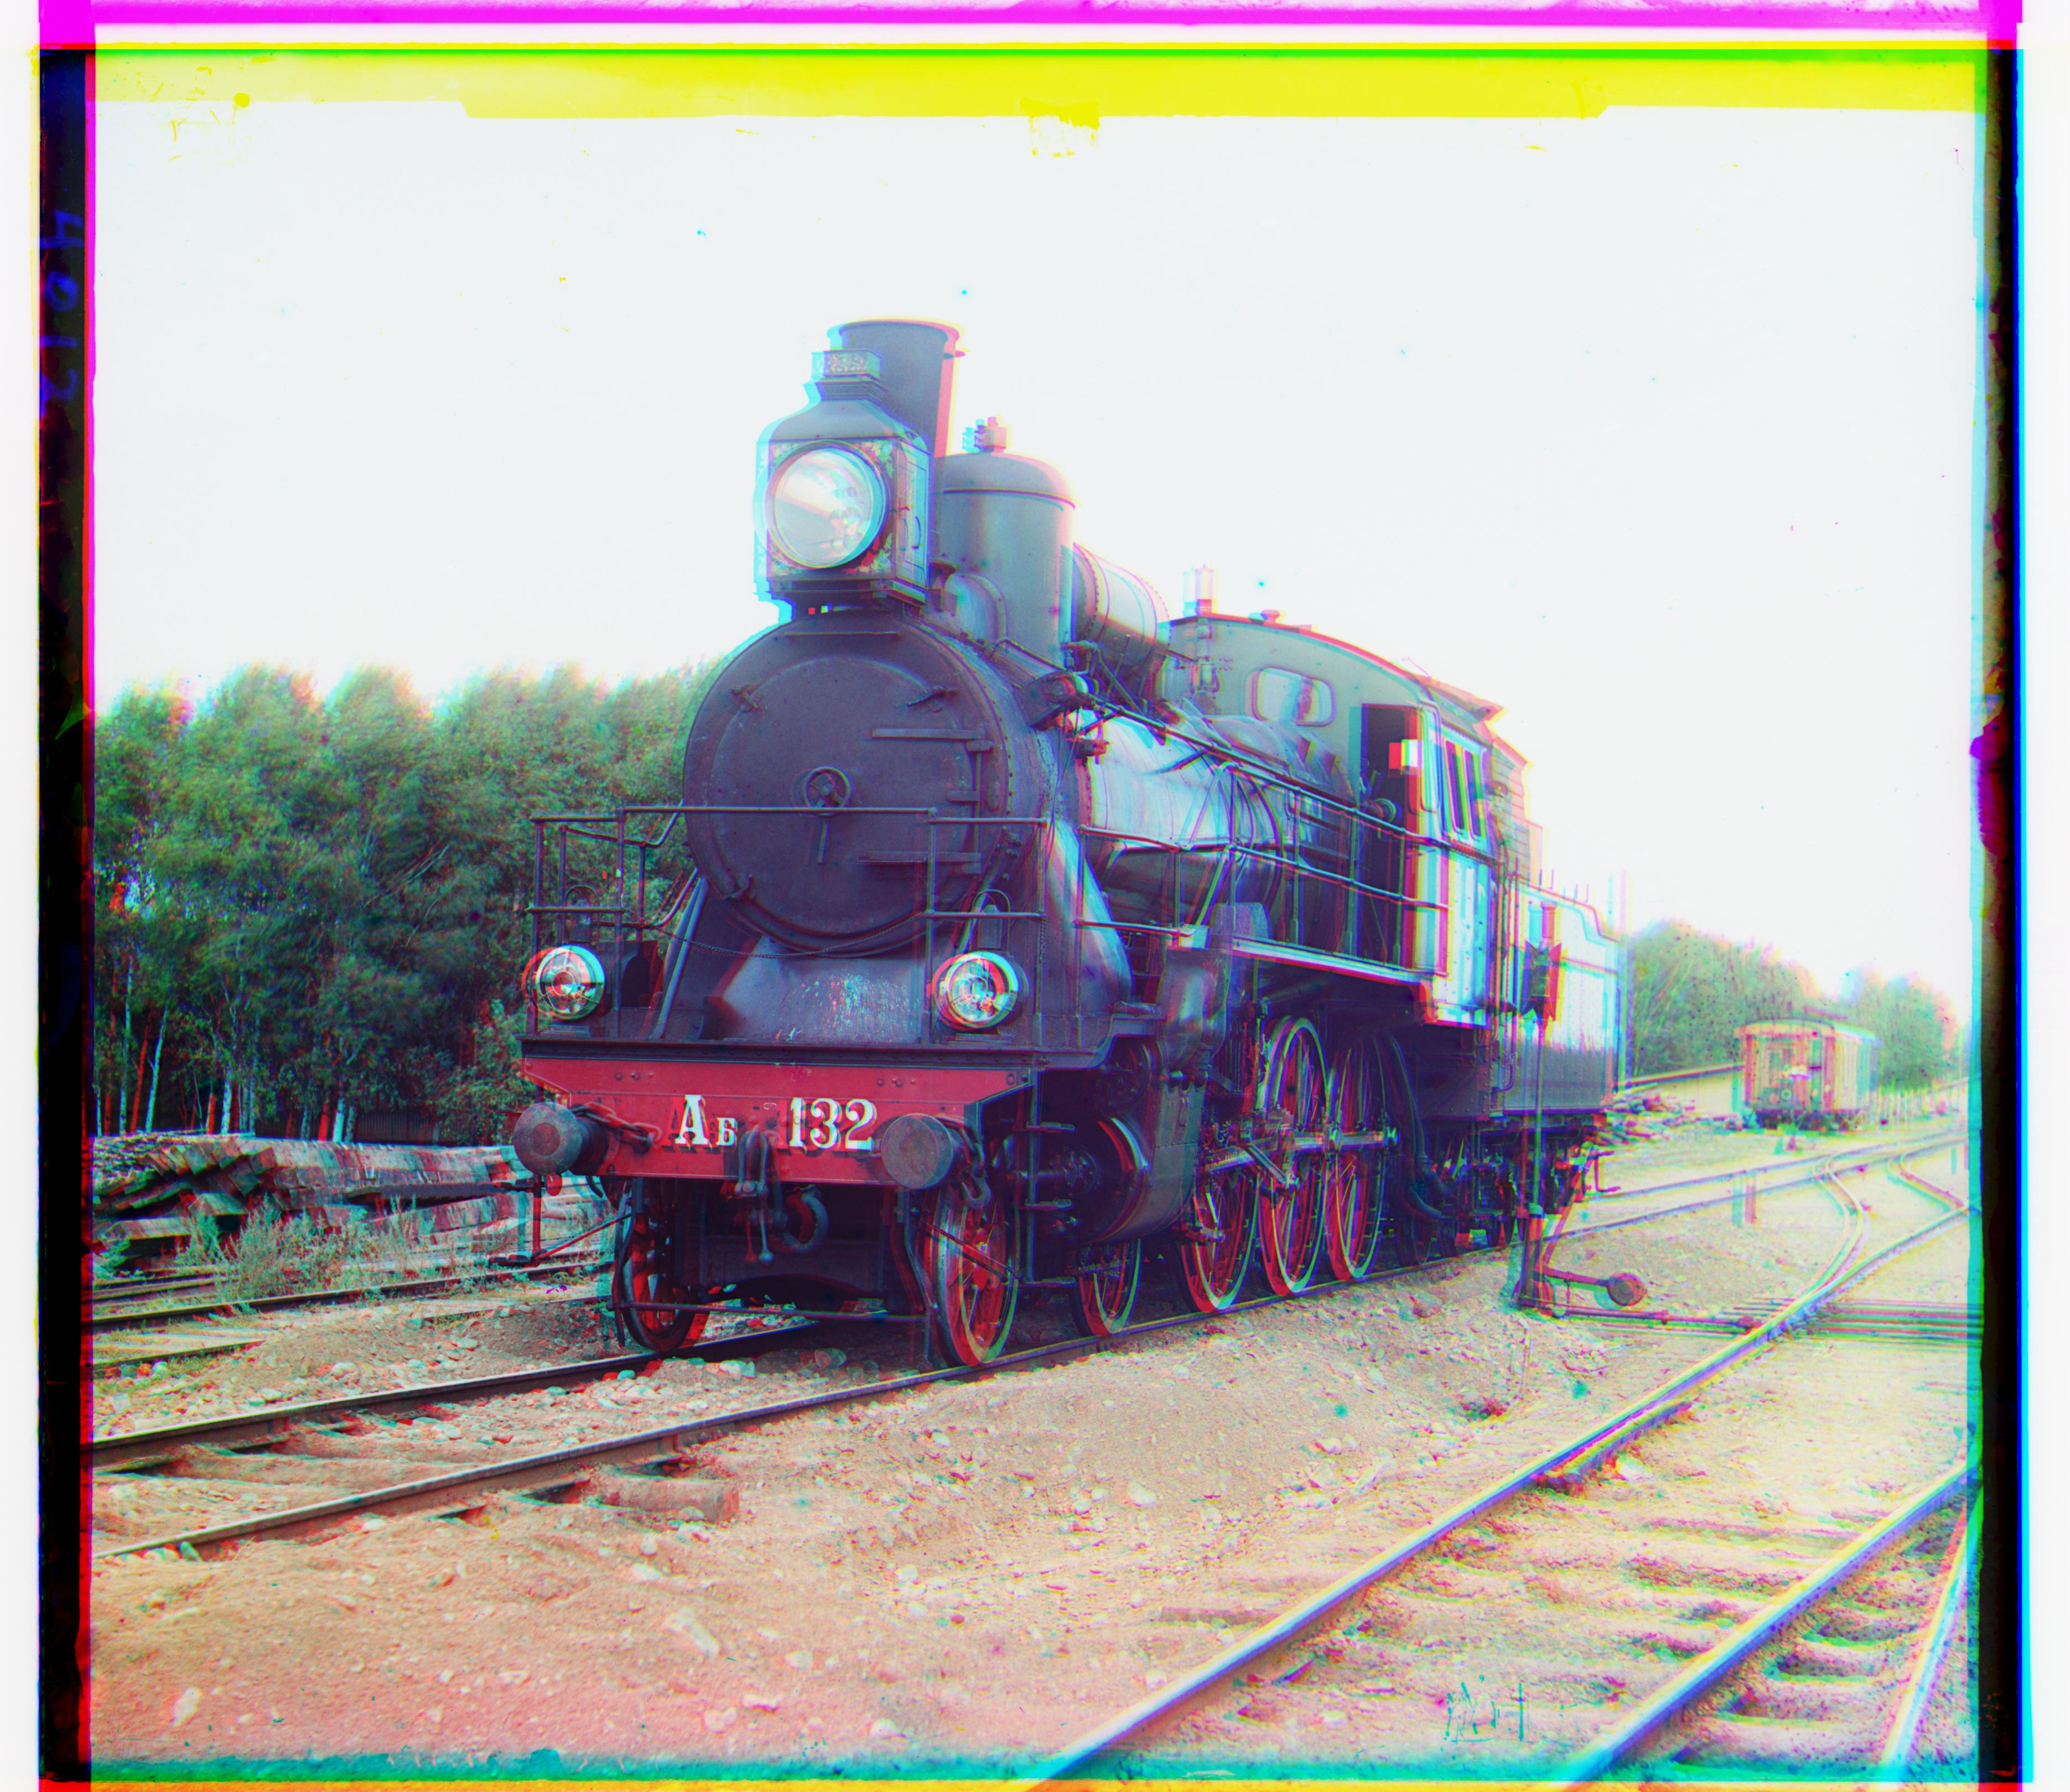
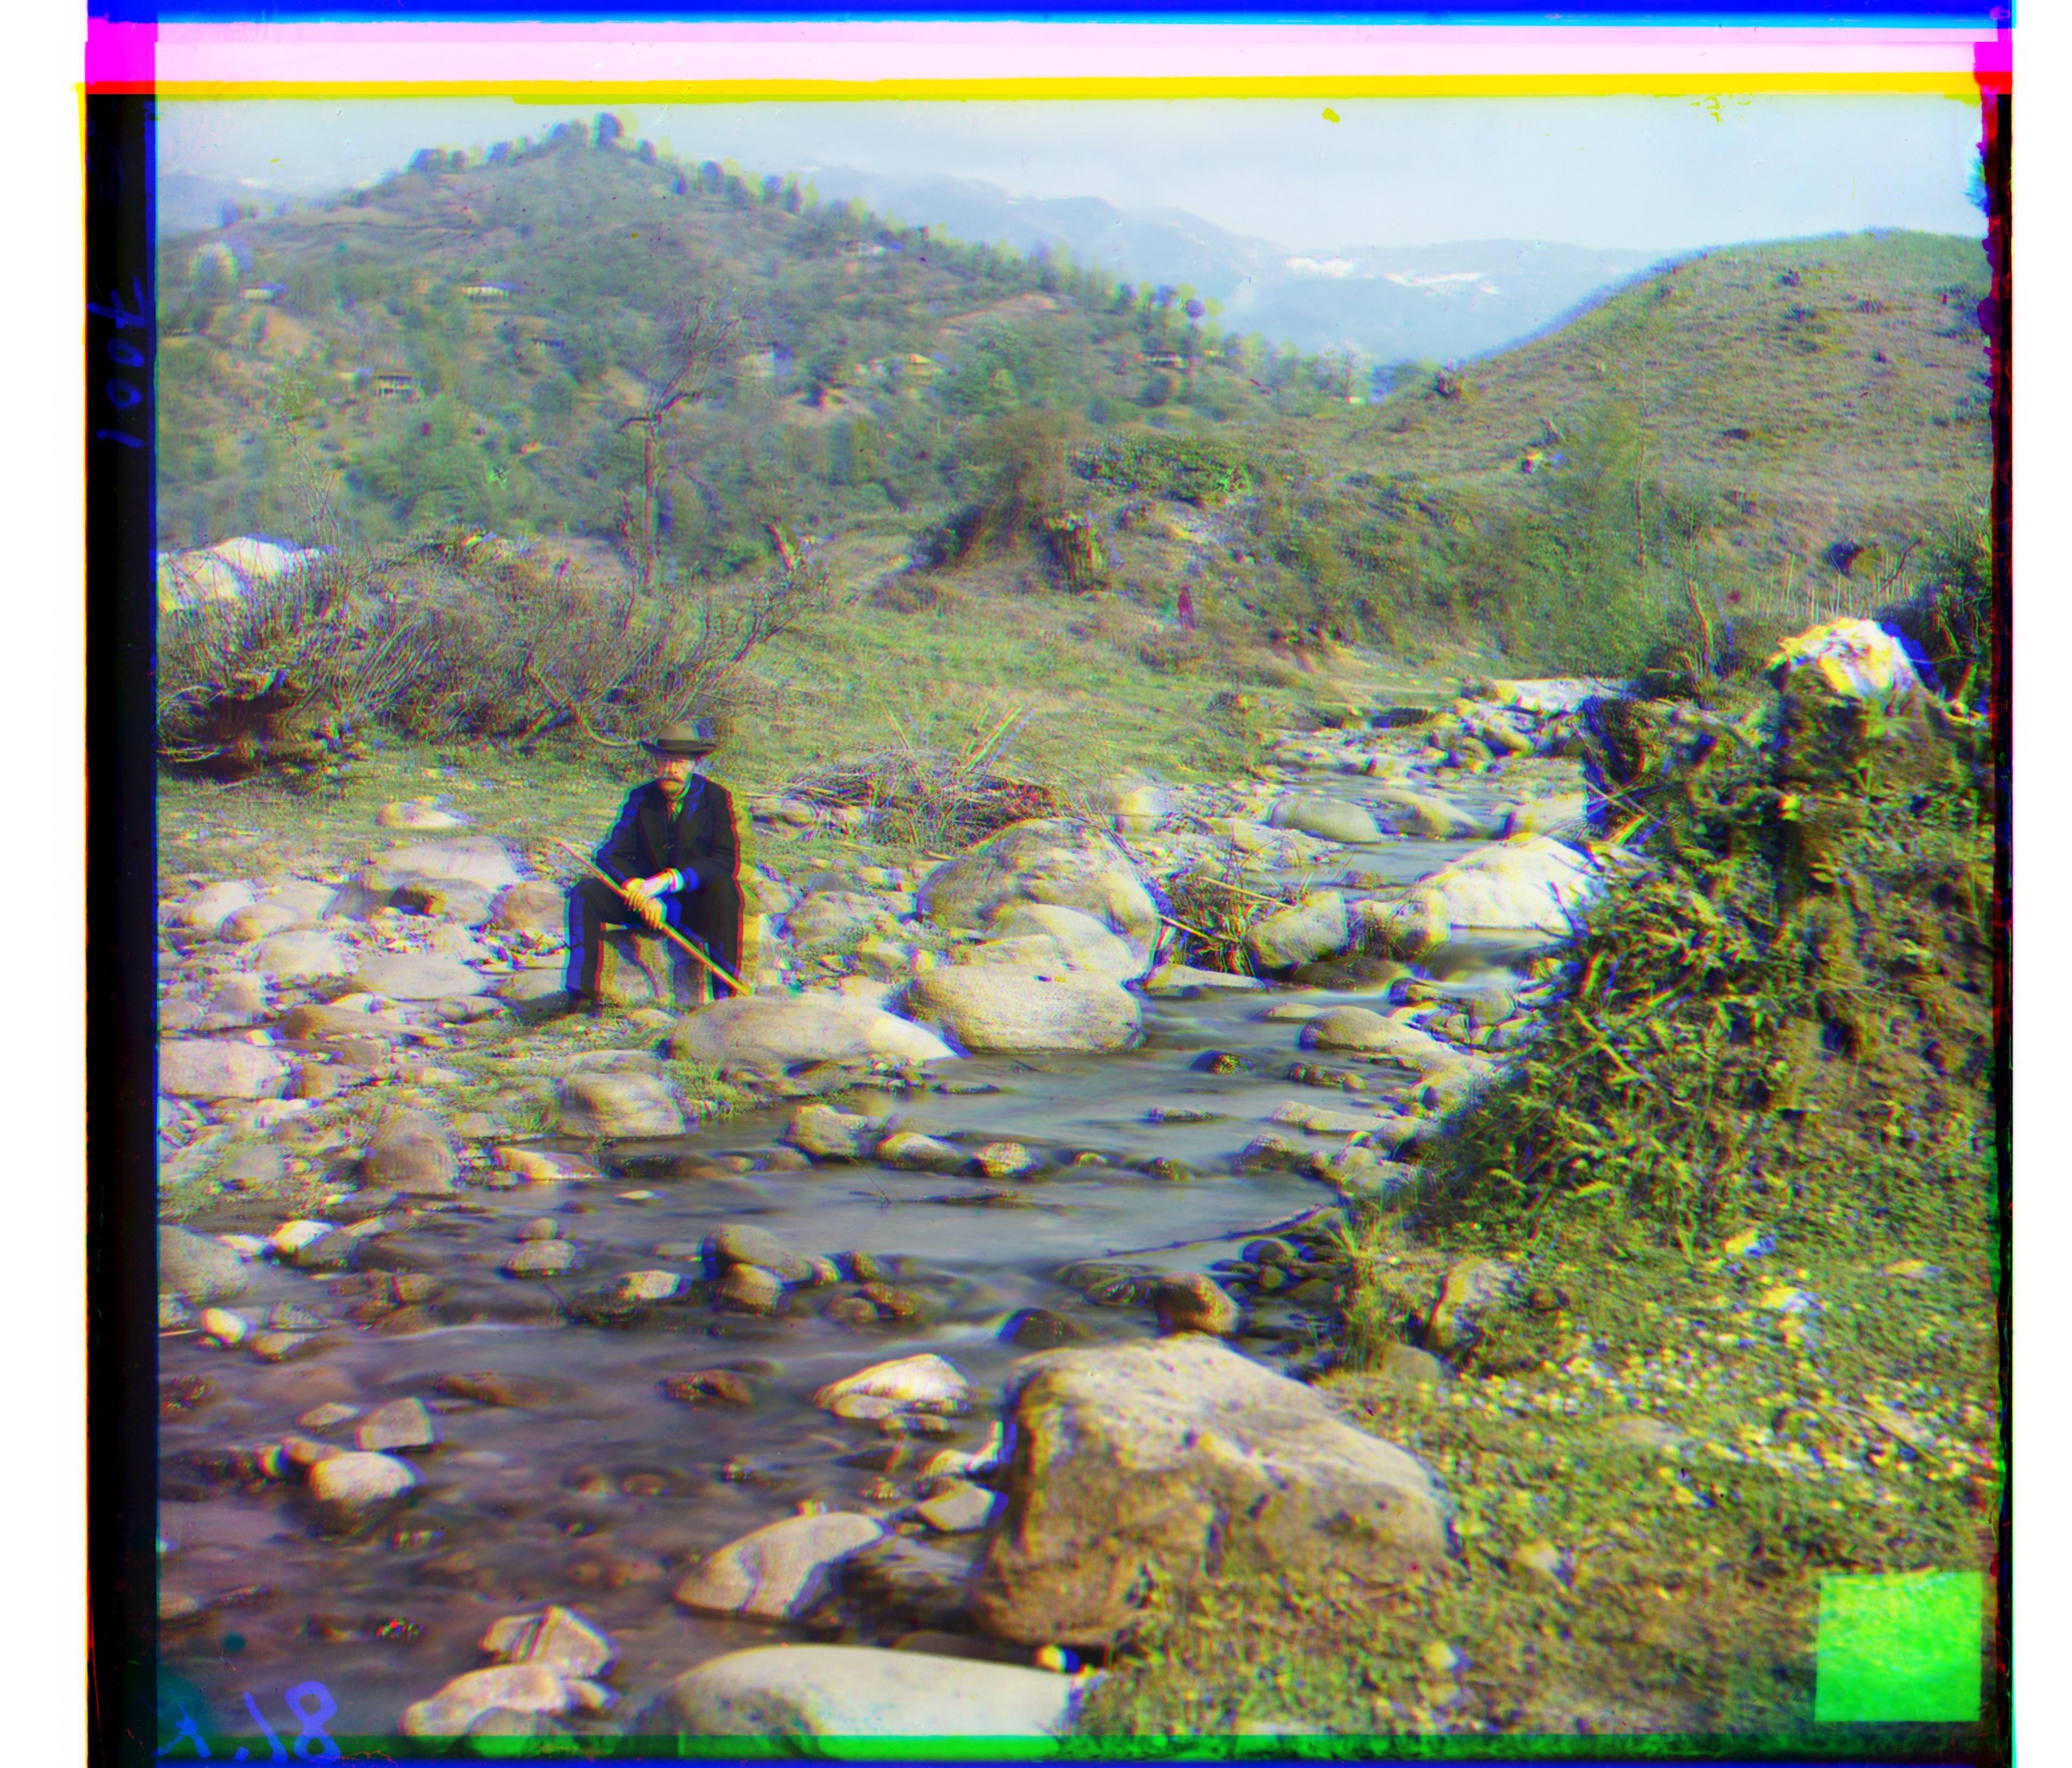
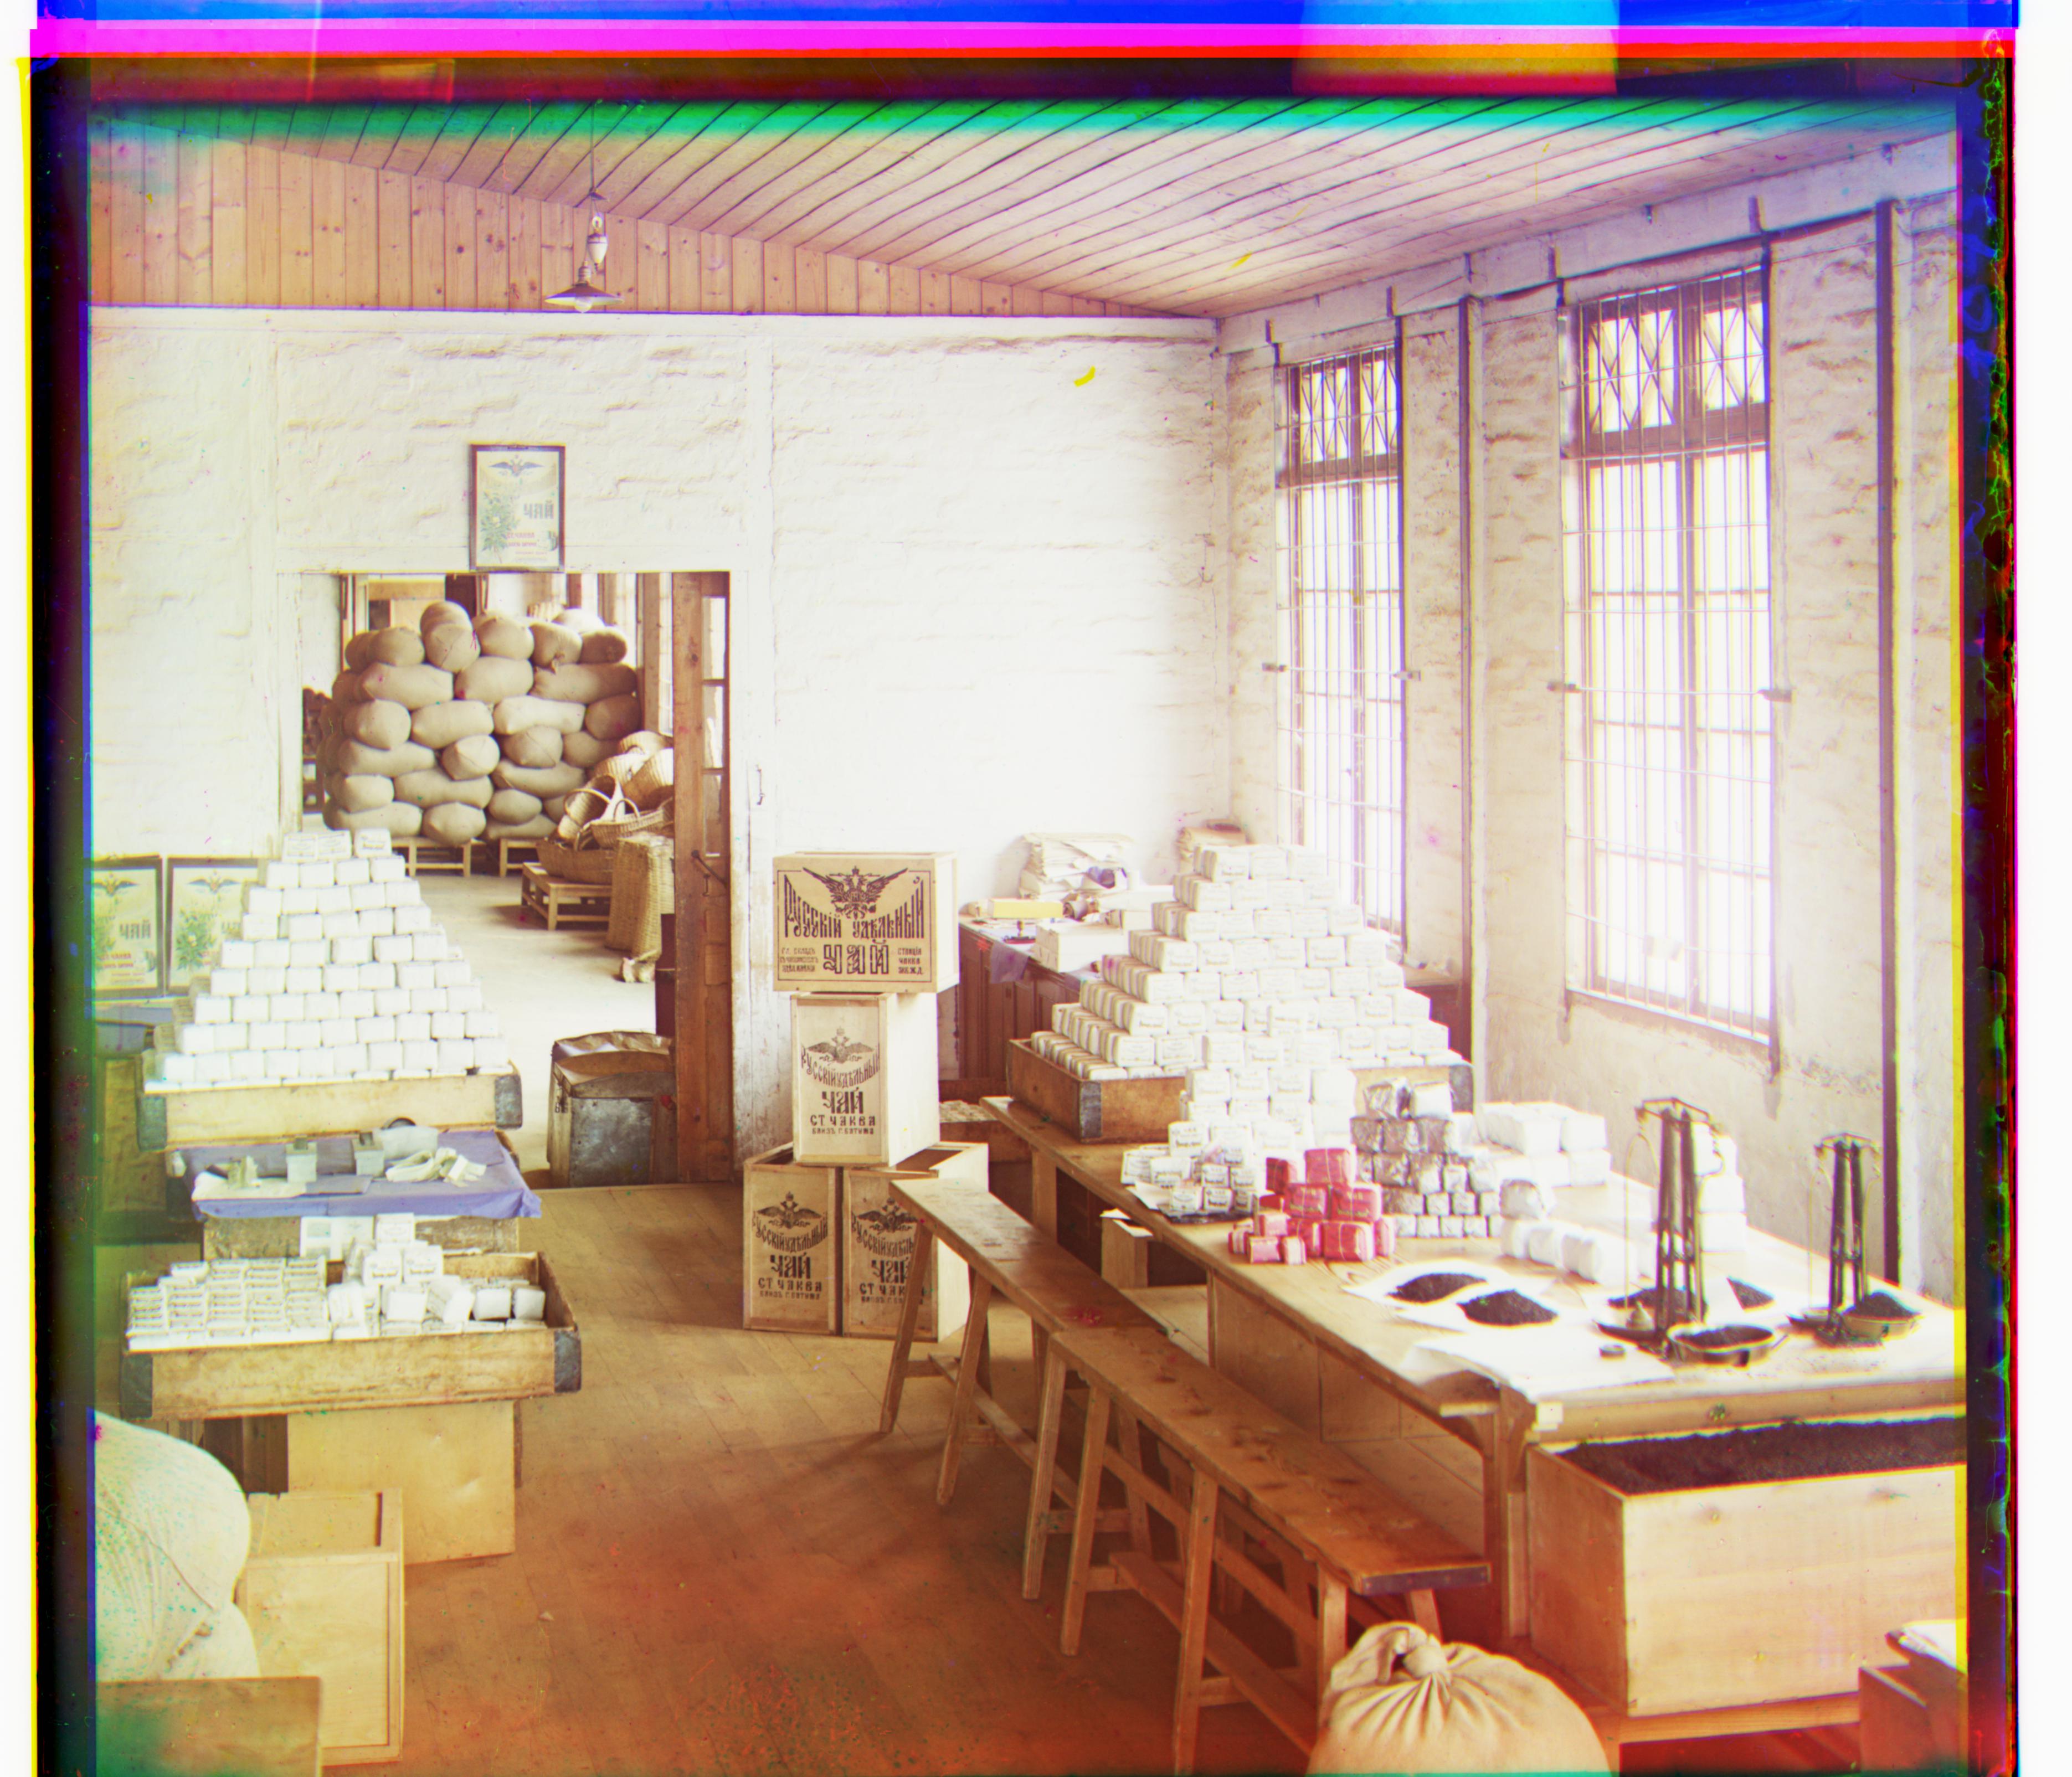
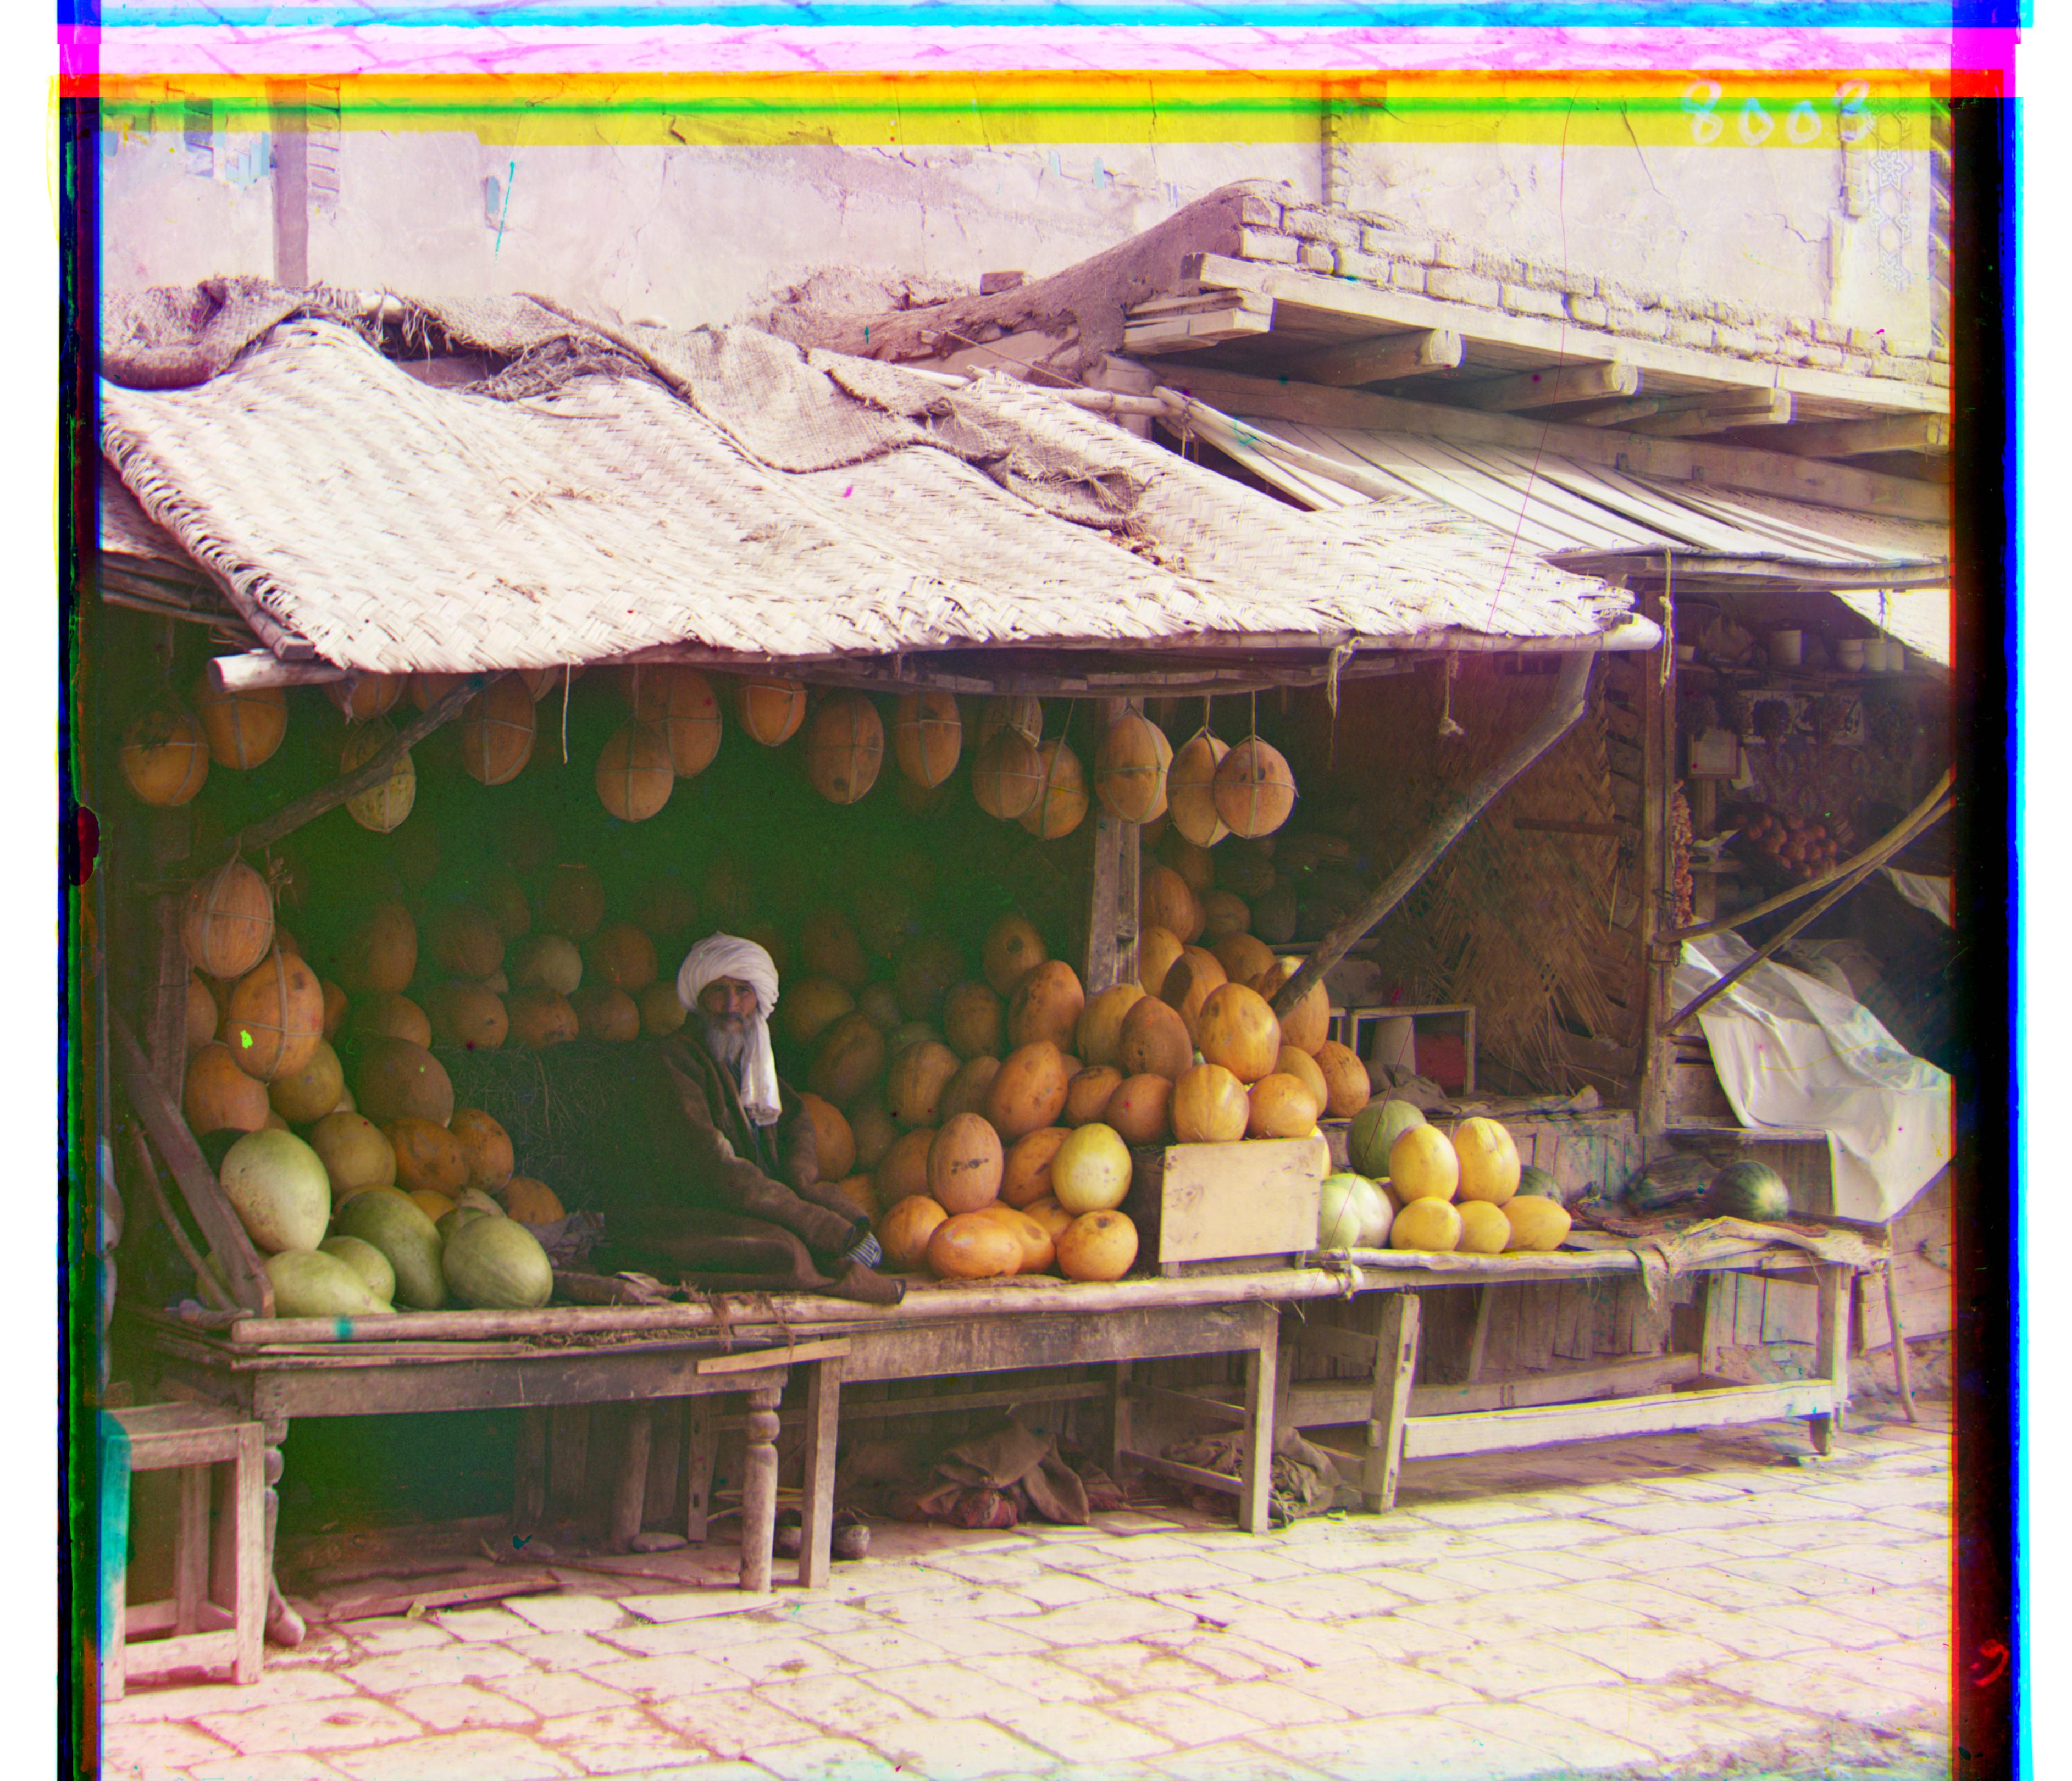
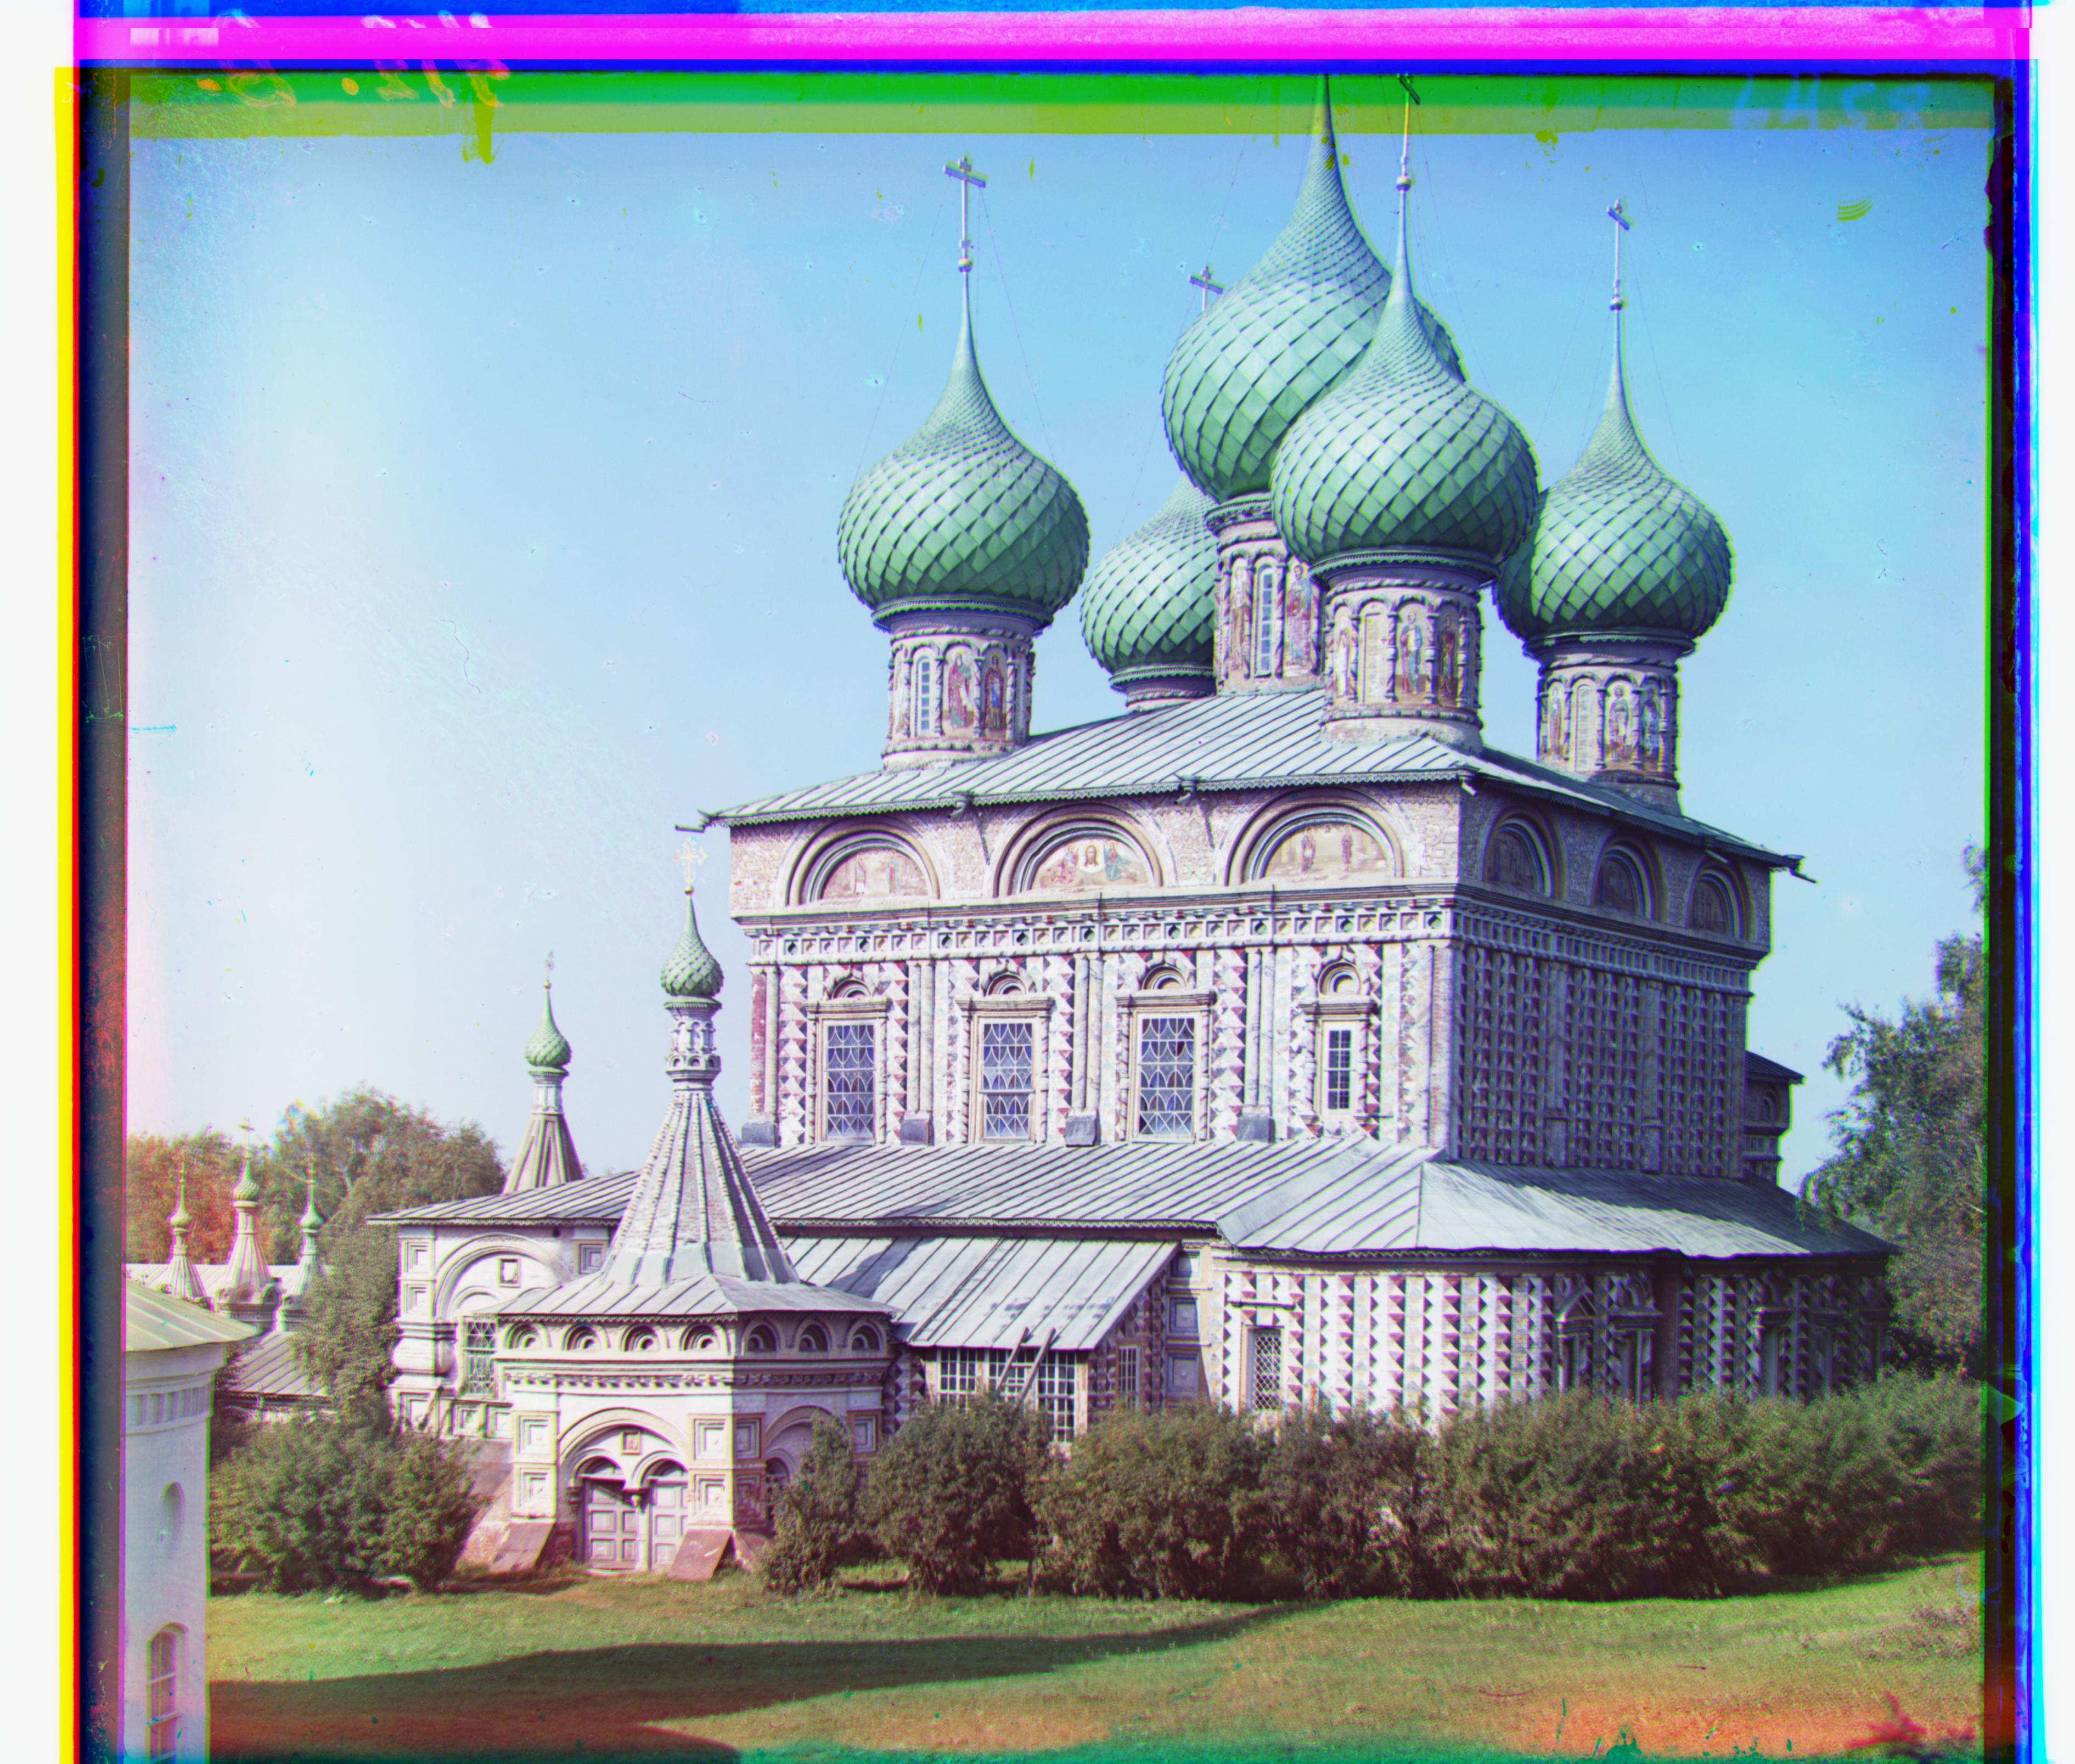
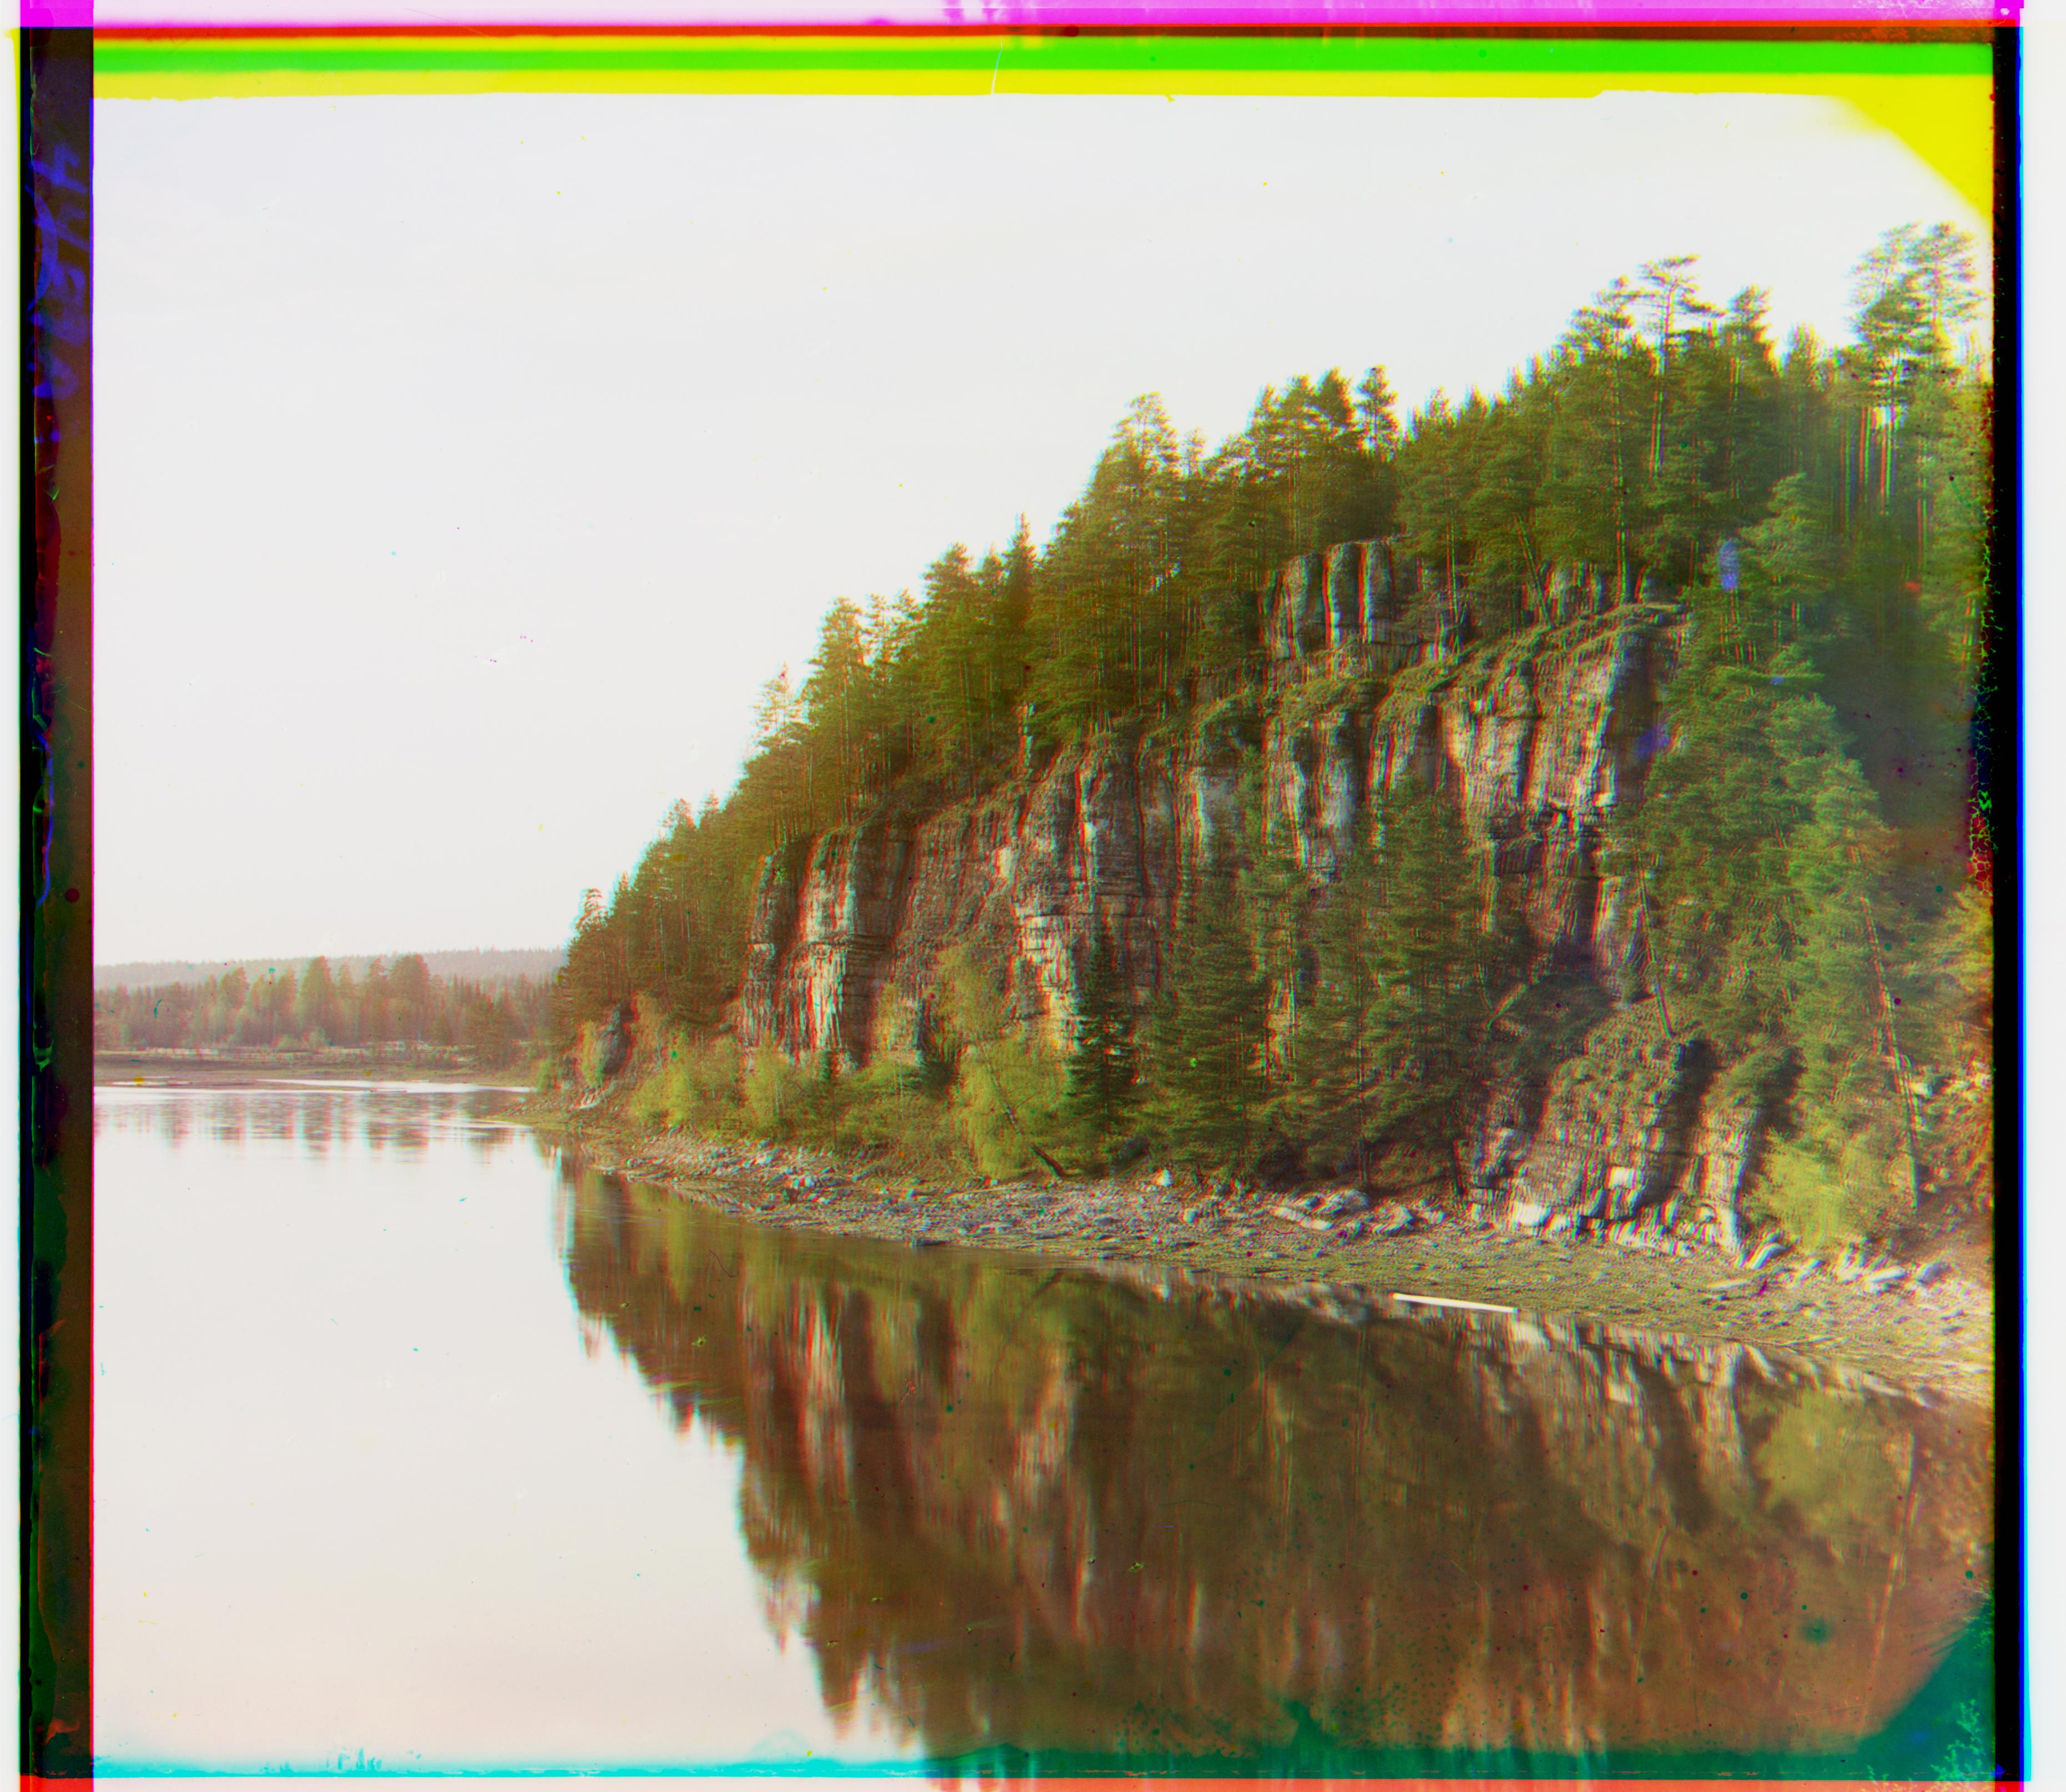
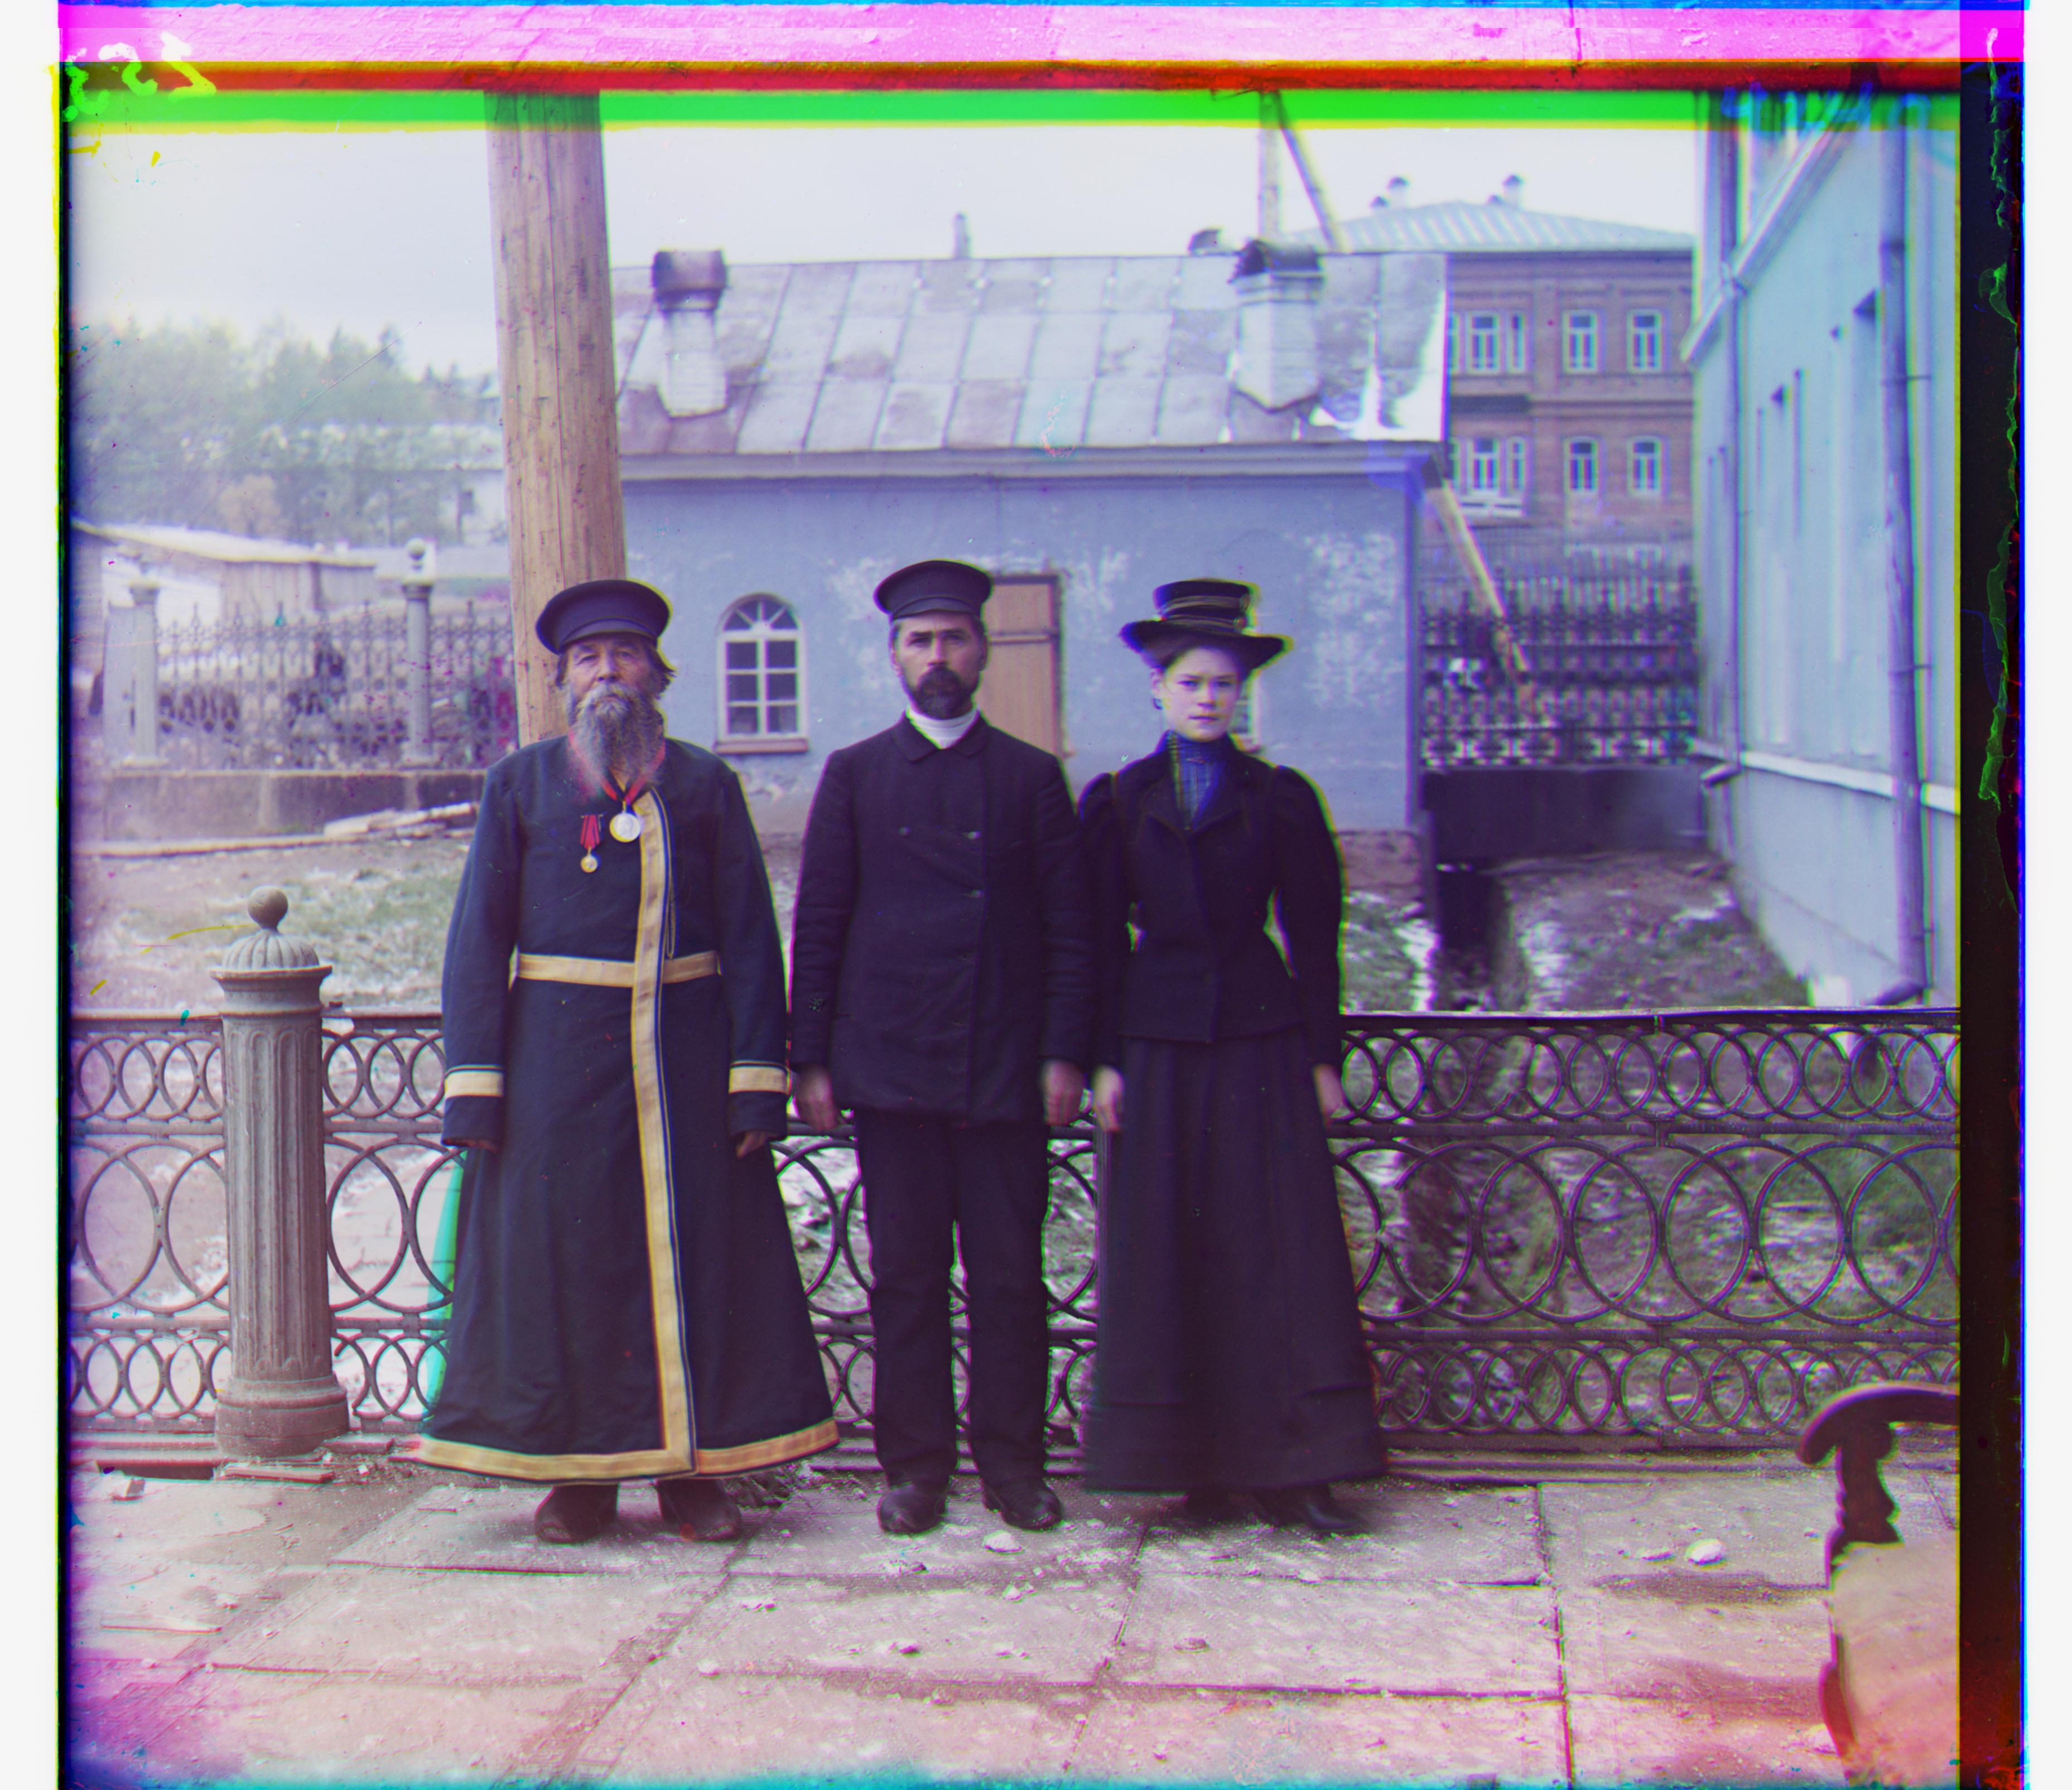
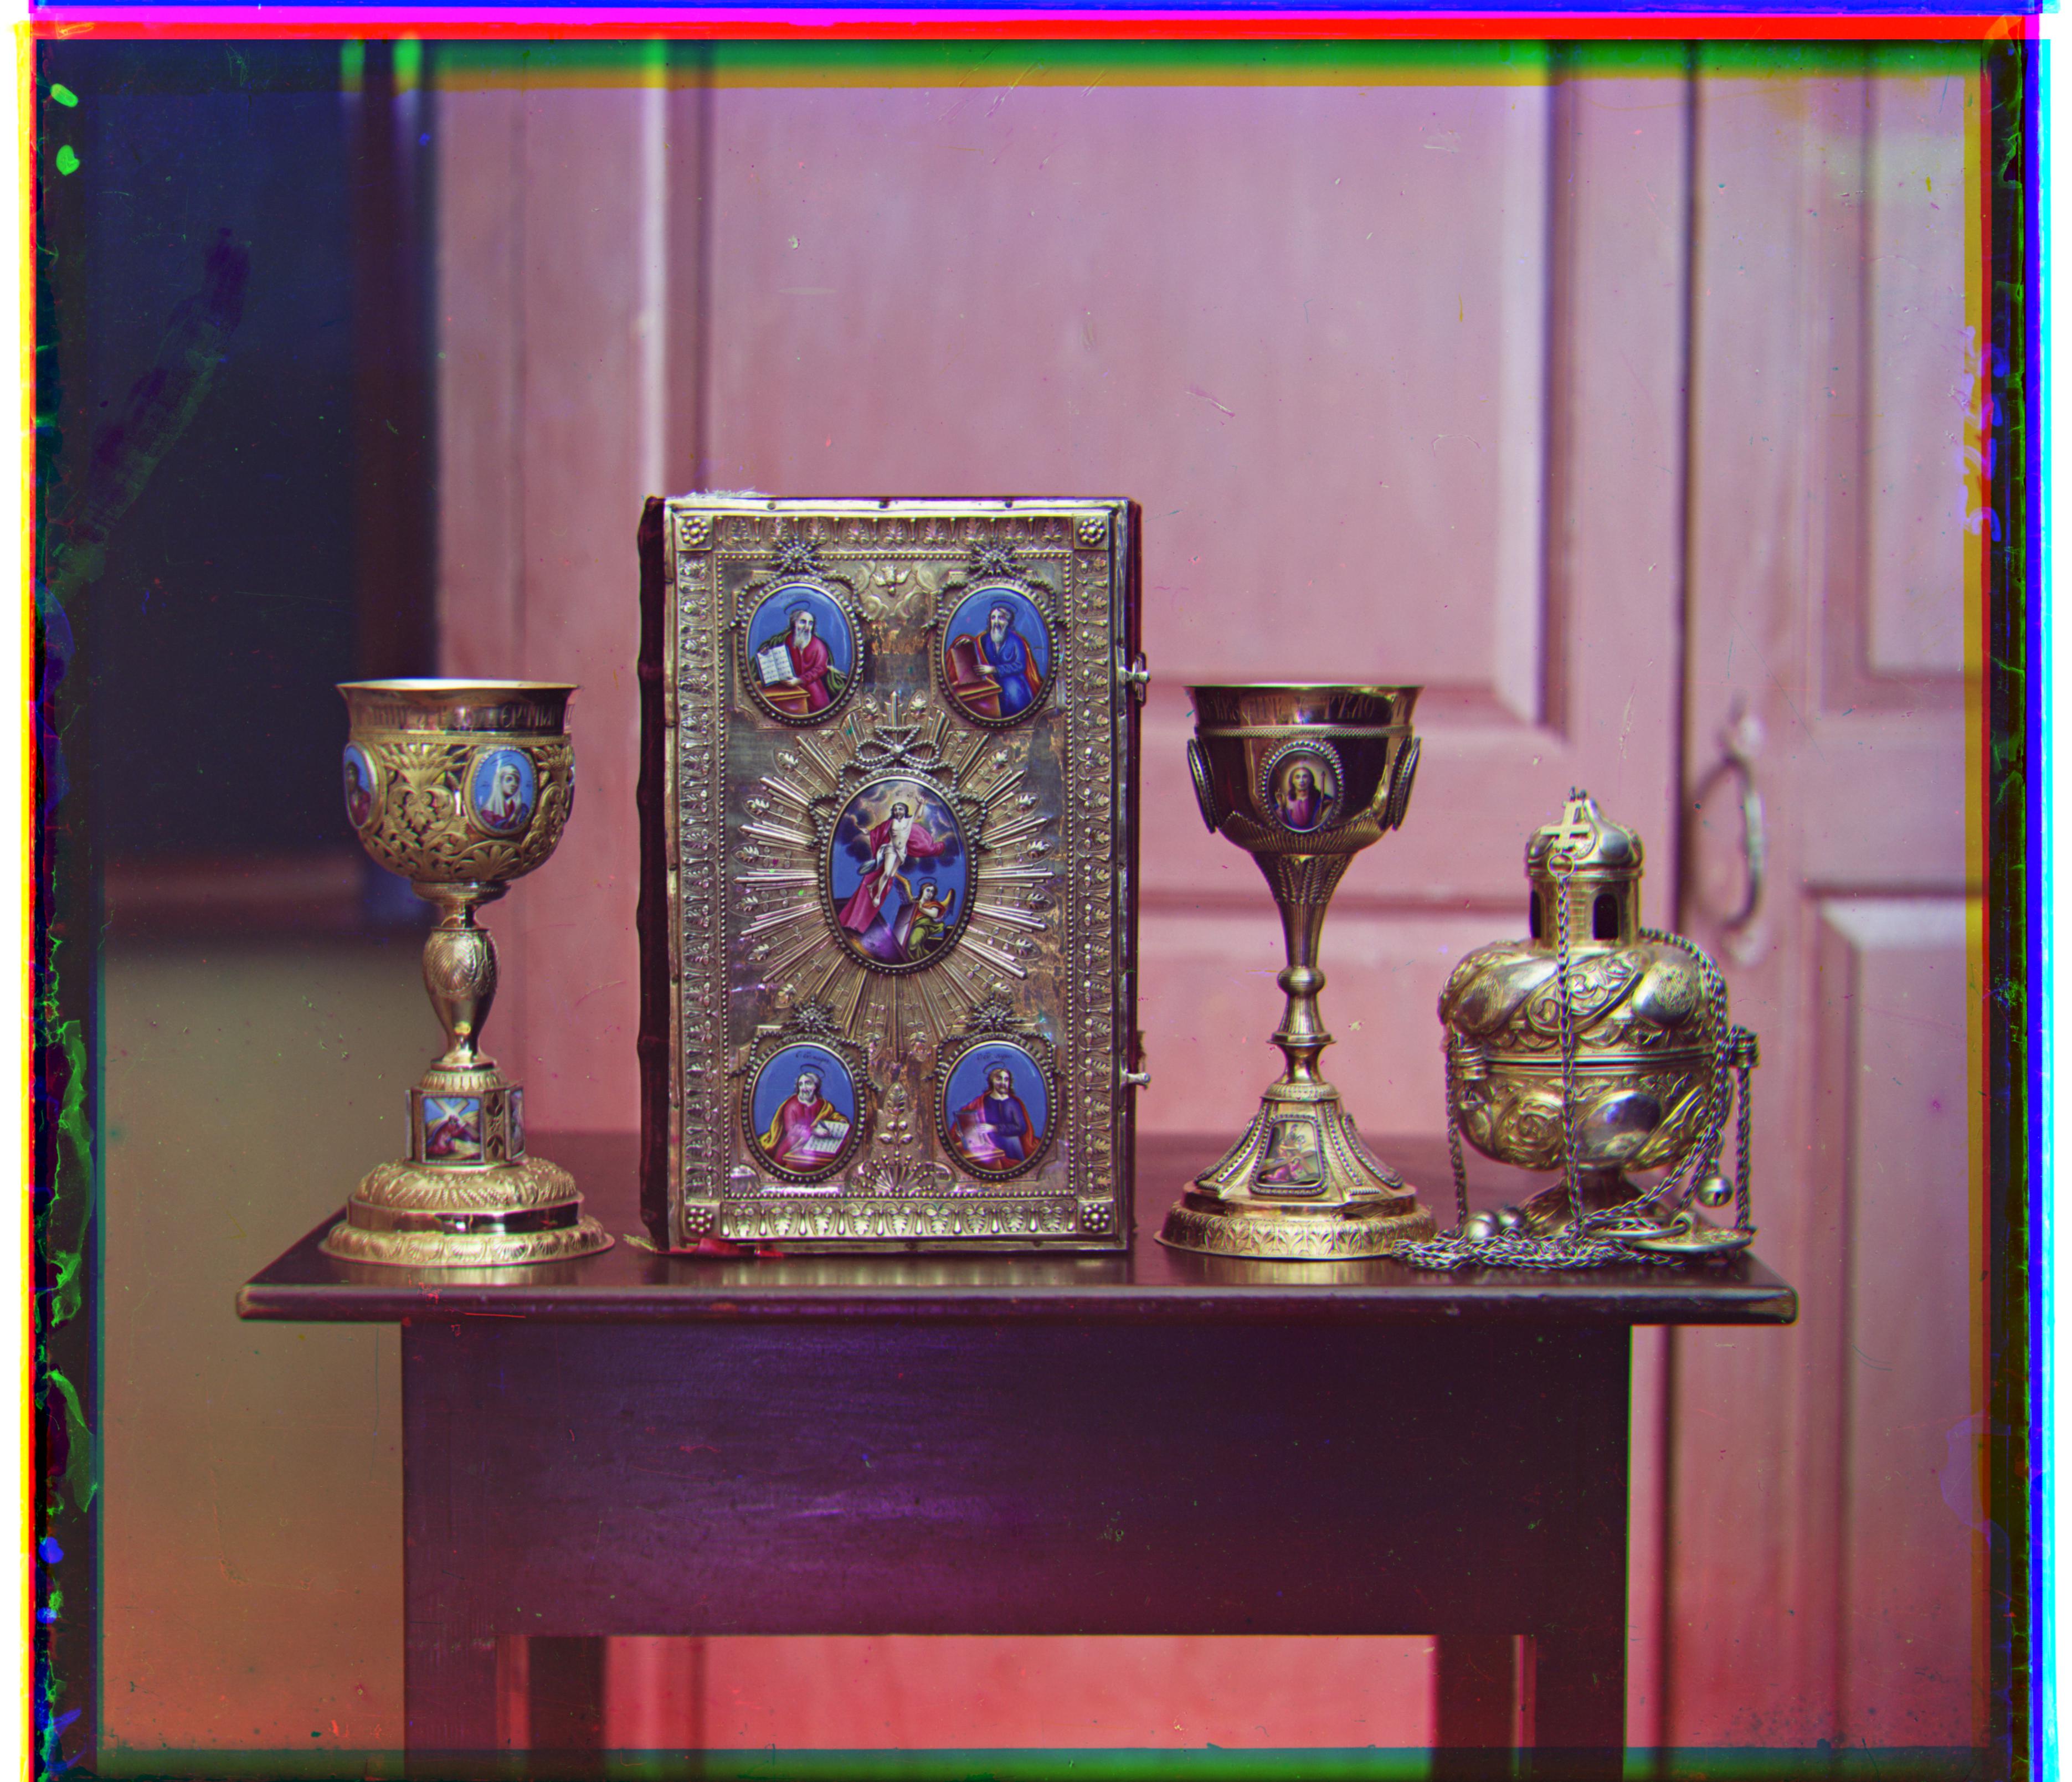
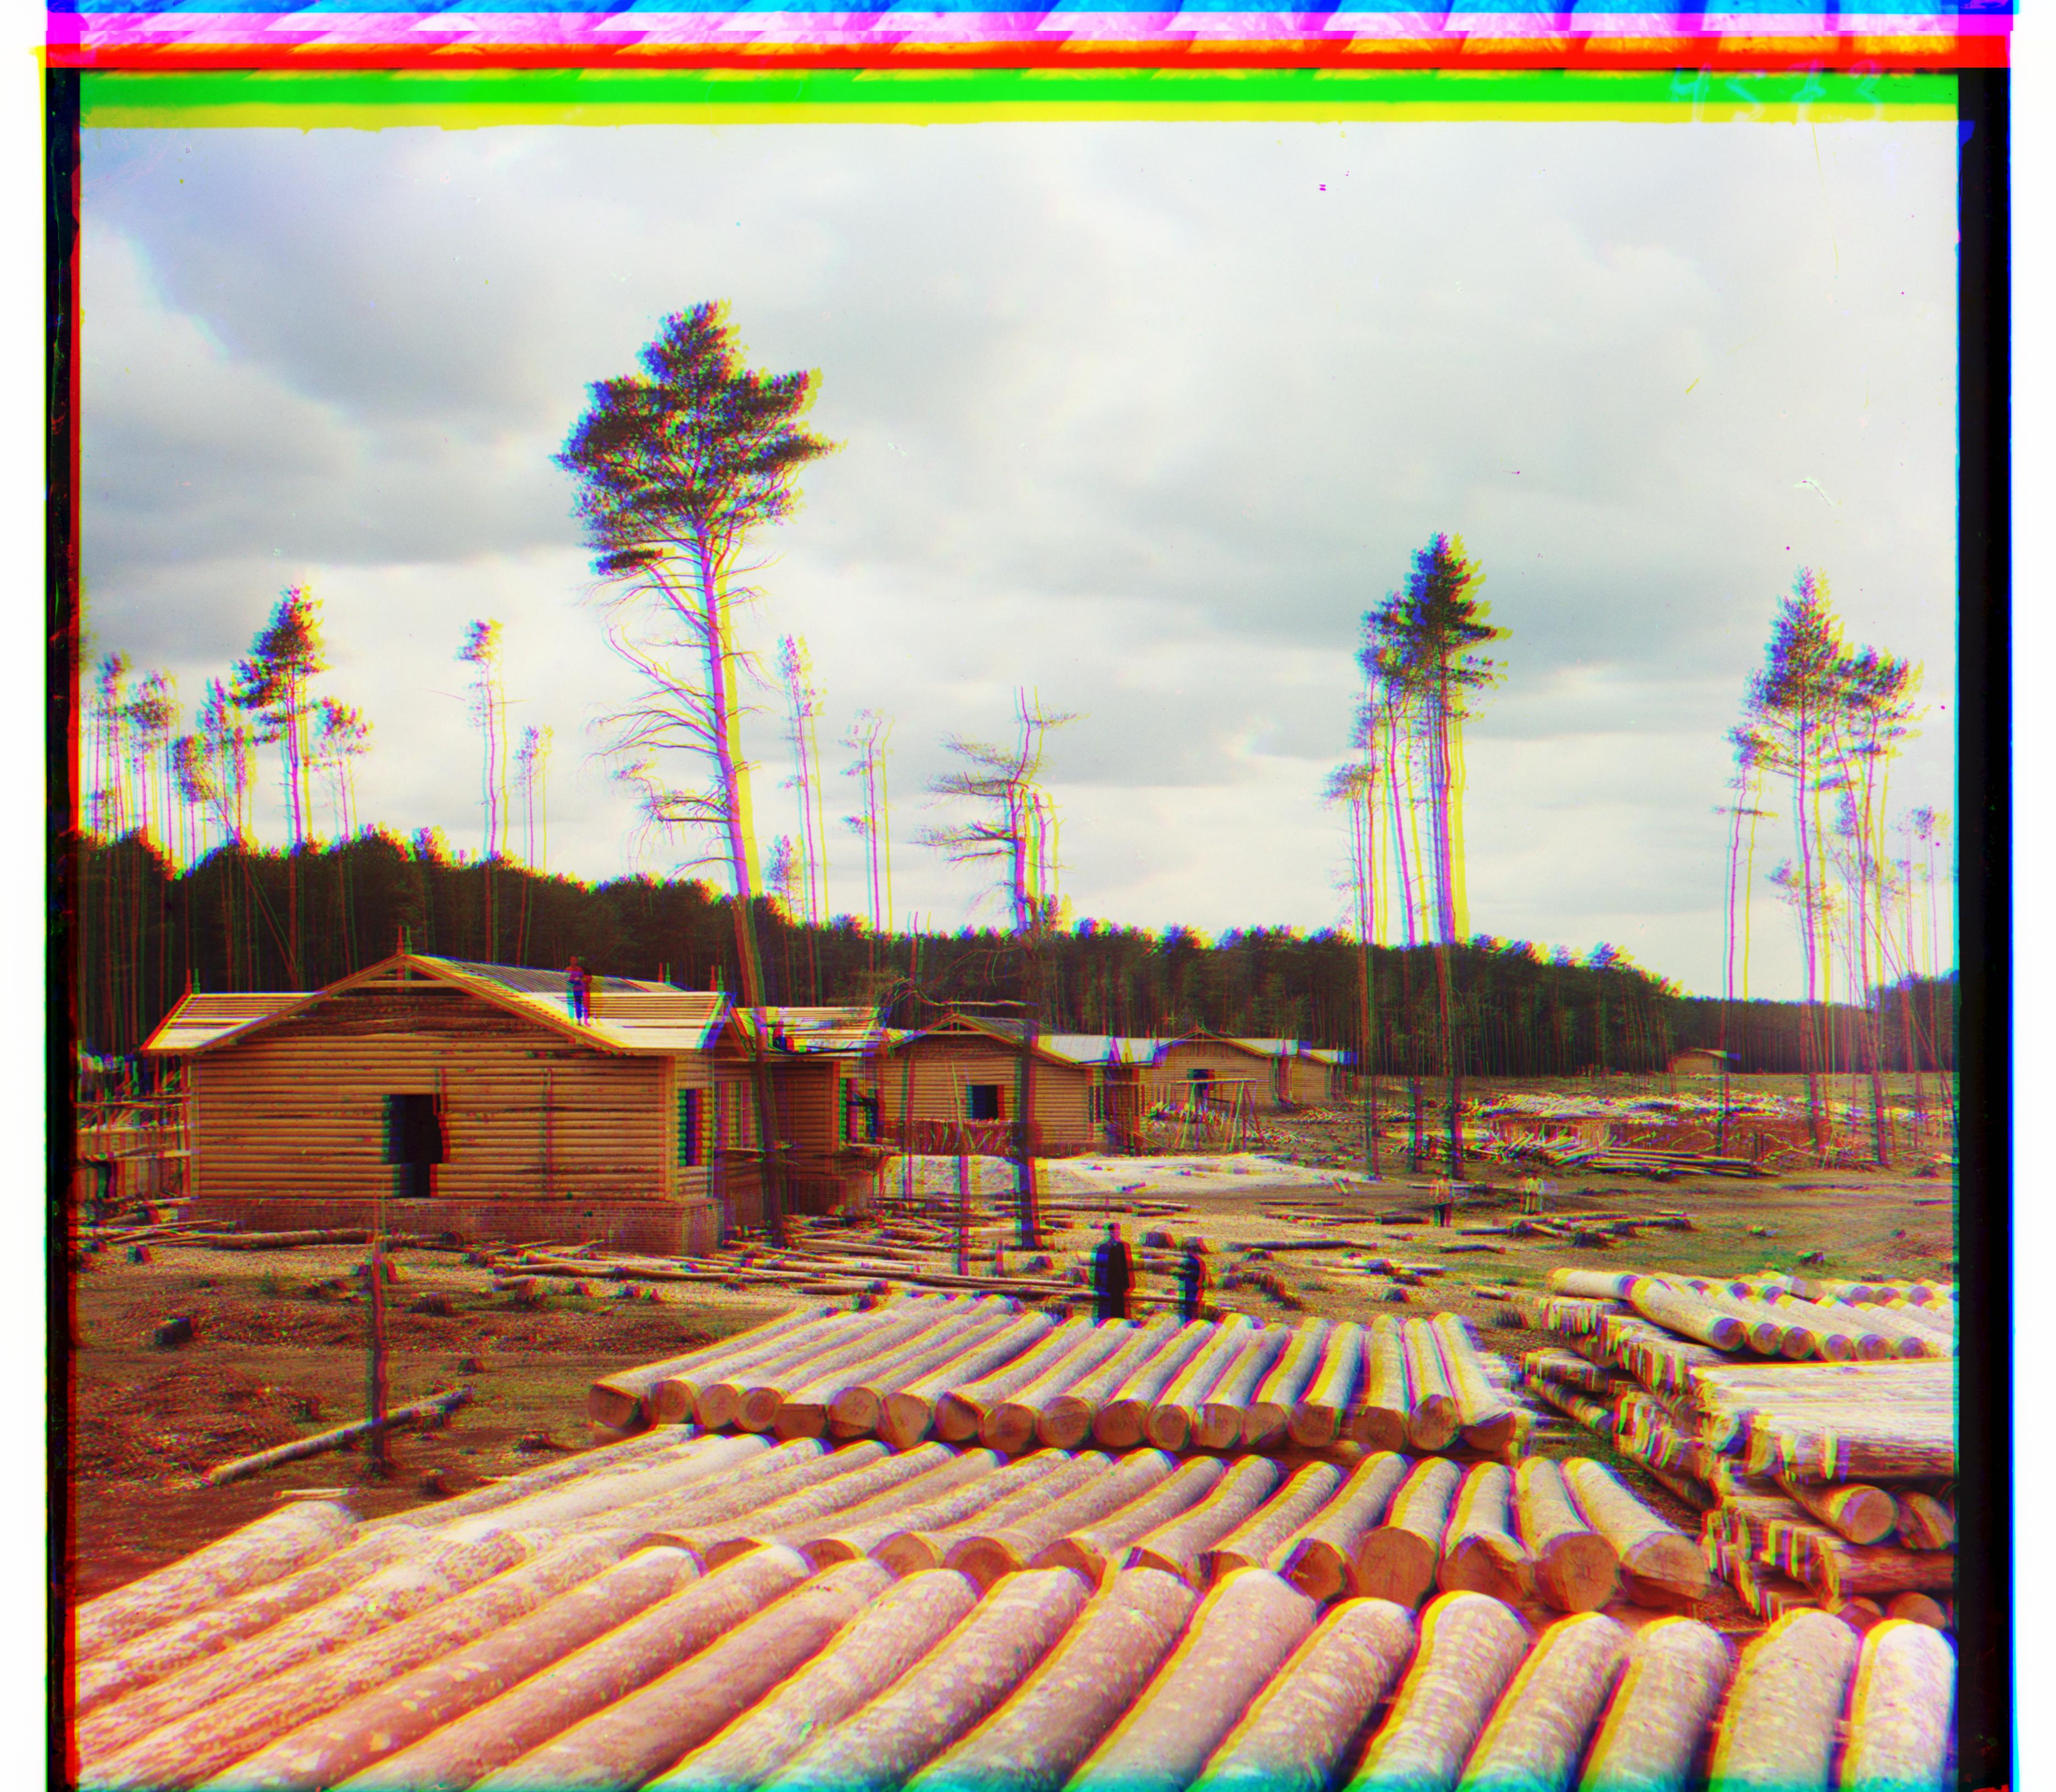
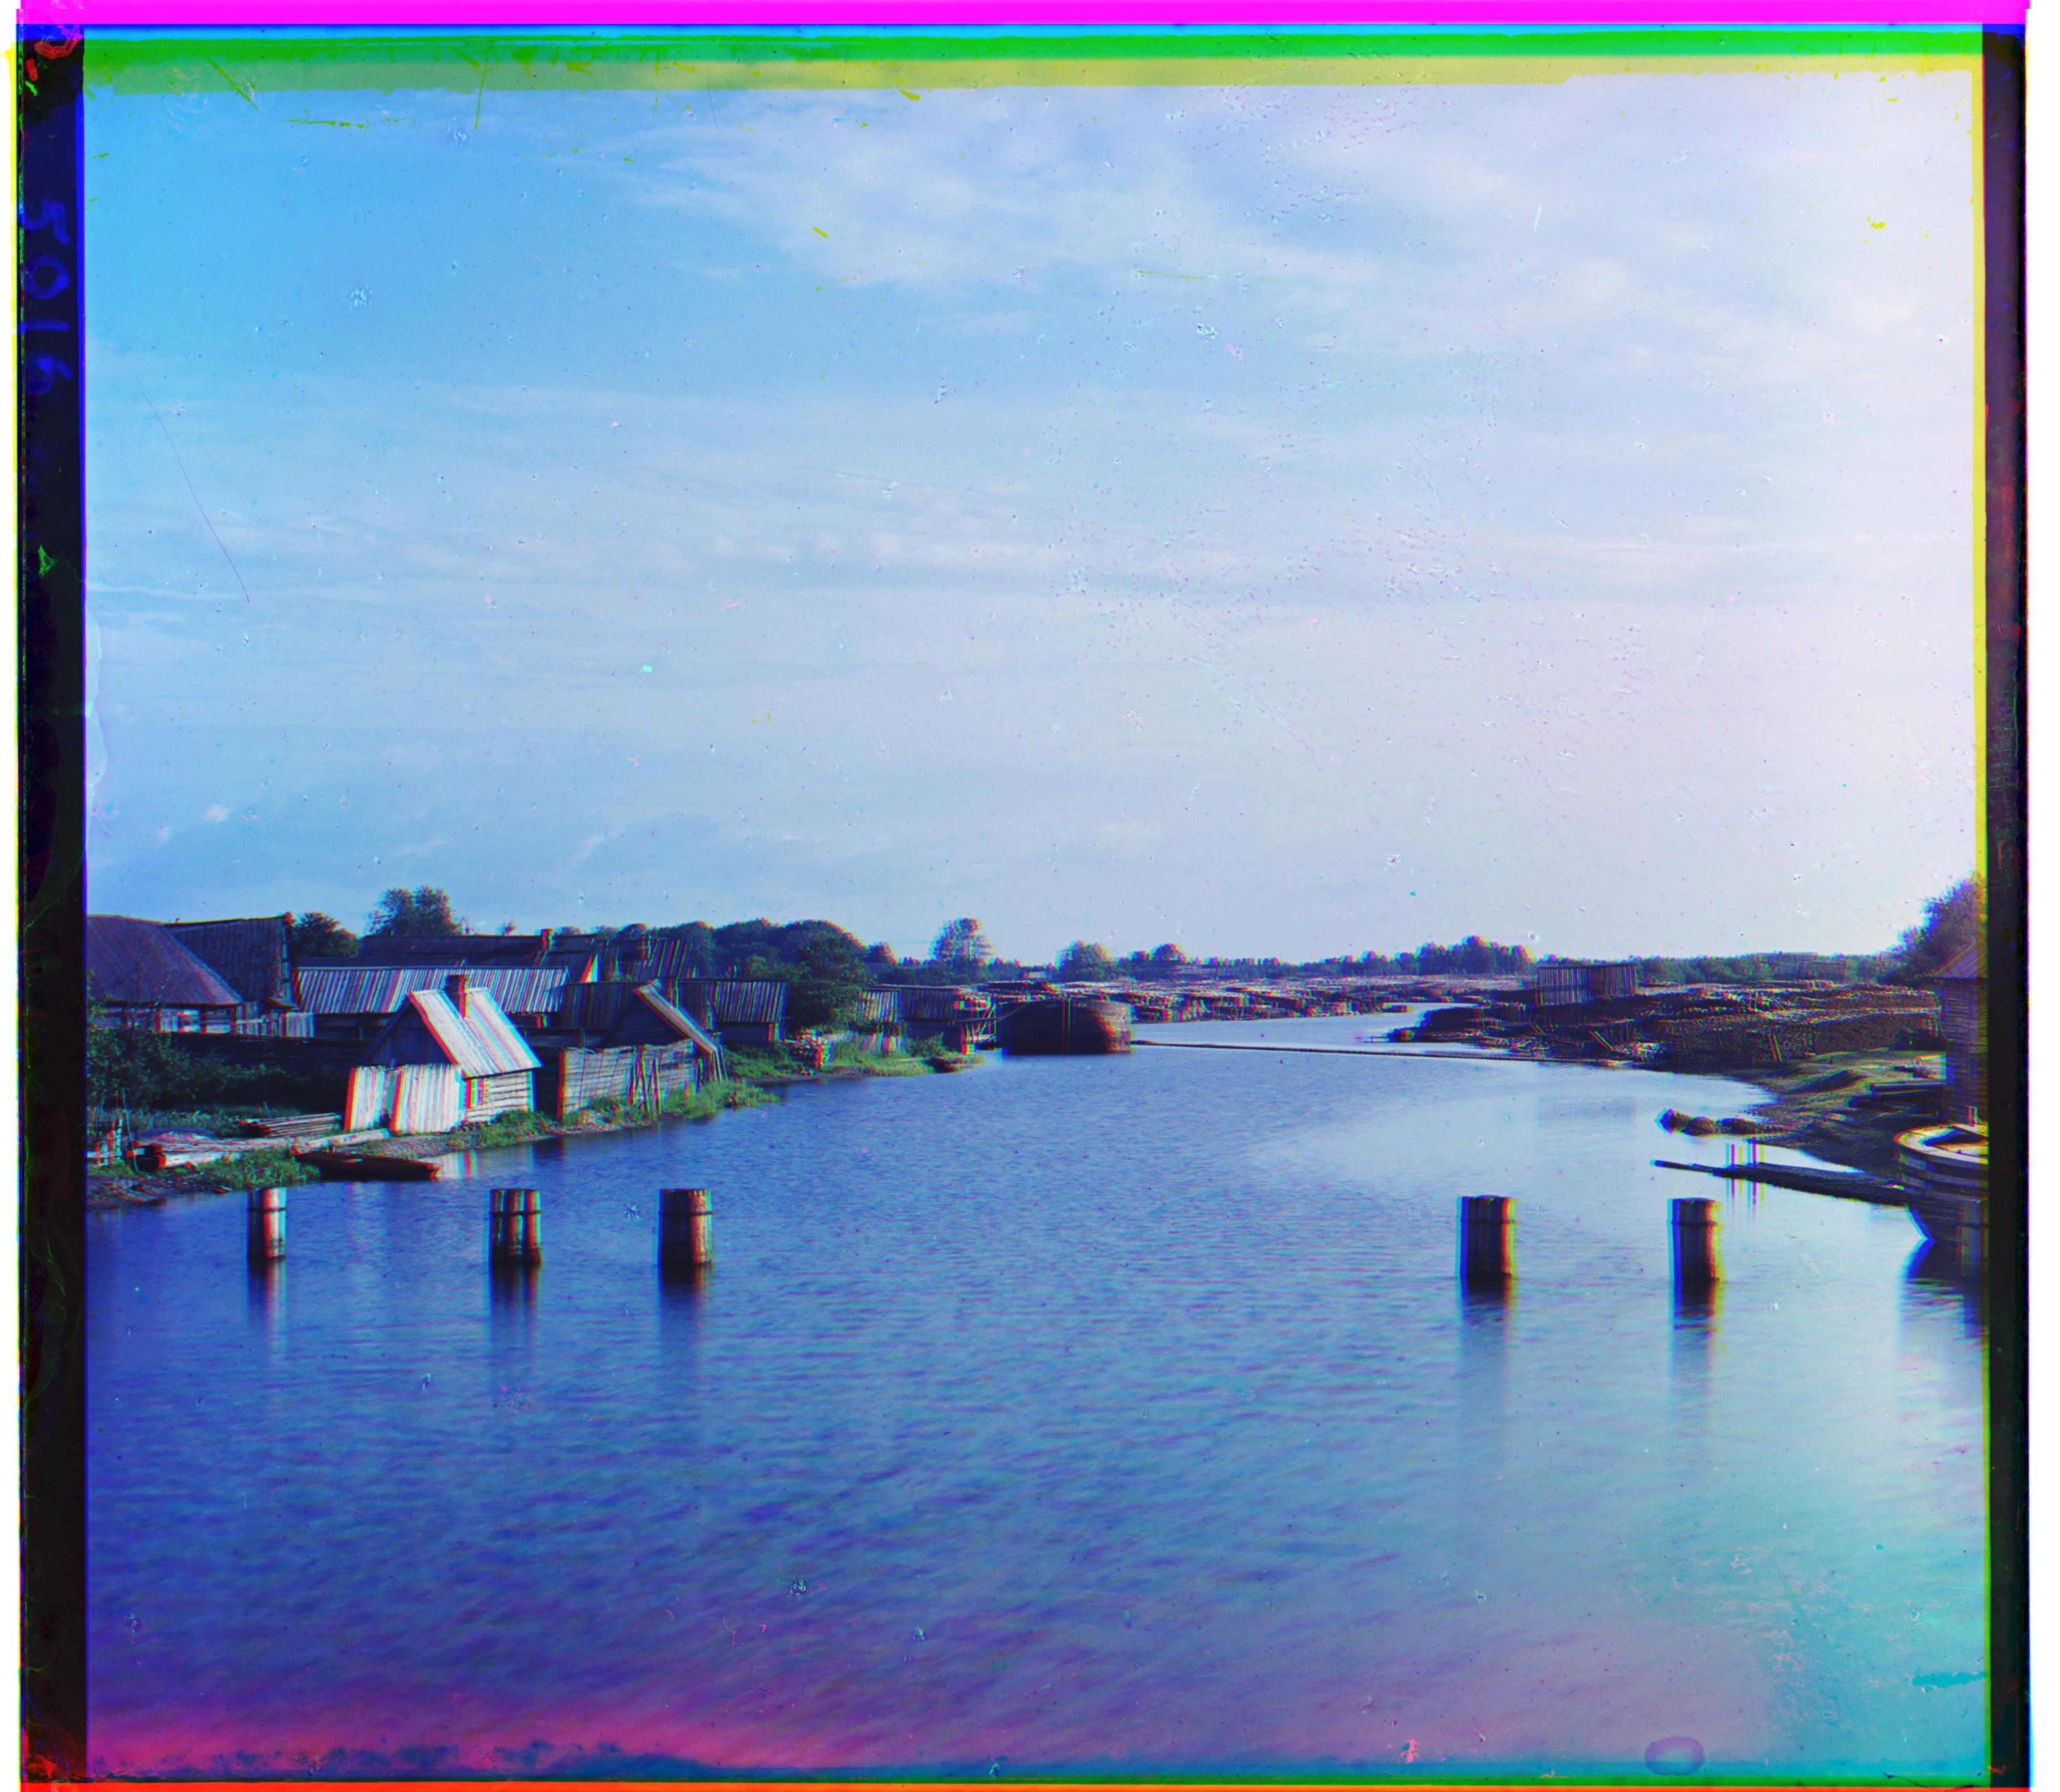
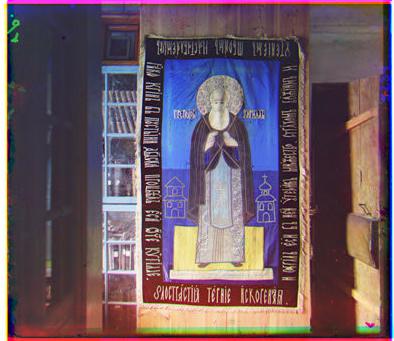
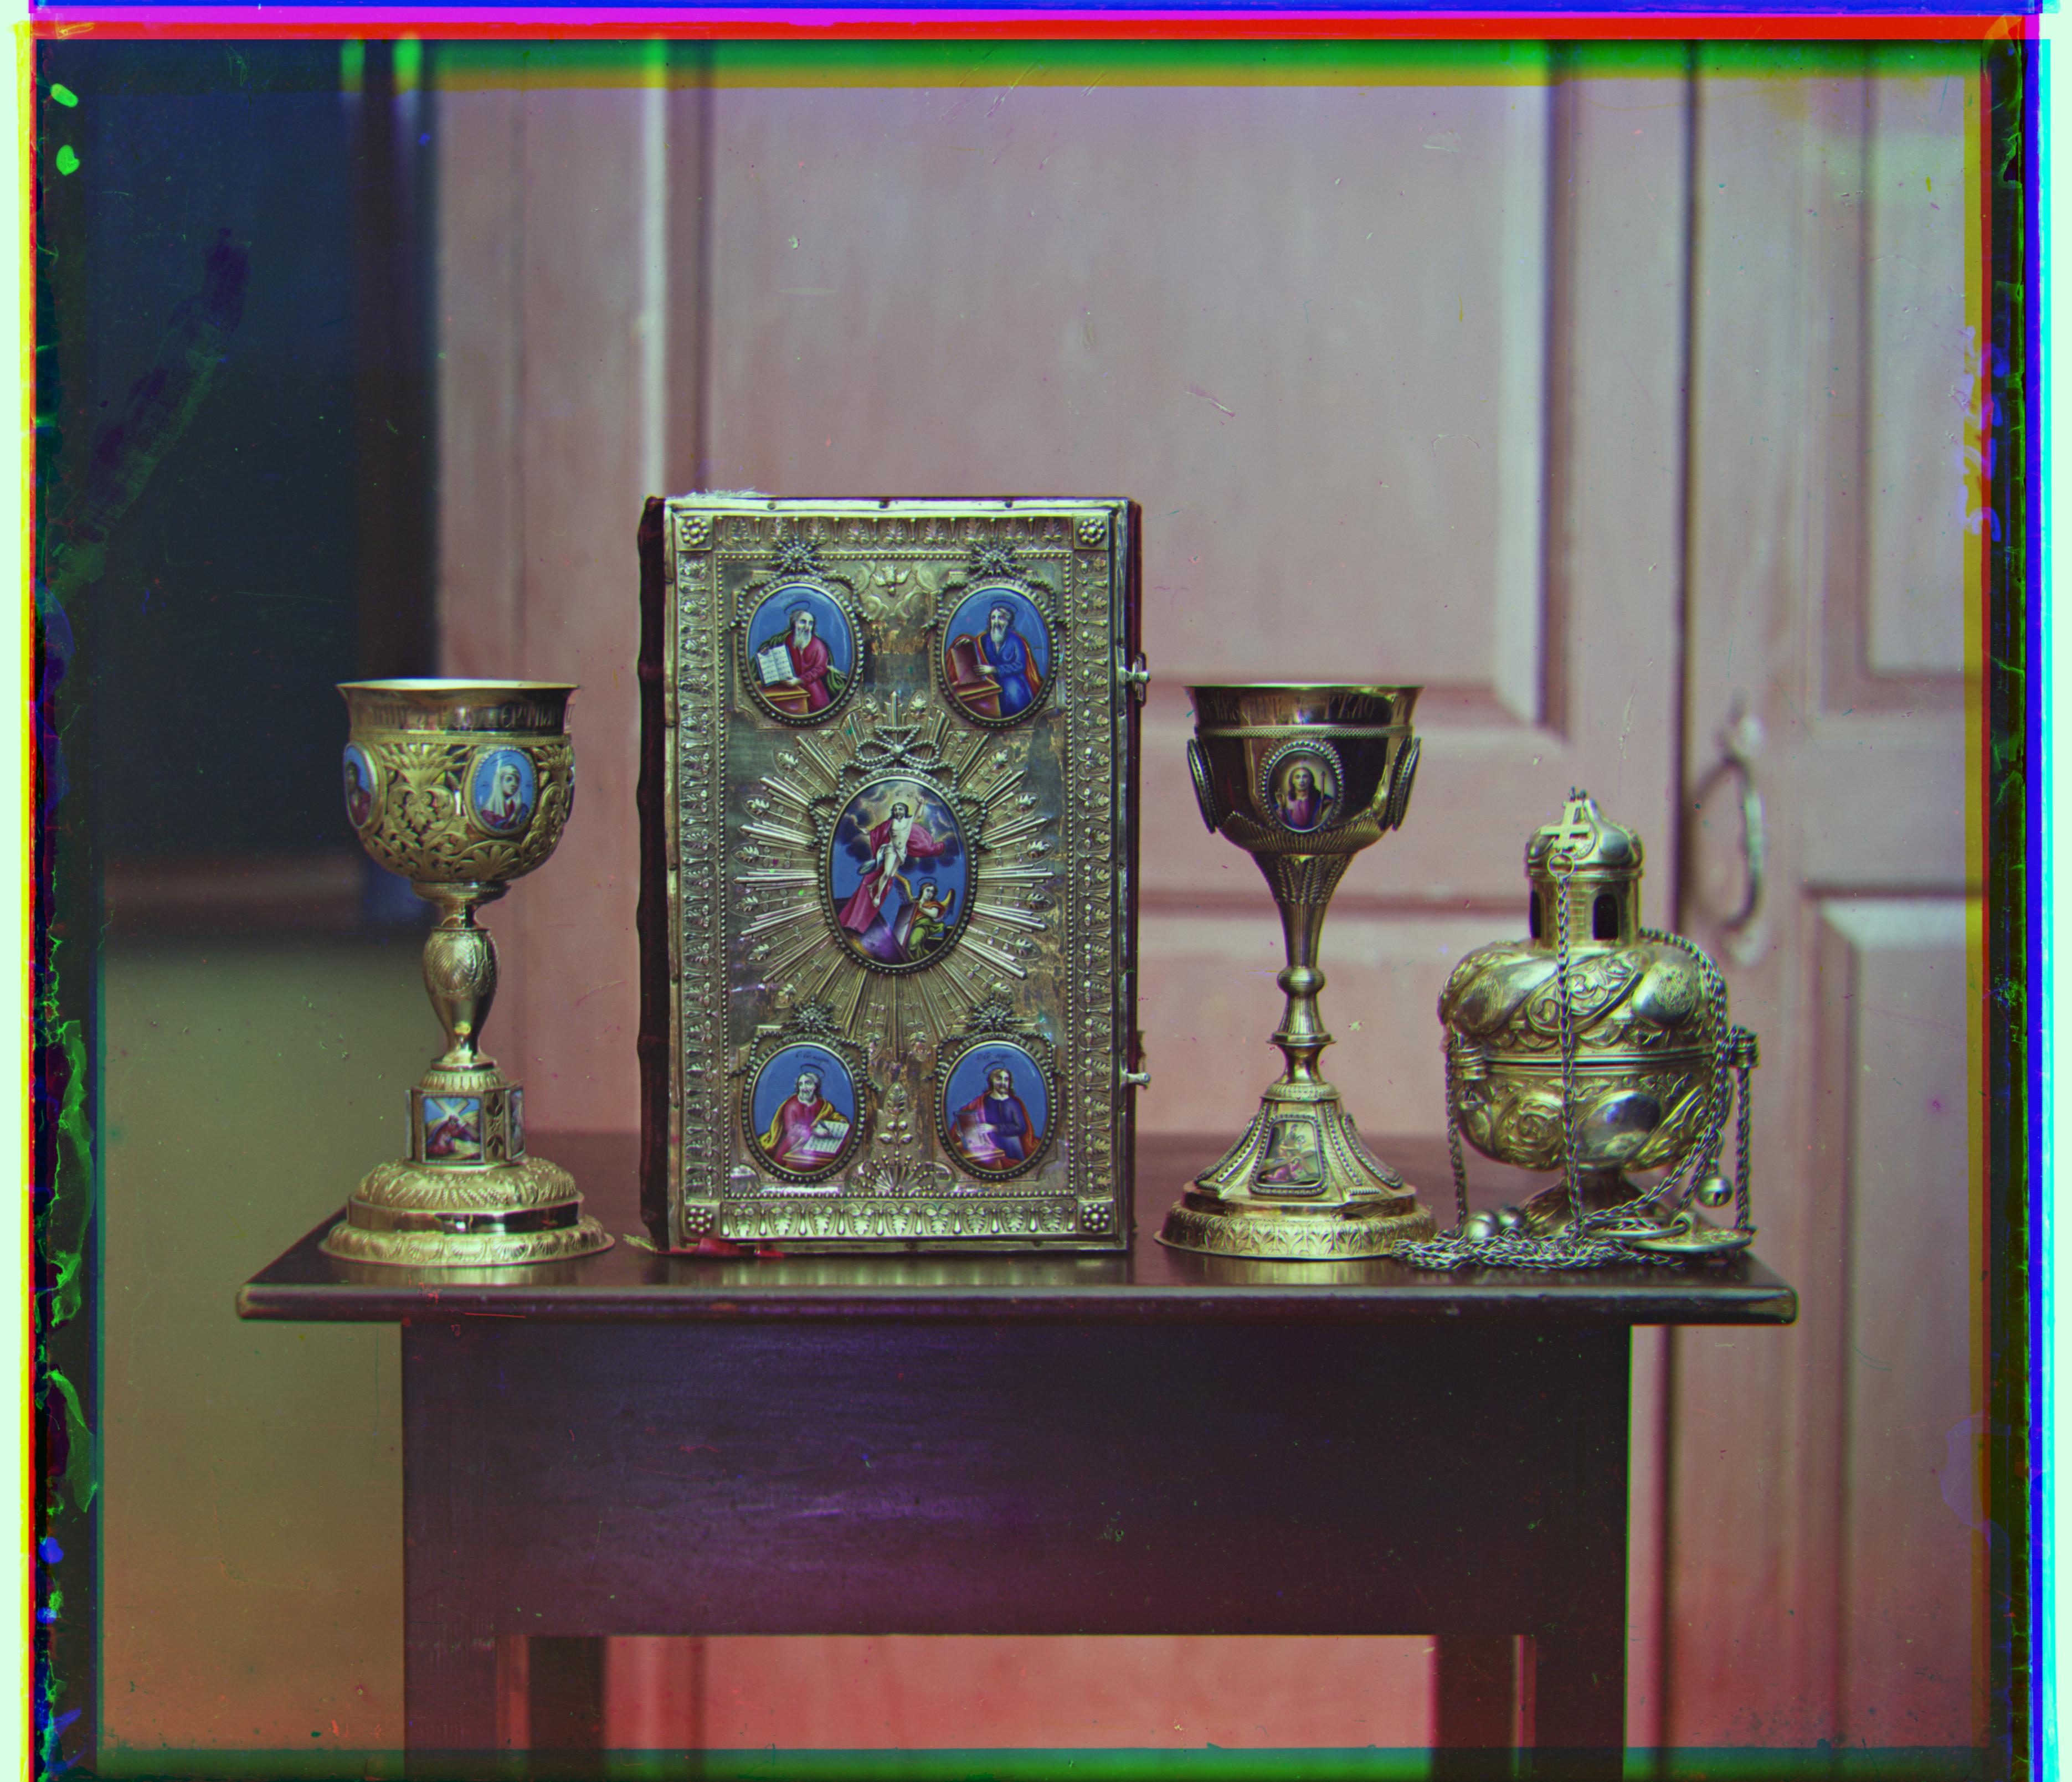
Below are additional images from the Prokudin-Gorskii collection that I collected and ran the program on. I gave each of these images their names to better identify them.
|
|
|
|
|
|
|
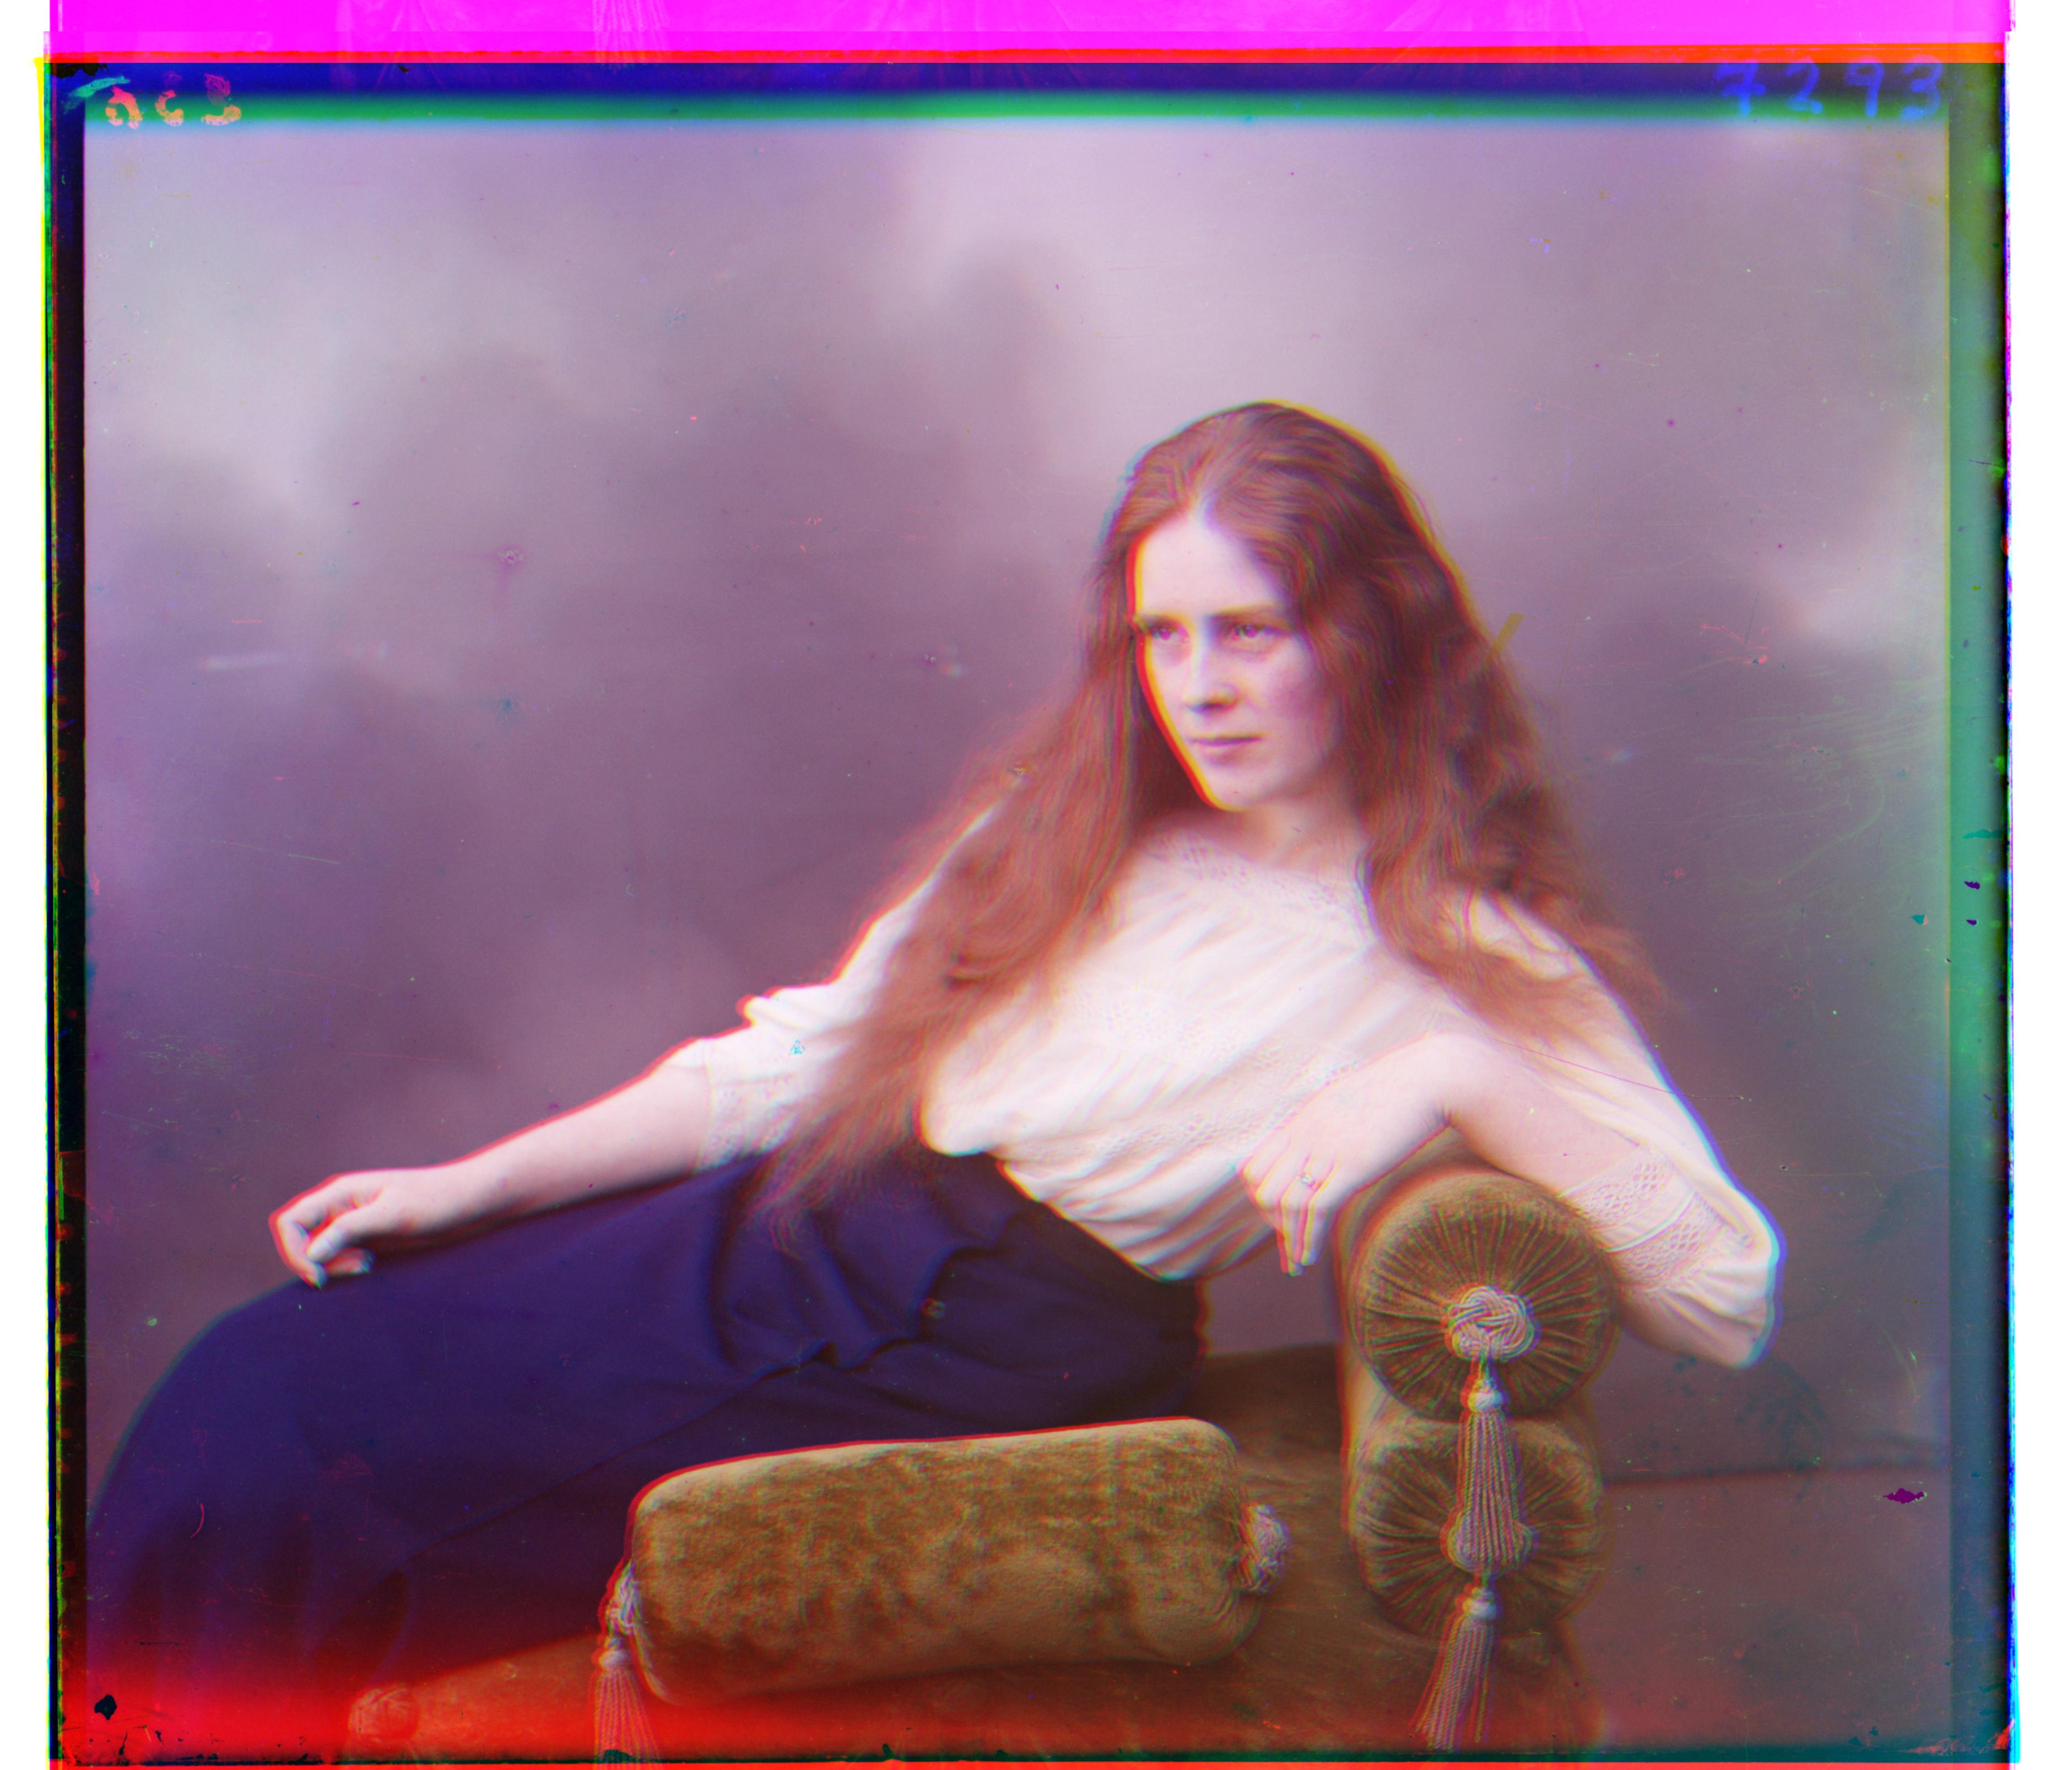
To increase the quality of images, I implemented auto contrasting within my algorithm. To do so, I calculate the 5th and 95th percentile values on the histogram of the pixel values for each component. The reasoning behind this is that all values below the 5th percentile can be treated as black, while all values above the 95th percentile can be treated as white, modifying the contrast. Following this, I solved for intensity and contrast using the equations contrast * 5th_percentile + intensity = 0 and contrast * 95th_percentile + intensity = 1 (since the brightness values in the program are between 0 and 1). I noticed interesting effects on some of the images, which is shown below.
|
|
|
|
|
|
|
|
|