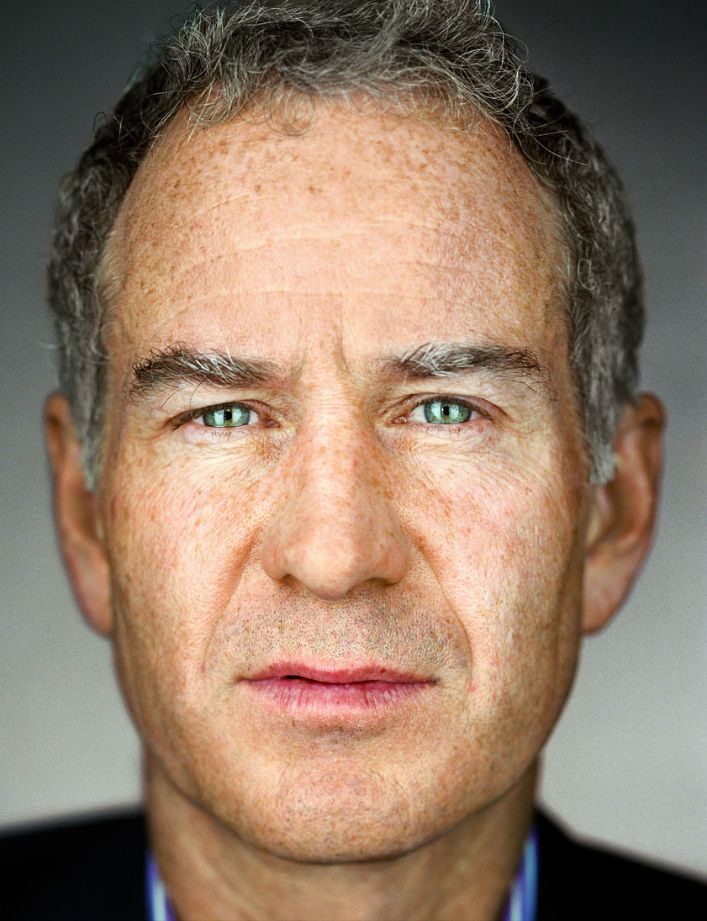
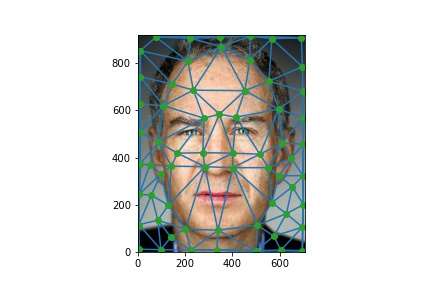
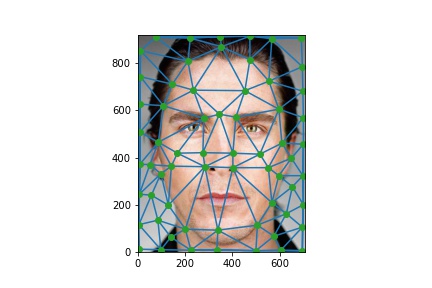
Part 1: Defining Correspondences
In this part, I used matplotlib's ginput function to determine feature points. Then I calculate the average of the feature points, and use that set of average points to compute Delauny triangle using scipy. I wrote a small helper function that transforms the output of scipy's Delauny function to the real coordinates in image.
|
|
|
|
Part 2: Computing the "Mid-way Face"
In this part, I wrote two functions: computeAffine and morph. ComputeAffine takes in two matrix and outpus the affine transformation matrix from the first input to the second input.
In morph function, I used RectBivariateSpline function to interpolate between the xy coordinates with the three color channels respectively, and the affine transformation matrix calculated to apply the transformation.
Here are the output images:
|
|
|
|
This is the morph sequence generated from the frames.
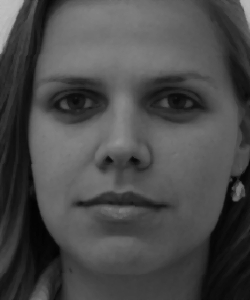
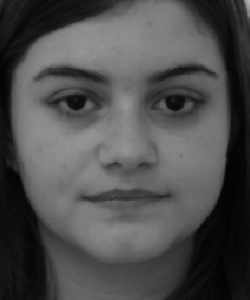
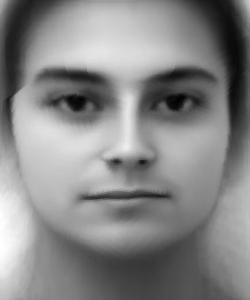
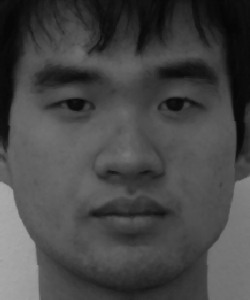
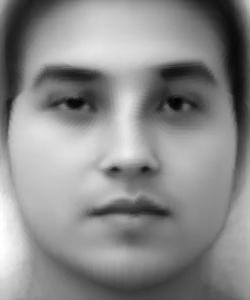
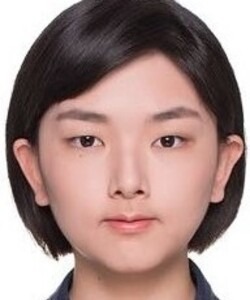
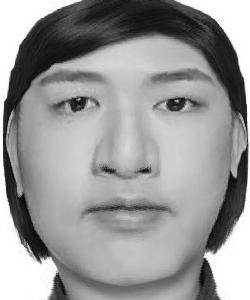
Part 3: The "Mean face" of a population
In this part I use the FEI face database. I used the first 95 face images that is NOT smiling for computing the mean face. Here are some example images with triangulations shown. There may be some tears in the graph due to the imperfect match of labelled features.
|
|
|
|
|
|
|
|
|
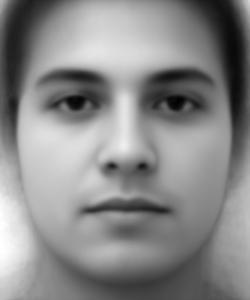
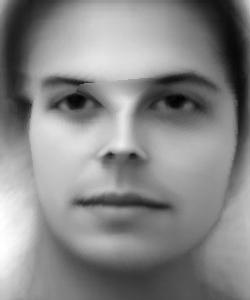
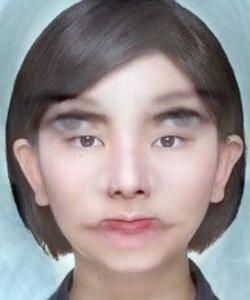
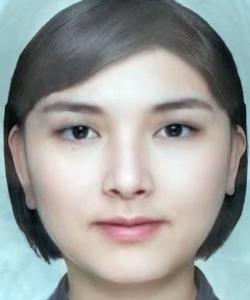
Part 5 Caricatures: Extrapolating from the mean
In this part, I used the morph function written in part 3 with some small modifications to fit grayscale calculation, setting the wrap_factor to be either >=0.5 or <=-1.5 to create an effect of extrapolation. The two images below shows the output of using 0.5 and -1.5.
|
|
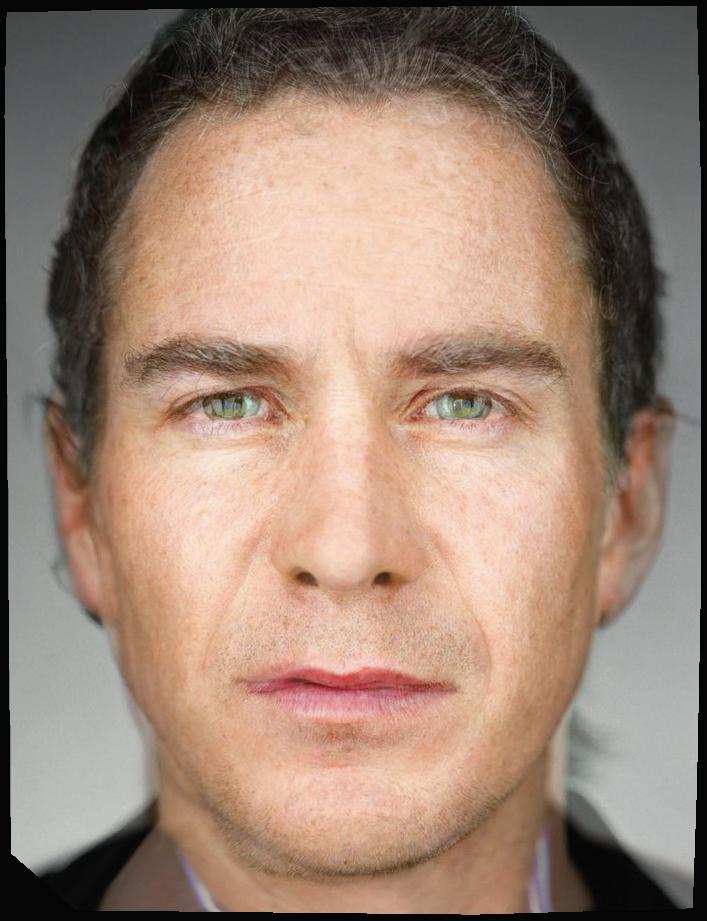
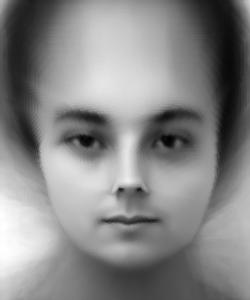
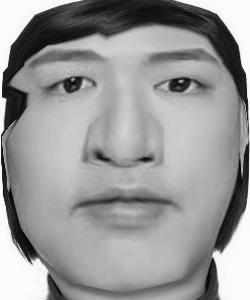
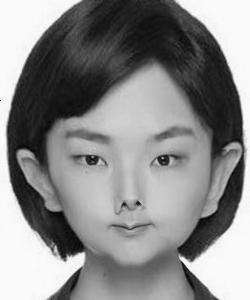
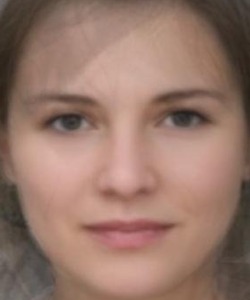
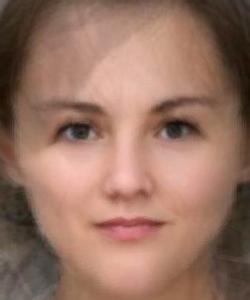
Part 6: Bells and Whistles
In this part, I used an image of average French female face found online to morph with my image to produce what I might look like if I am a French white female.
|
|
|
|
|
|