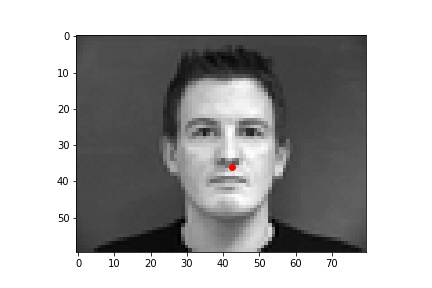
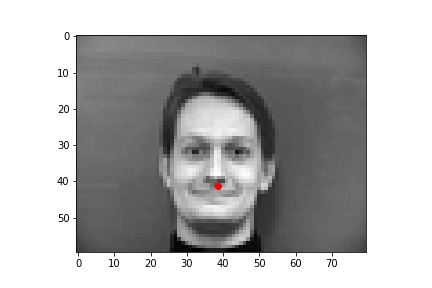
The following are 3 sampled images from my training dataloader with the nose keypoint plotted as well.
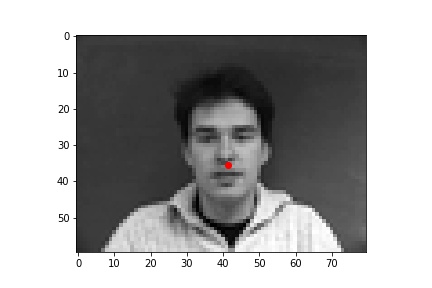
The following are 3 sampled images from my testing dataloader with the nose keypoint plotted as well.
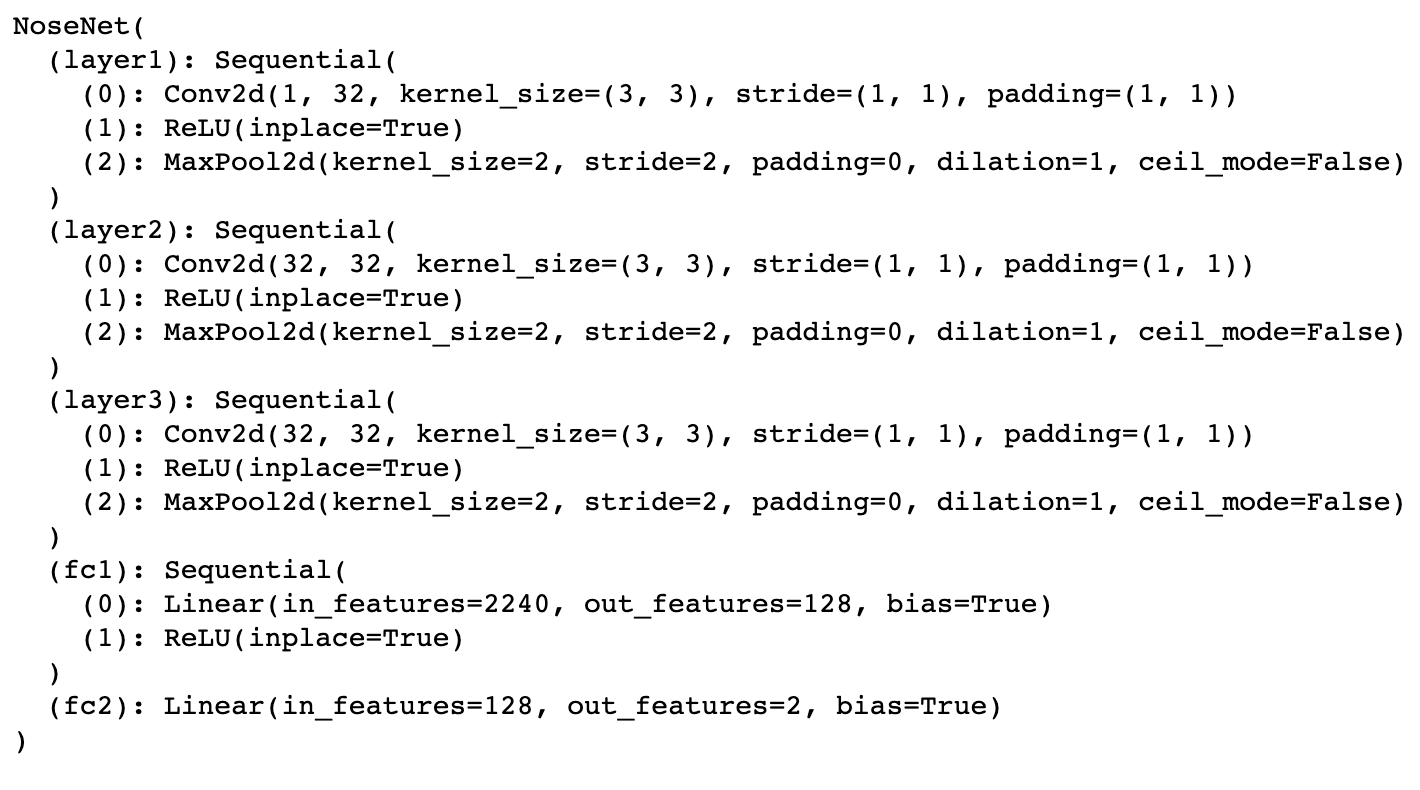
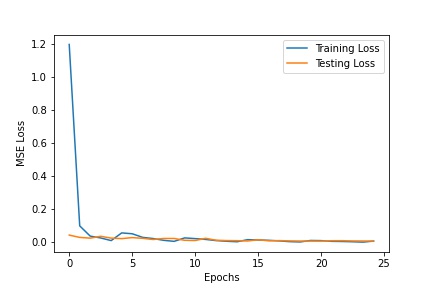
The following is the model summary of my neural network model and the corresponding loss graphs for the training and testing set. I trained with a learning rate of 0.001, batch size of 8, and 25 epochs.
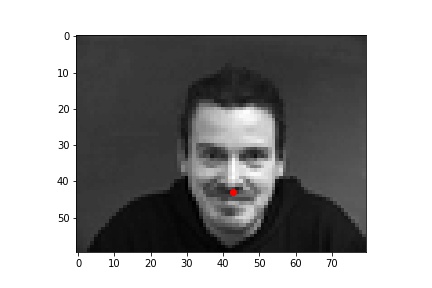
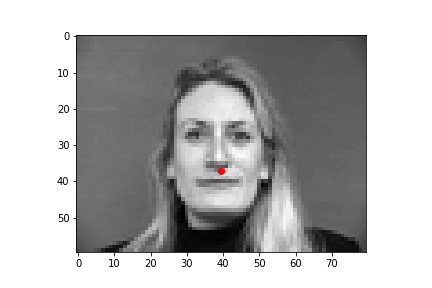
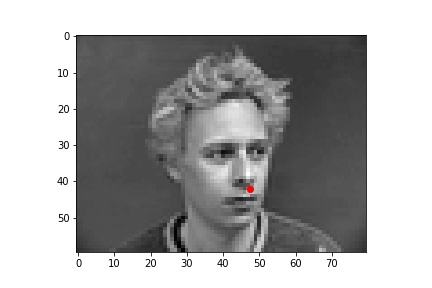
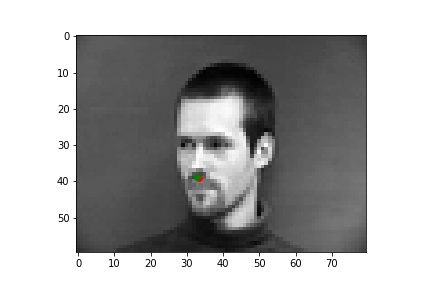
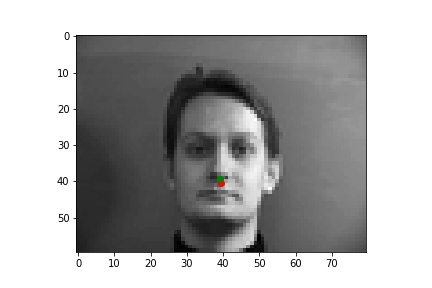
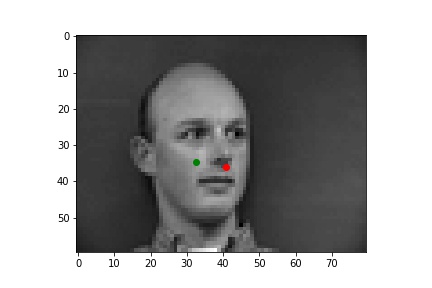
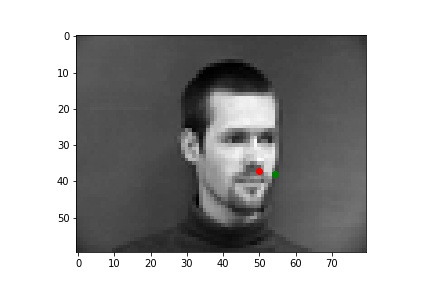
The following are some results from my model. The first two images are successful detection while the second two images are not as successful. The green dots are the prediction while the red dots are the label for that image. There are a few reasons I think the model failed on those examples. One reason could be that the model is not too good at detecting non-central noses. Also, the model could struggle with faces where the nose is positioned to the right (instead of the left).
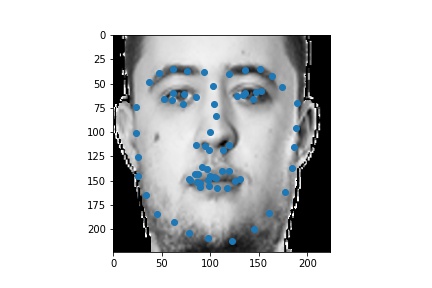
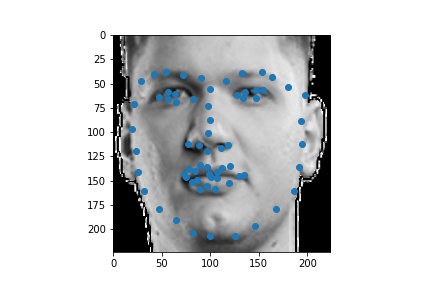
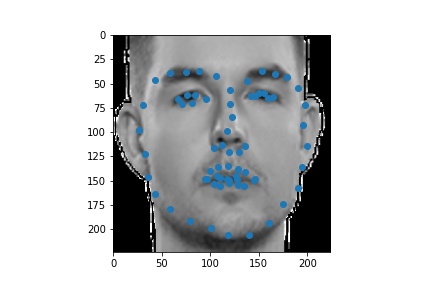
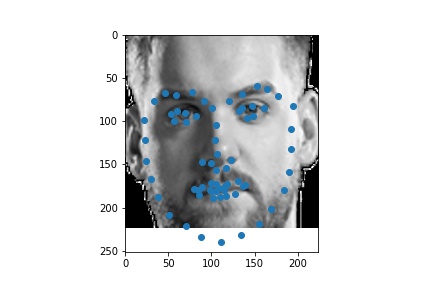
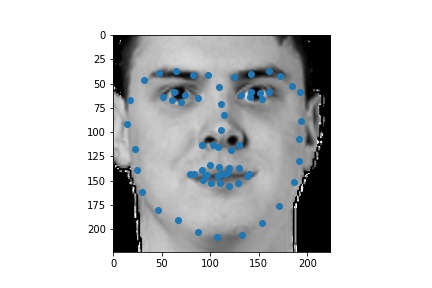
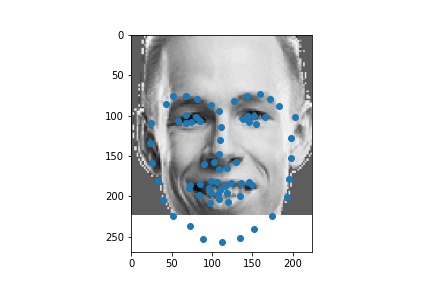
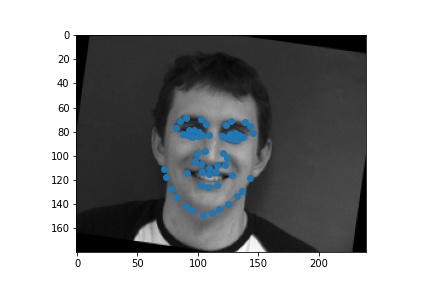
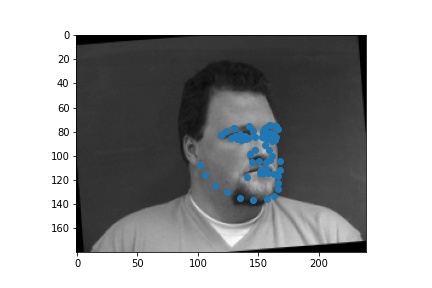
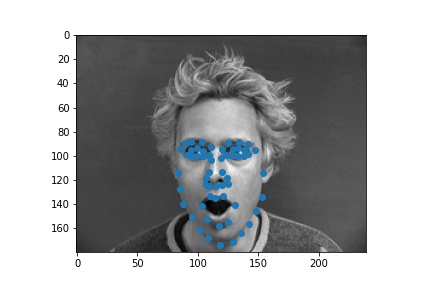
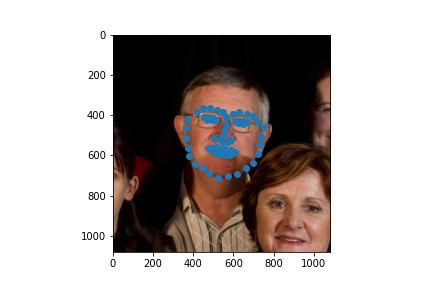
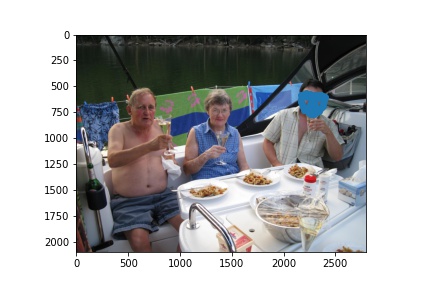
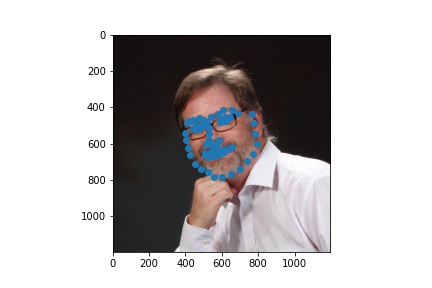
The following are 3 sampled images from my training dataloader with the facial landmarks plotted as well.
.jpeg)
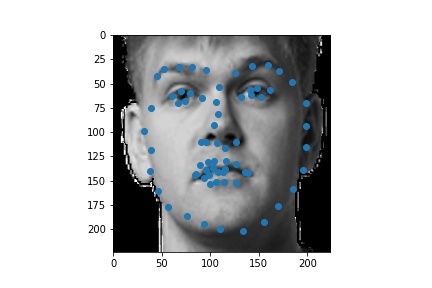
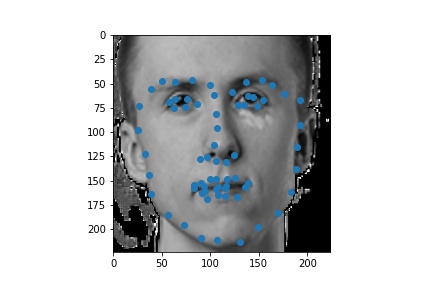
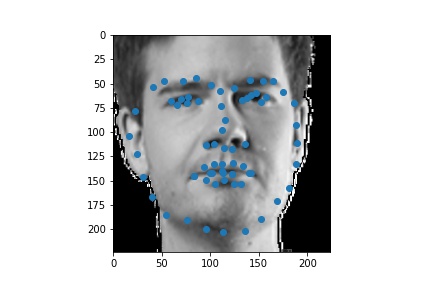
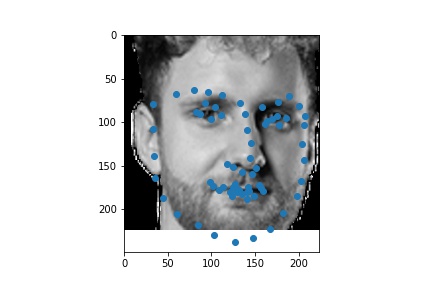
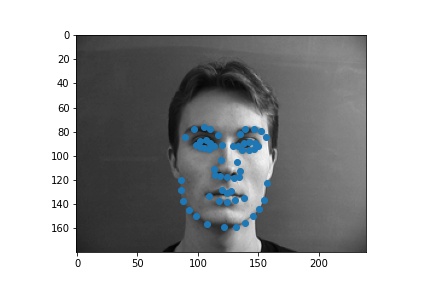
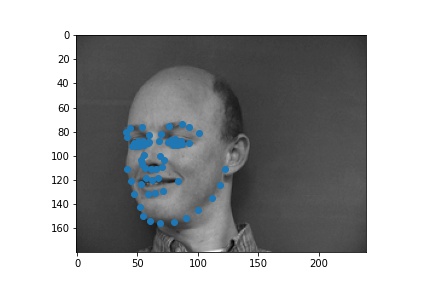
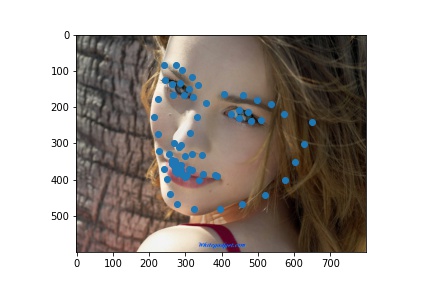
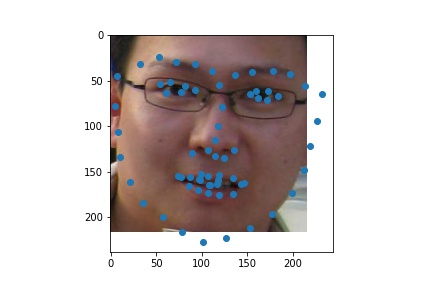
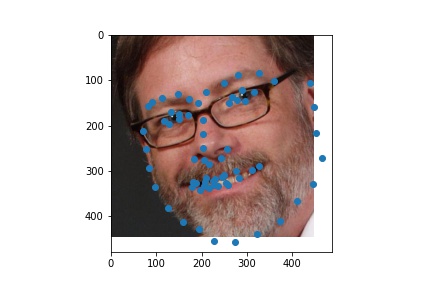
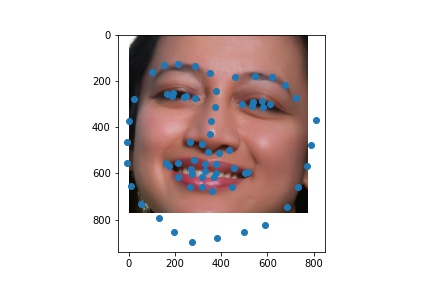
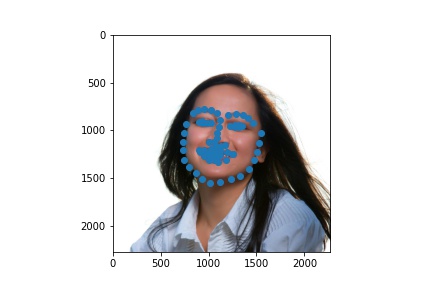
The following are 3 sampled images from my testing dataloader with the facial landmarks plotted as well.
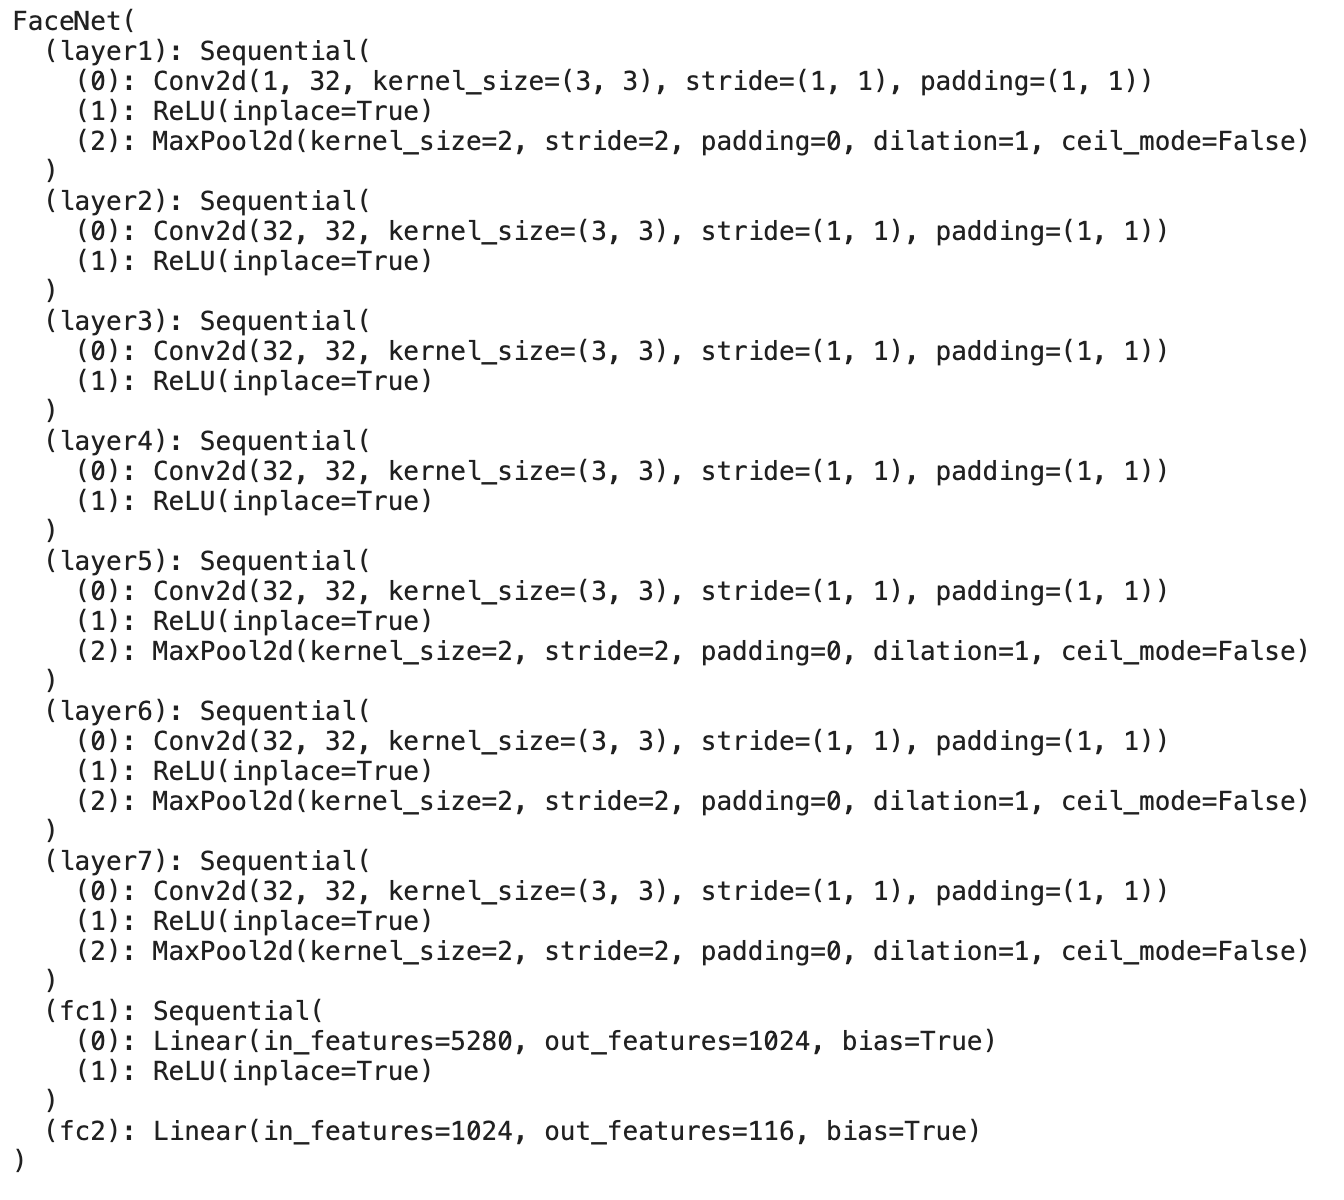
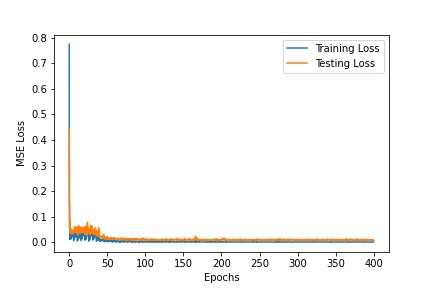
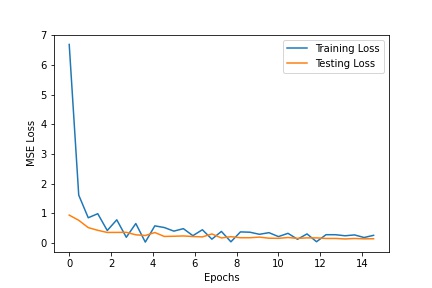
The following is the model summary of my neural network model and the corresponding loss graphs for the training and testing set. I trained with a learning rate of 0.001, batch size of 8, and 400 epochs. I didn't think it was necessary to have this many epochs at first but my facial landmarks were not converging well without a very large epoch number size.
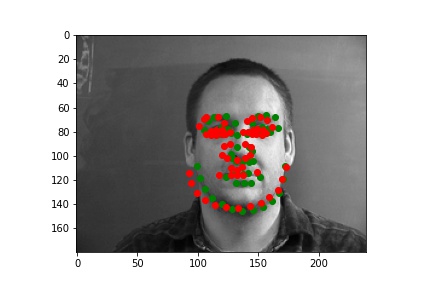
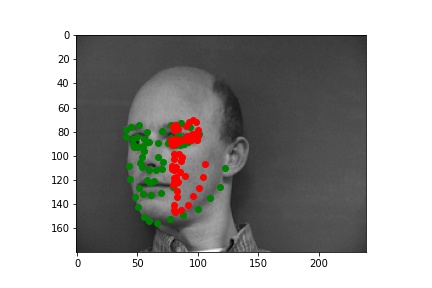
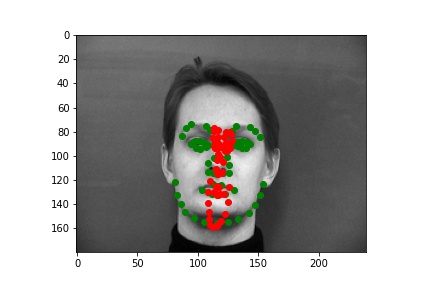
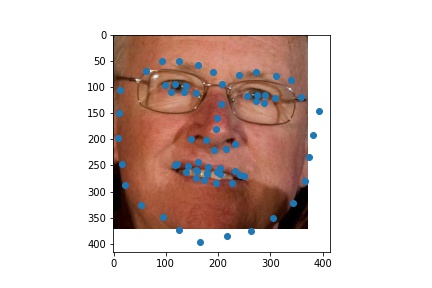
The following are some results from my model. The first two images are successful detection while the second two images are not as successful. The green dots are the prediction while the red dots are the label for that image. There are a few reasons I think the model failed on those examples. One issue is that the model was not able to understand how rotated the face was. I think rotations for non-centered faces were also hard for more model to pickup in general.

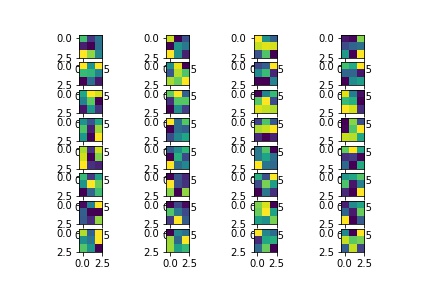
The following graphic is the visualization for the learned features on the first conv layer
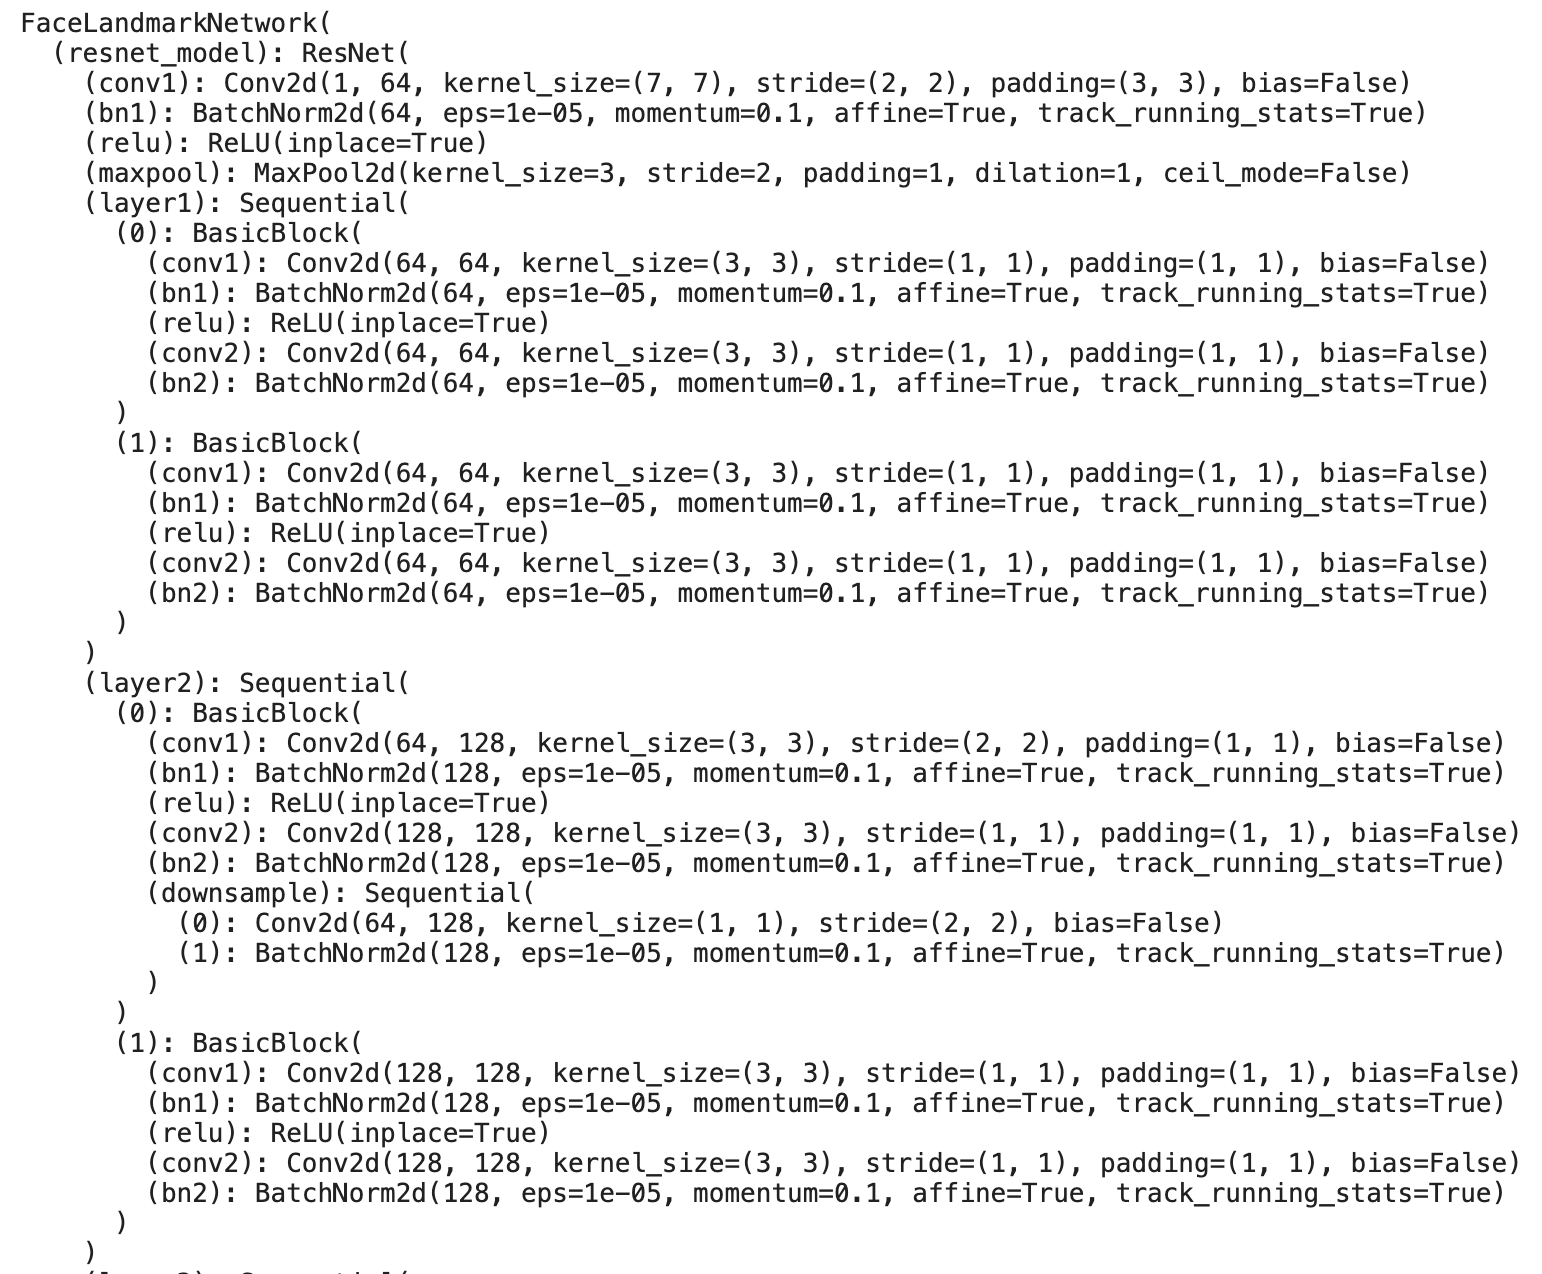
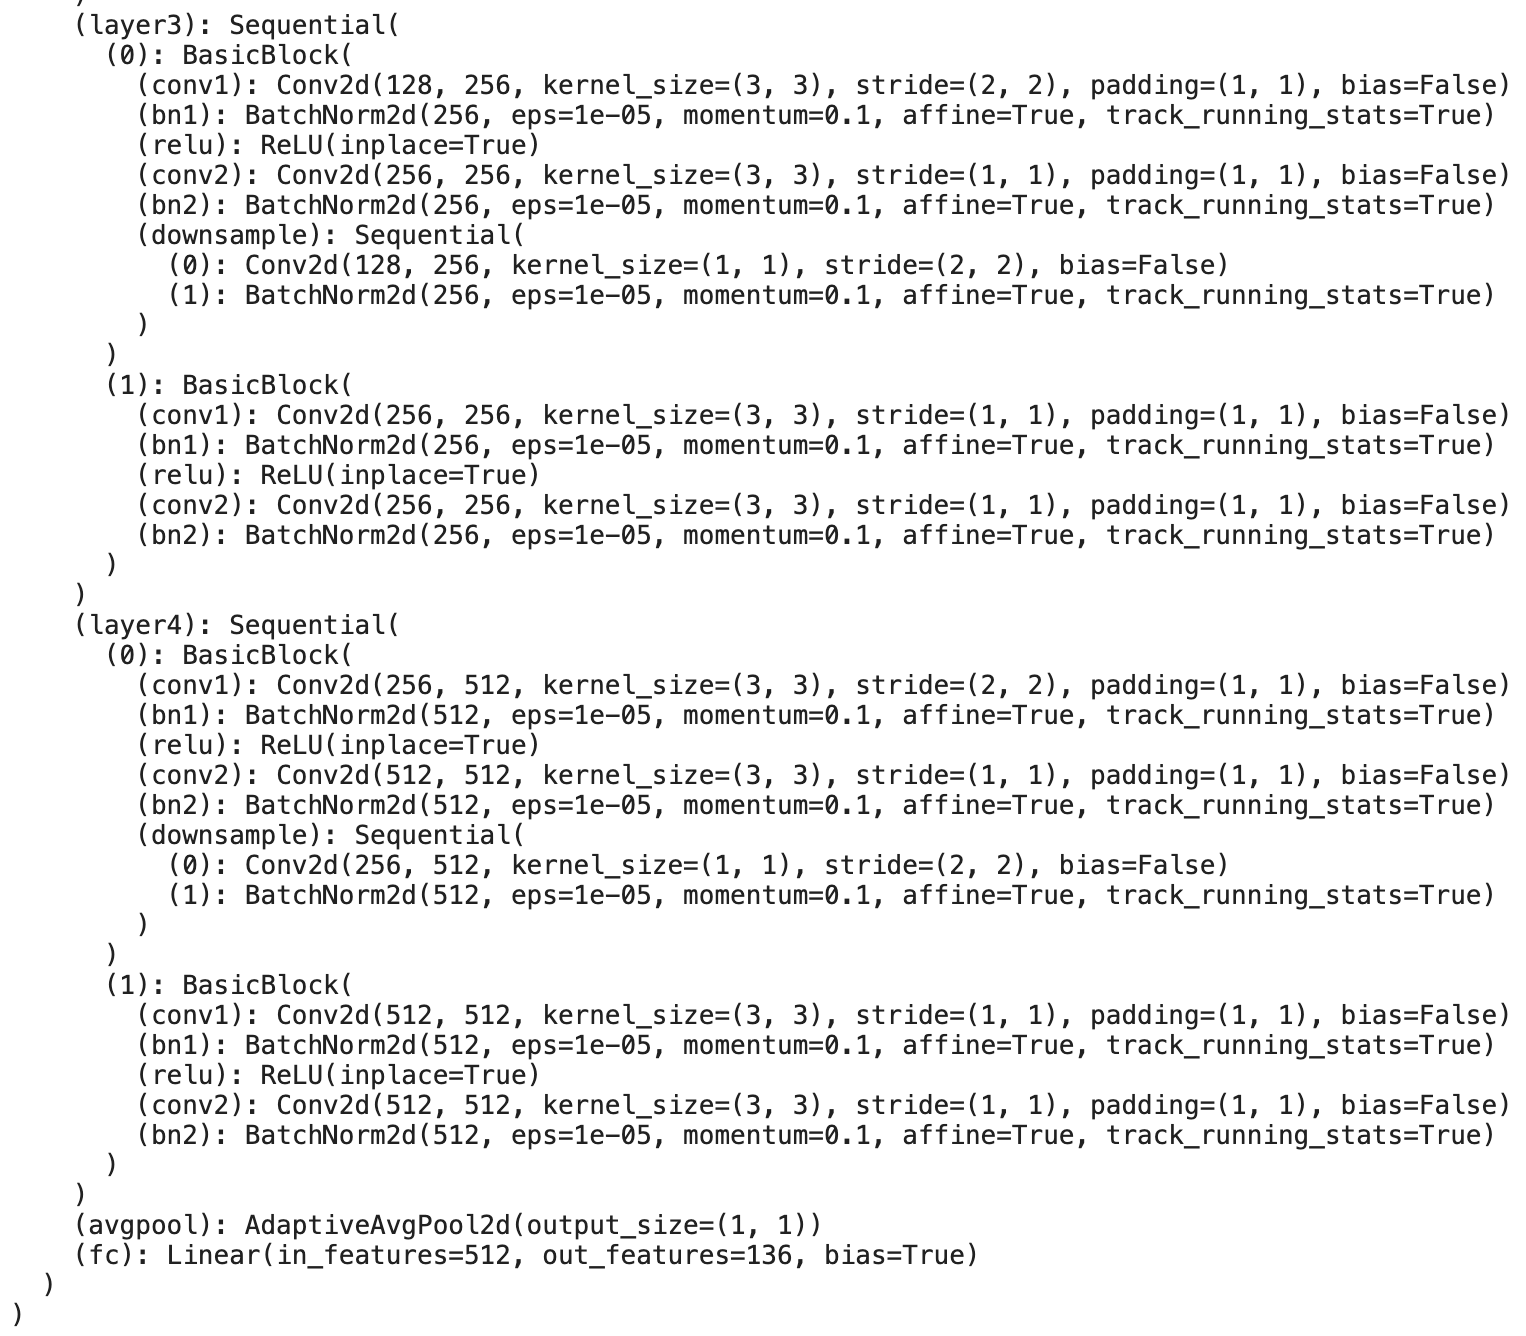
The following is the architecture of my model for part 3. I changed the input layer and output layer for resnet-18. My learning rate was 0.0001, batch size was 8, and I trained for it for 15 epochs. The third image is the training/testing loss graphs for my model. Also, for the Kaggle competition, my username was AdiSujithkumar and my MAE on the leaderboard is 9.72506.
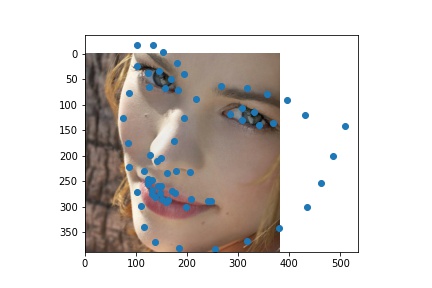
Here are some visualized keypoints for some of the test images; the first image will be the prediction on the cropped face and the second image will be the prediction on the original image.
Here are prediction I made on custom data pulled from hltv.org. I tried to identify the facial landmarks for the top 10 players from 2020. The first row of images are the original headshots and the second row of images are the predictions plotted on the face crops (sorry for the poor grayscale; this is how PyTorch transformed the images when turning them into grayscale.)