CS 194 - Project 1
Atte Ahmavaara
In this project we took digitized Prokudin-Gorskii glass plate images and combined the three stacked grayscale images into a color image.
To accomplish this, I began by implementing a single scale exhaustive search algorithm. Initially I used a normalized correlation function, but I eventually transitioned to a custom correlation function comparing the normalized differences between neighboring pixels. To speed up the process of analyzing extremely high resolution images, I implemented an image pyramid that, given a universal delta value (the range to exhaustively search, calculated through testing), and a universal jump range (the maximum jump length per scale as a percent of the image size in pixels, calculated through testing), calculates an initial target resolution and scales the image down to that resolution. It then iterates through increasing (nextScale = 2 * currScale) scalings of the image and calculates a translation vector for each iteration. It gradually translates the image every iteration by scaling the vector by the downscaling ratio. It works by initially giving a coarse estimate for where the image should be aligned to, and then fine tuning it at varying scalings of the image. Finally, the algorithm takes the base plate (the blue channel), and stack it with the newly aligned red and green plates to output a final image.
Throughout the course of this project, I focused on finding a correlation function that balanced accuracy and efficiency. Accuracy was always first priority, but a gain of say, 1% accuracy was not worth making the algorithm 4x slower. For example, I could have compared both vertical and horizontal pixels, but that caused a ~1.9x runtime hit and only changed the results by 0-2px (on large images). Further, I could have combined the normalized correlation with the neighbor correlation data, but that caused a ~4.5x runtime hit and only changed the results by 0-1px (on large images). A fast correlation function, along with minimizing the aforementioned delta value (n^2 runtime effect), would be the key to optimizing the algorithm. A largemajority of the work is done in the correlation function, since it is called very often and has to deal with large quantities of data.
The first problem I encountered while implementing the algorithm was misalignment due to interference from the borders of the image. To overcome this, I simply cropped each image to the center 80% of the image, both height and width. This eliminated the borders from the calculation, and unintentionally helped runtime (since the algorithm was now doing 36% less work) while increasing the accuracy and image quality of the final images.
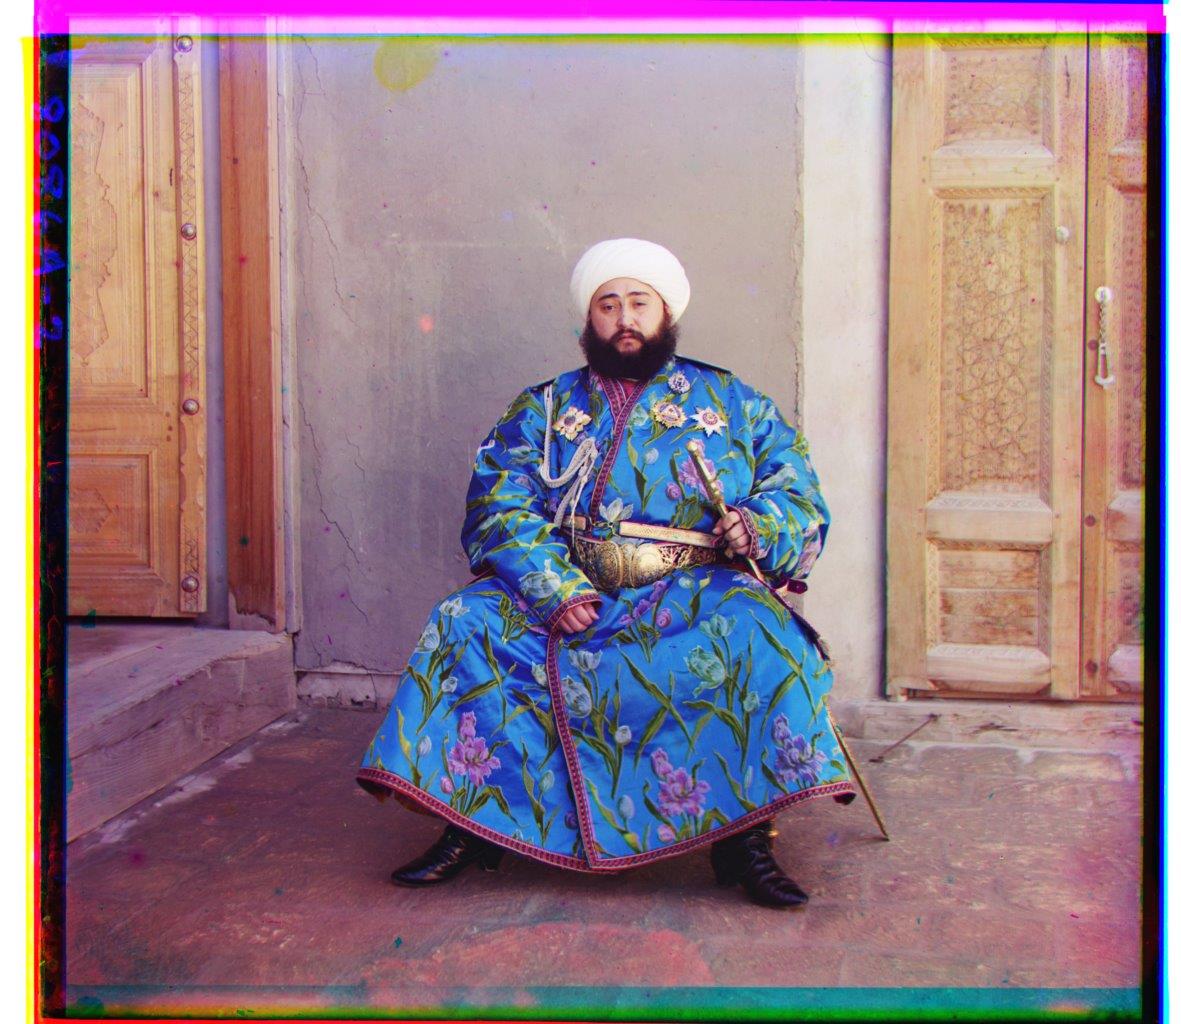
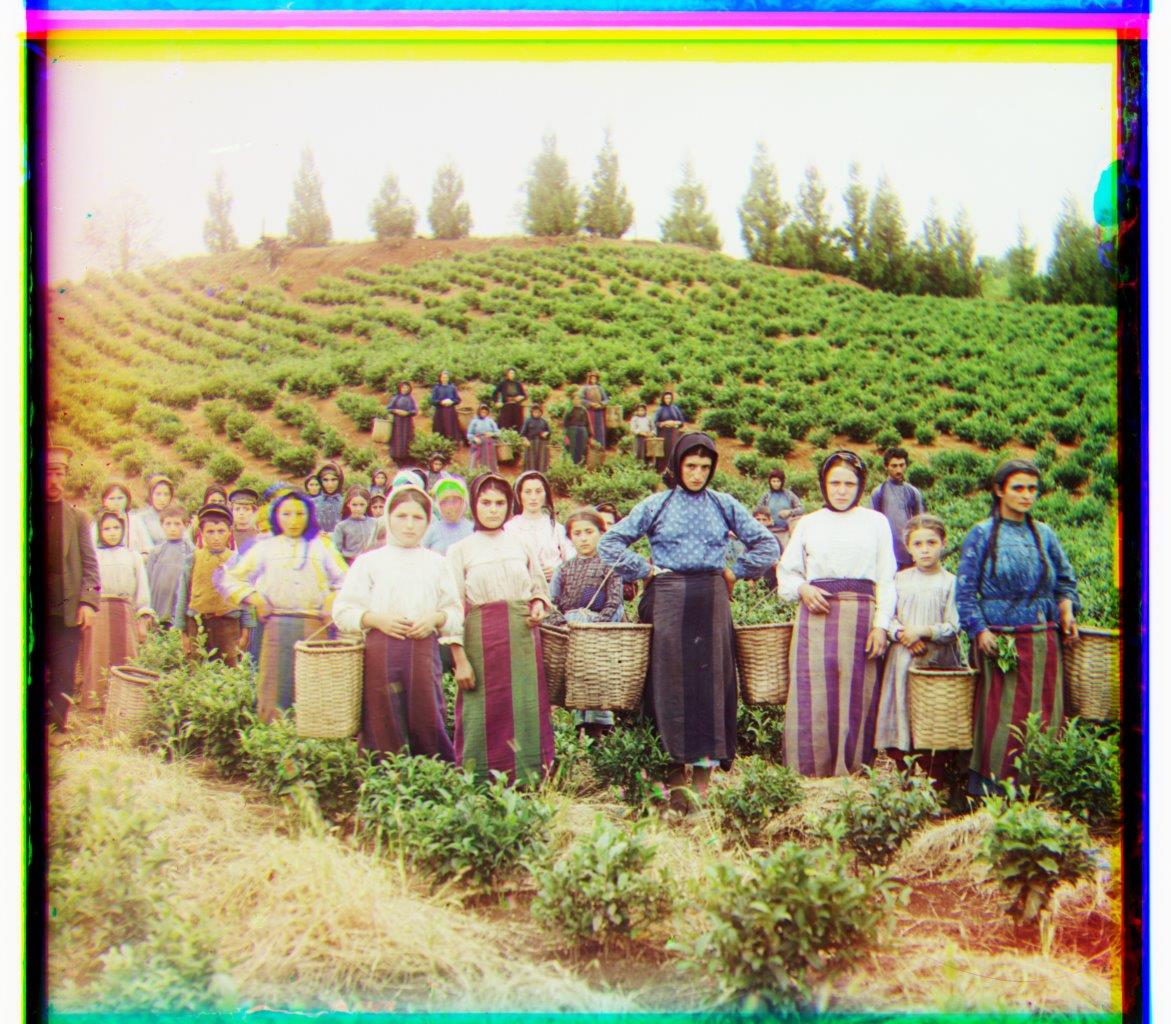
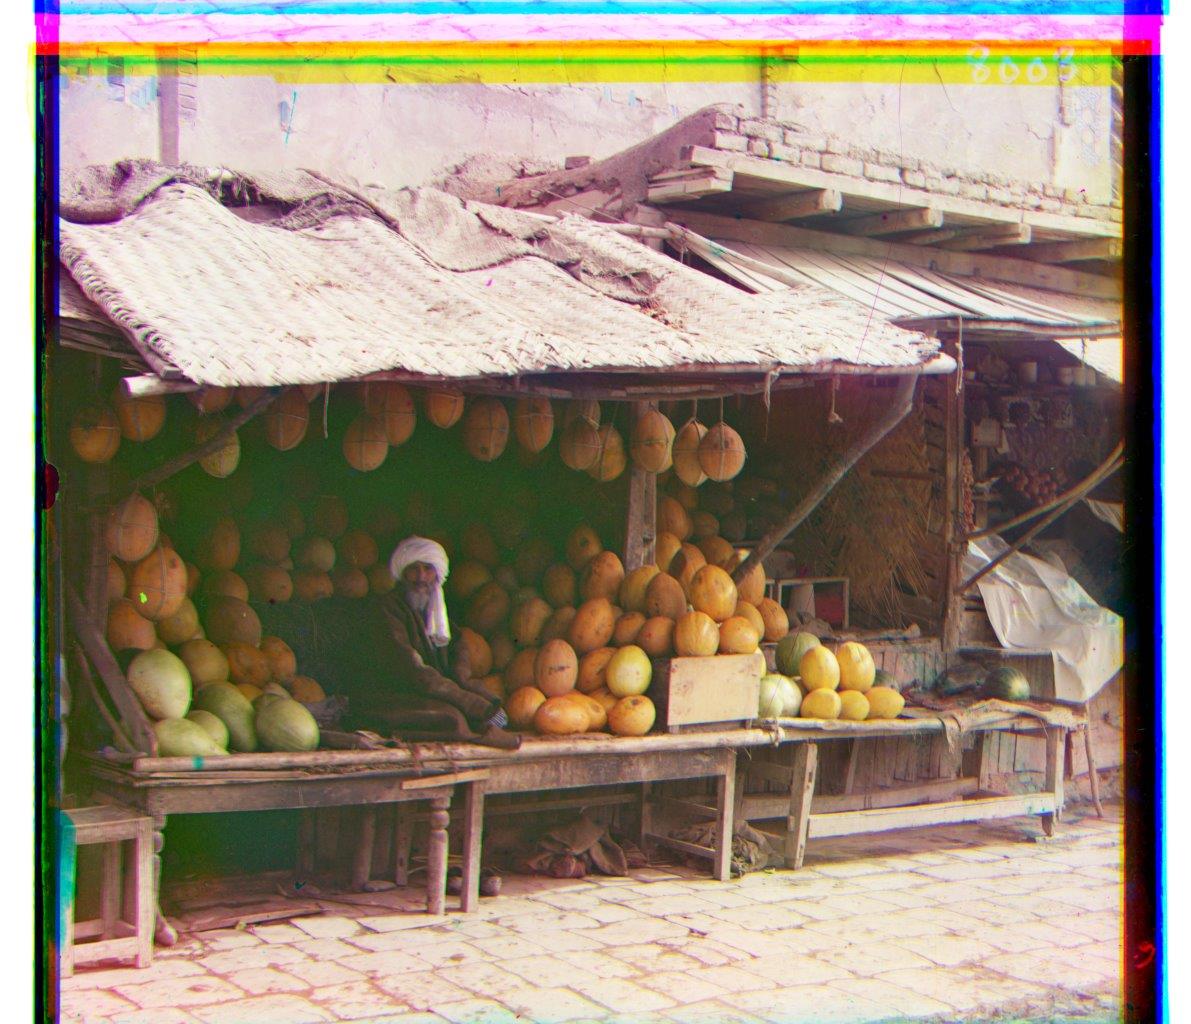
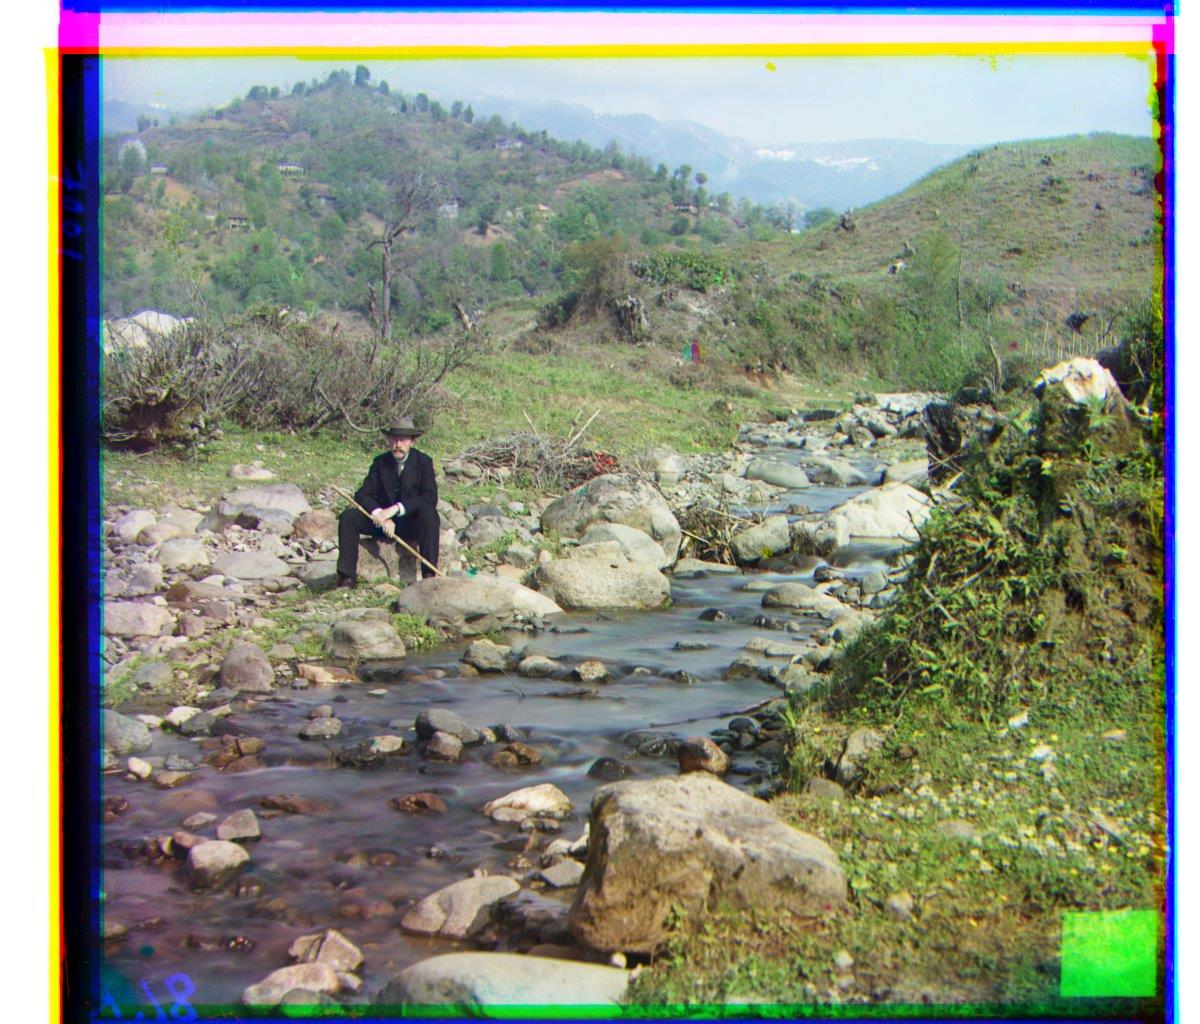
The main problem I encountered while implementing the algorithm was the emir.tif image. The red channel has a very large bright spot in the middle, since in the color image that area is almost purely blue. This caused there to be very low correlation accross the board; in fact, higher correlation the further away the algorithm got from being aligned, since the wall behind the man from the blue channel correlated better with the man in the red channel. To overcome this, I implemented the aforementioned ("My Approach" section) difference motivated correlation function. What this function does is compare the normalized differences between neighboring horizontal pixels of the two images. This simulates a bootleg way of doing basic edge detection, I think. This entirely fixed the problem with emir.tif and increased runtime accross the board since it is lightning fast to calculate.
green=[5, 2] red=[12, 3]
green=[-3, 2] red=[3, 2]
green=[3, 3] red=[6, 3]
green=[49, 23] red=[105, 42]
green=[61, 17] red=[124, 11]
green=[39, 16] red=[89, 23]
green=[57, 8] red=[120, 12]
green=[81, 11] red=[174, 11]
green=[50, 28] red=[108, 35]
green=[77, 28] red=[172, 35]
green=[54, 11] red=[114, 11]
green=[52, 5] red=[93, 34]
green=[64, 10] red=[137, 21]
green=[52, -2] red=[105, -12]
green=[60, 13] red=[132, 5]
green=[13, -20] red=[36, -51]
green=[27, -24] red=[65, -52]