CS 194 - Assignment 4 - Image Classification & Segmentation
Haoyan Huo
Image Classification
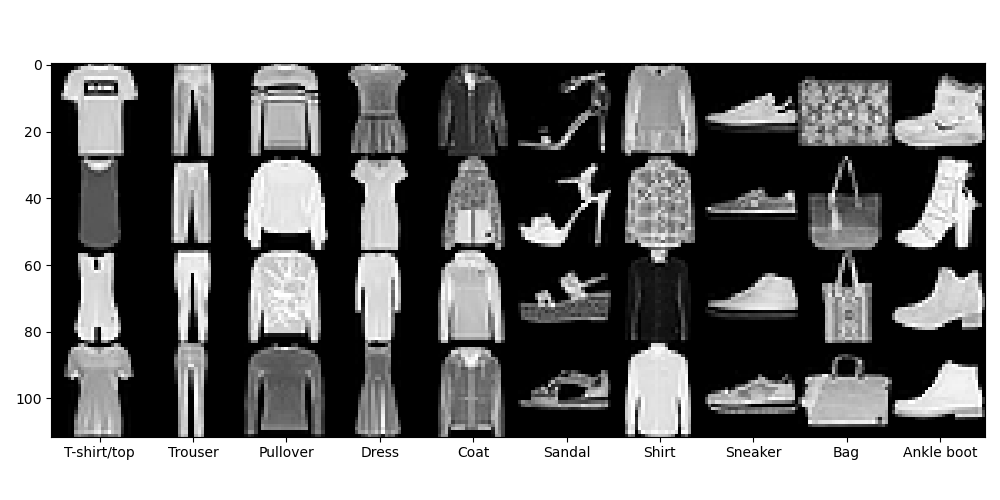
The Fashion-MNIST dataset is a collection of different fashioned items. As shown below, there are 10 classes. In this section, we try to use CNN to classify different classes of images in the Fashion-MNIST dataset.
Model Description
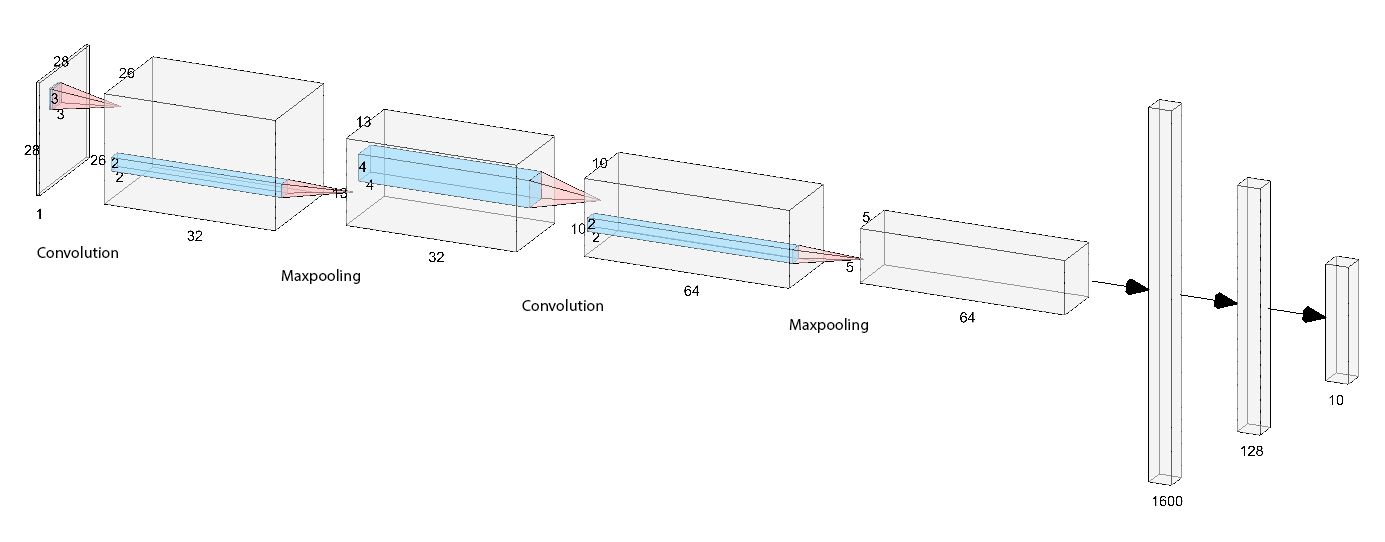
The model consists of 2 convolutional layers with kernel size 3 and 4 coupled with 2 maxpooling layers. The depths of the filters are 32 and 64. The output tensor of the convolutional layers has a shape of 64x5x5. 2 fully-connected layers have input sizes of 1600 and 128, and output sizes of 128 and 5. The following figure shows the entire neural network architecture (created using NN-SVG).
The loss function is the plain cross-entropy function. I used Adam optimizer with a learning rate of 0.001 and a weight decay of 1e-5. The model is trained for 20 epochs. The batch size is 64. These parameters are (manually) chosen to optimize the score on the validation dataset.
For the model architecture, I also tried sigmoid and leaky ReLU activation functions. Sigmoid is terrible because the model does not learn at all, which I guess is due to vanishing gradients. Leaky ReLU decreases accuracy by about 1-2%. In the end, I kept using the ReLU activation function.
Loss function and training/validation accuracy in the training process
During training, the loss function value and accuracy of the images in every batch are recorded. As shown below, the training loss decreased consistently to almost zero, while the validation loss slowly goes up. Although this might indicate some overfitting of the model to the training data, we do see from the accuracy plot that the solid blue curve representing validation accuracy keeps a constant. For some classes, the validation accuracy even increases when the validation loss increases. My guess is that cross-entropy loss function does not represent the true risk of misclassification, since it assigns large loss to low-probability scores, even though these scores are pretty good and enough to classify labels.
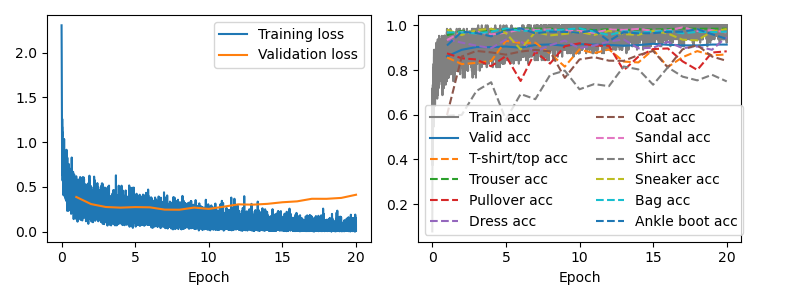
From the above figure, we can also see that "Shirt", "Coat", "Pullover", and "T-Shirt/top" classes are harder to classify as they have less accuracy than the averaged accuracy. To evaluate this, the following figure shows 2 correctly classified and 2 wrongly classified images for each class.
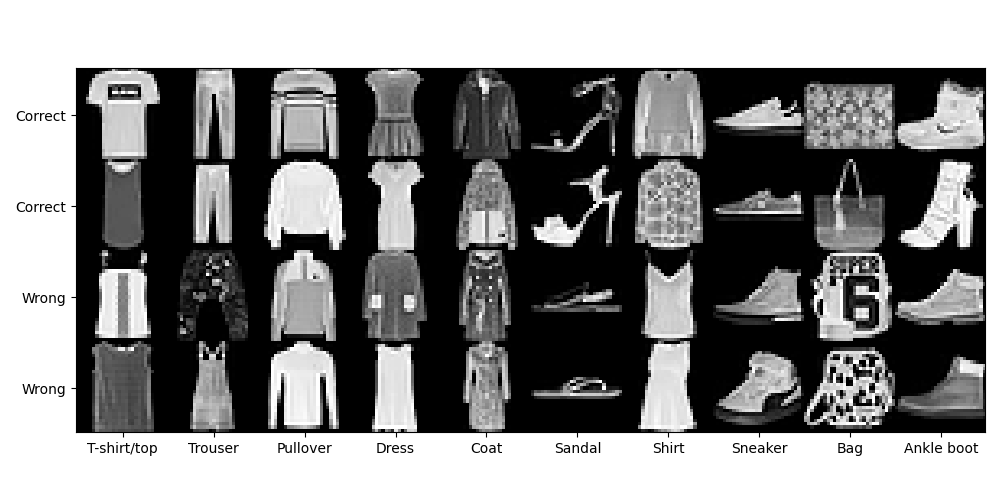
Looking at different classes, we do see that "T-Shirt" images are very similar to "Shirt" images. "Pullover" is very similar to "Shirt"/"T-Shirt" images. "Coat" images are very similar to "Dress" images. Sincerely speaking I had a hard time classifying these images too.
Accuracy evaluated on the test dataset
I then evaluated the model on the test dataset. Here are the accuracy numbers:
- Total accuracy 0.916
- Accuracy for class T-shirt/top is 0.859
- Accuracy for class Trouser is 0.982
- Accuracy for class Pullover is 0.896
- Accuracy for class Dress is 0.949
- Accuracy for class Coat is 0.849
- Accuracy for class Sandal is 0.975
- Accuracy for class Shirt is 0.750
- Accuracy for class Sneaker is 0.990
- Accuracy for class Bag is 0.976
- Accuracy for class Ankle boot is 0.935
Learned filters
After the model is trained for 20 epochs, the first layer filters (32 in total) is shown below.
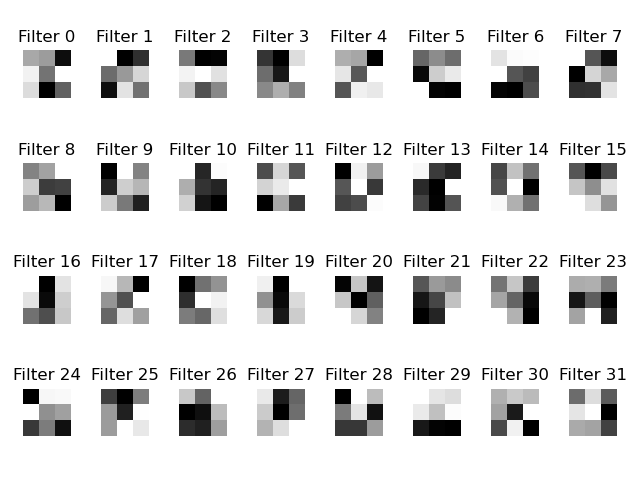
Image Segmentation
Model Description
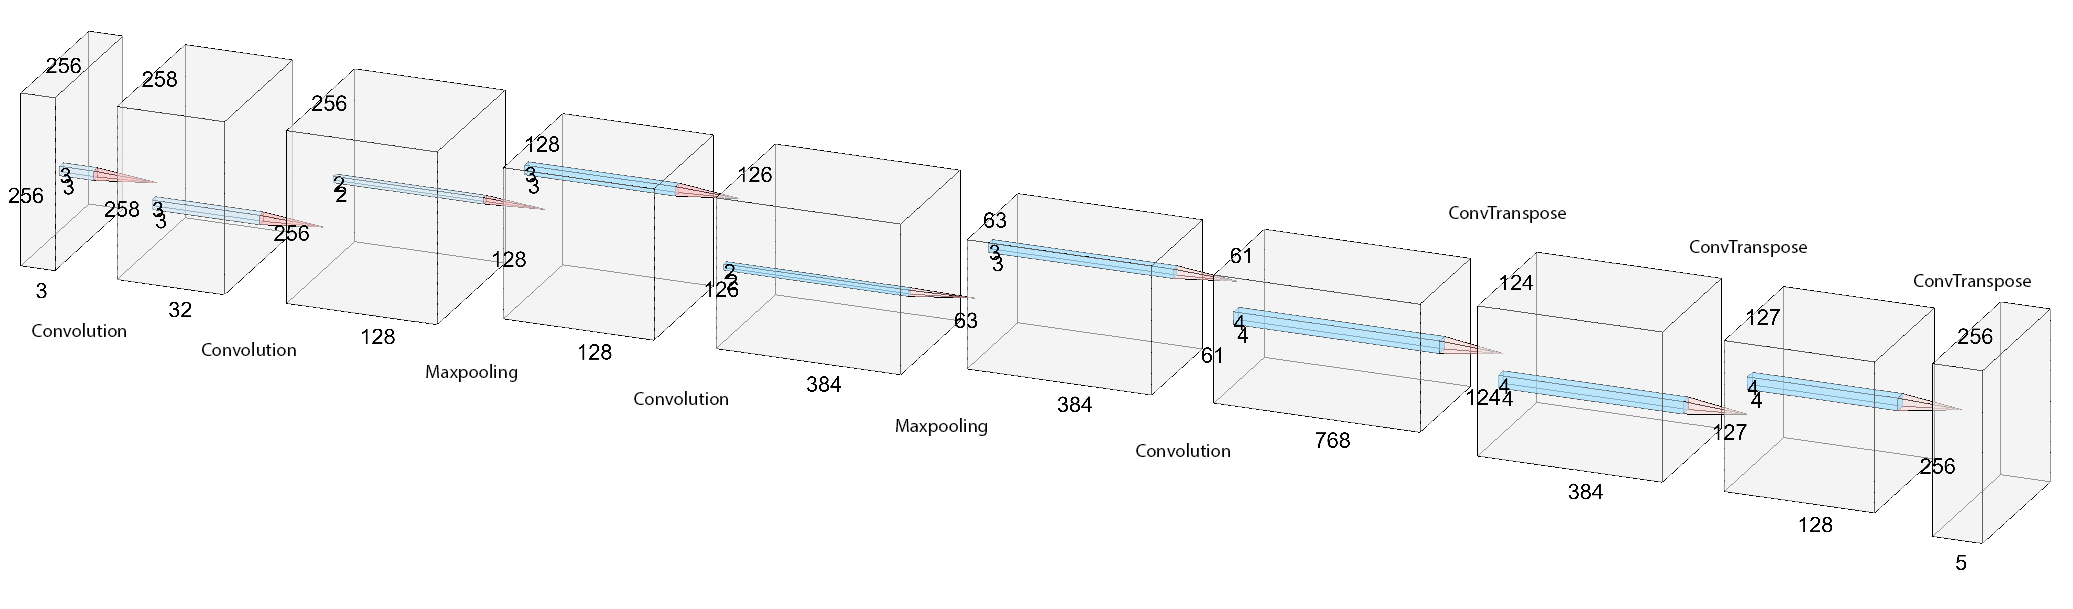
The model consists of 4 convolutional layers and 2 maxpooling layers that decrease the image size from 256x256x3 to 61x61x768. 3 transposed convolutional layers then increase the image size from 61x61x768 to 256x256x3. The following figure shows the entire neural network architecture.
This task has unbalanced classes. When a class appears (10-20x) less in training data, the loss function and gradients corresponding to this class will become very small, forbidding efficient training for that class. Thus, I used a modified version of cross-entropy function that weights each class with the inverse of the number of labels in that batch.
The optimizer is still the Adam optimizer with a learning rate of 0.001 and a weight decay of 1e-5. The model is trained for 50 epochs and the batch size is 16. These parameters are (manually) chosen to optimize the score on the validation dataset.
Loss function and training/validation accuracy in the training process
The following figure shows the training/validation loss and validation aP (averaged precision) per class during the training process. Validation loss stops to decrease after 30 epochs. However, validation aP continues to increase after 30 epochs. This indicates again that cross-validation loss might not be a good loss function.
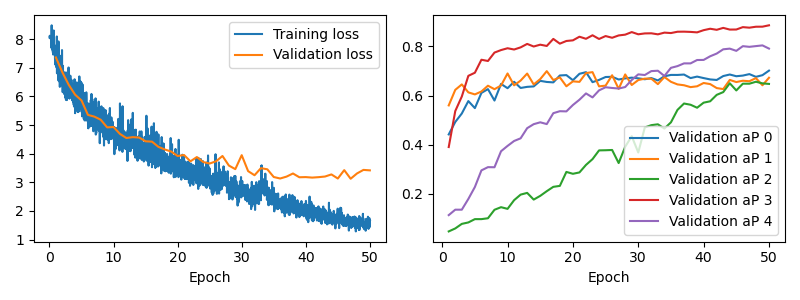
Another feature is that the aP for classes 2 and 4 increases at a much slower speed than classes 0, 1, and 3. These classes are green (pillar) and red (balcony). I think one of the reason is the much less number of labels for these two classes, another reason might be these classes require 3D (in-depth) understanding of the corresponding objects.
aP evaluated on the test dataset
I then evaluated the model on the test dataset. Here are the accuracy numbers:
- Average AP 0.590
- AP for class 0 is 0.611
- AP for class 1 is 0.671
- AP for class 2 is 0.228
- AP for class 3 is 0.832
- AP for class 4 is 0.605
Result on my photo
The following figure shows image segmentation results on a certain building taken near Lungarno Torrigiani, Firenze, Italy. Note that the small windows are captured nicely as "window", and the decoration above each window has black results indicating "others". Also, note the balconies are correctly identified. The noise at the top of the image is problematic as the result shows the model wrongly classified them as "facade" and "balcony". A few facades between windows are wrongly classified as "pillar", too.