We trained a CNN on the Fashion MNIST dataset. The number of samples in the training set is 54000. The number of samples in the validation set is 6000. The number of samples in the test set is 10000.
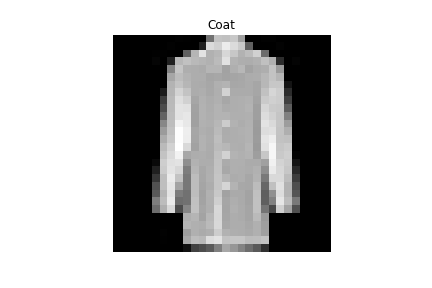
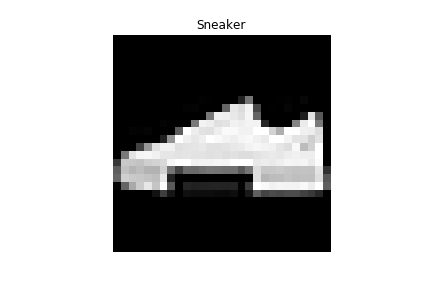
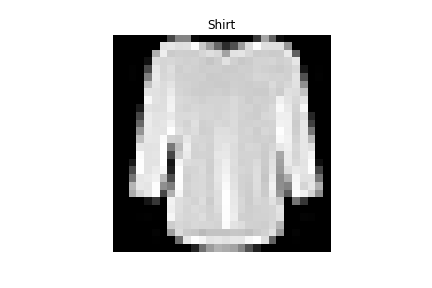
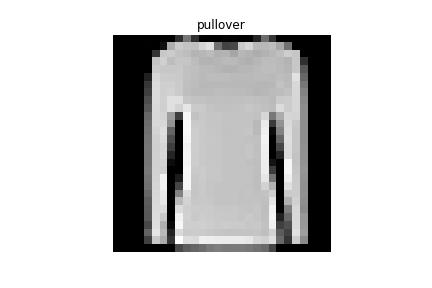
Here are a few samples from the dataset along with their class labels.
|
|
|
|
|---|---|---|---|
| Coat | Sneaker | Shirt | Pullover |
 |
|---|
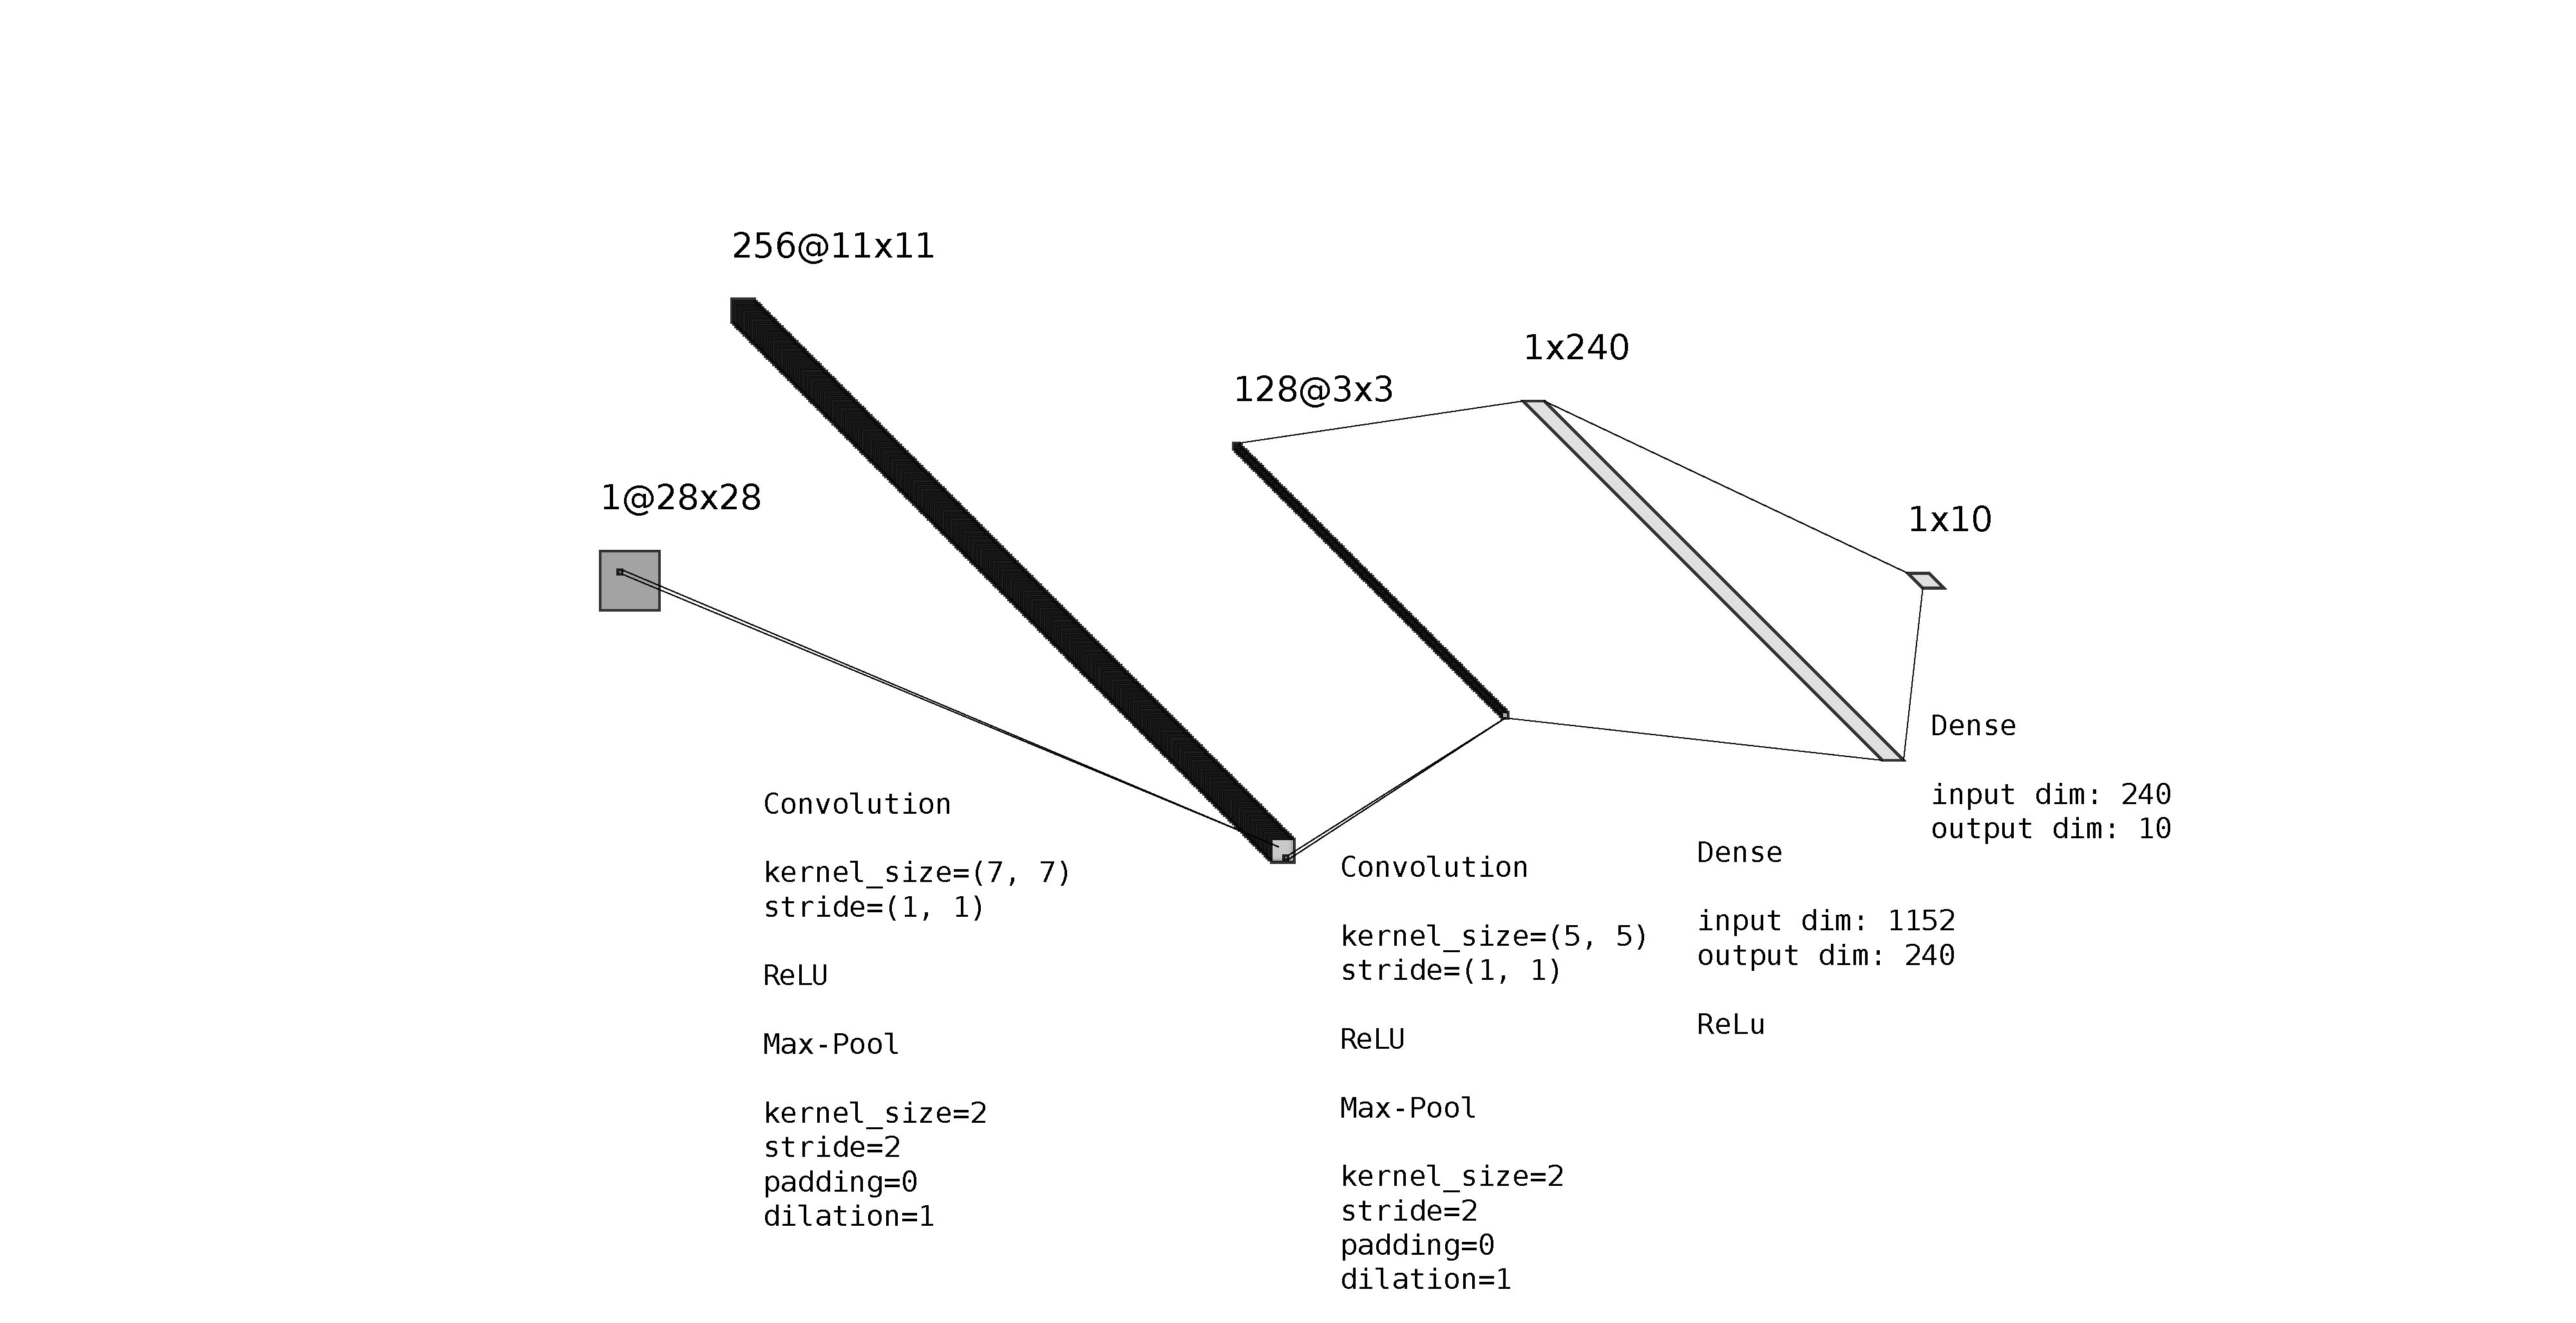
| The CNN Architecture |
The number of epochs was 80. The batch size was 32. We used cross entropy loss and Adam optimizer for training. The learning rate was set at 0.05, and the weight decay was set at 0.0
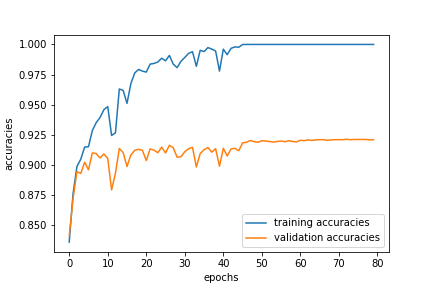
Here is the plot of the train and validation accuracies during the training process.
 |
|---|
| Accuracies during Training |
Here is the per-class accuracy from the validation set
| Class | Accuracy |
|---|---|
| Top | 89 % |
| Trouser | 97 % |
| Pullover | 90 % |
| Dress | 89 % |
| Coat | 89 % |
| Sandal | 97 % |
| Shirt | 72 % |
| Sneaker | 94 % |
| Bag | 98 % |
| Ankle boot | 96 % |
| Average | 91% |
From the table, Shirt is the hardest to get. The top four hardest to get classes are Shirt, Top, Coat, and Dress.
Here is the per-class accuracy from the test set.
| Class | Accuracy |
|---|---|
| Top | 86 % |
| Trouser | 98 % |
| Pullover | 87 % |
| Dress | 91 % |
| Coat | 86 % |
| Sandal | 97 % |
| Shirt | 75 % |
| Sneaker | 97 % |
| Bag | 97 % |
| Ankle boot | 96 % |
| Average | 91% |
From the table, Shirt is the hardest to get. The top four hardest to get classes are Shirt, Top, Coat, and Pullover.
Here are two samples the network classified correctly from each class
| Image | Class Label |
|---|---|
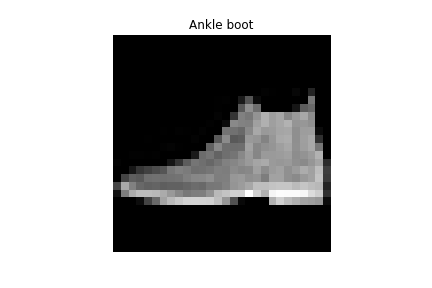 |
Ankle boot |
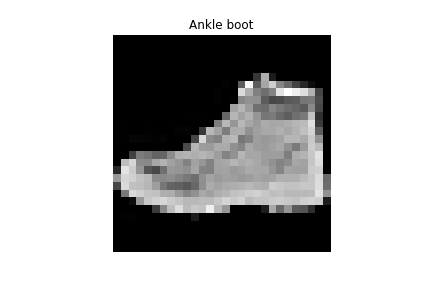 |
Ankle boot |
 |
Bag |
 |
Bag |
 |
Coat |
 |
Coat |
 |
Dress |
 |
Dress |
 |
Pullover |
 |
Pullover |
 |
Sandal |
 |
Sandal |
 |
Shirt |
 |
Shirt |
 |
Sneaker |
 |
Sneaker |
 |
Top |
 |
Top |
 |
Trouser |
 |
Trouser |
Here are two samples the network classified incorrectly from each class
| Image | Ground Truth Label | Prediction |
|---|---|---|
 |
Ankle boot | Sandal |
 |
Ankle boot | Sneaker |
 |
Bag | Pullover |
 |
Bag | Shirt |
 |
Coat | Pullover |
 |
Coat | Shirt |
 |
Dress | Shirt |
 |
Dress | Trouser |
 |
Pullover | Shirt |
 |
Pullover | Shirt |
 |
Sandal | Sneaker |
 |
Sandal | Sneaker |
 |
Shirt | Coat |
 |
Shirt | Dress |
 |
Sneaker | Ankle boot |
 |
Sneaker | Sandal |
 |
Top | Shirt |
 |
Top | Shirt |
 |
Trouser | Dress |
 |
Trouser | Pullover |
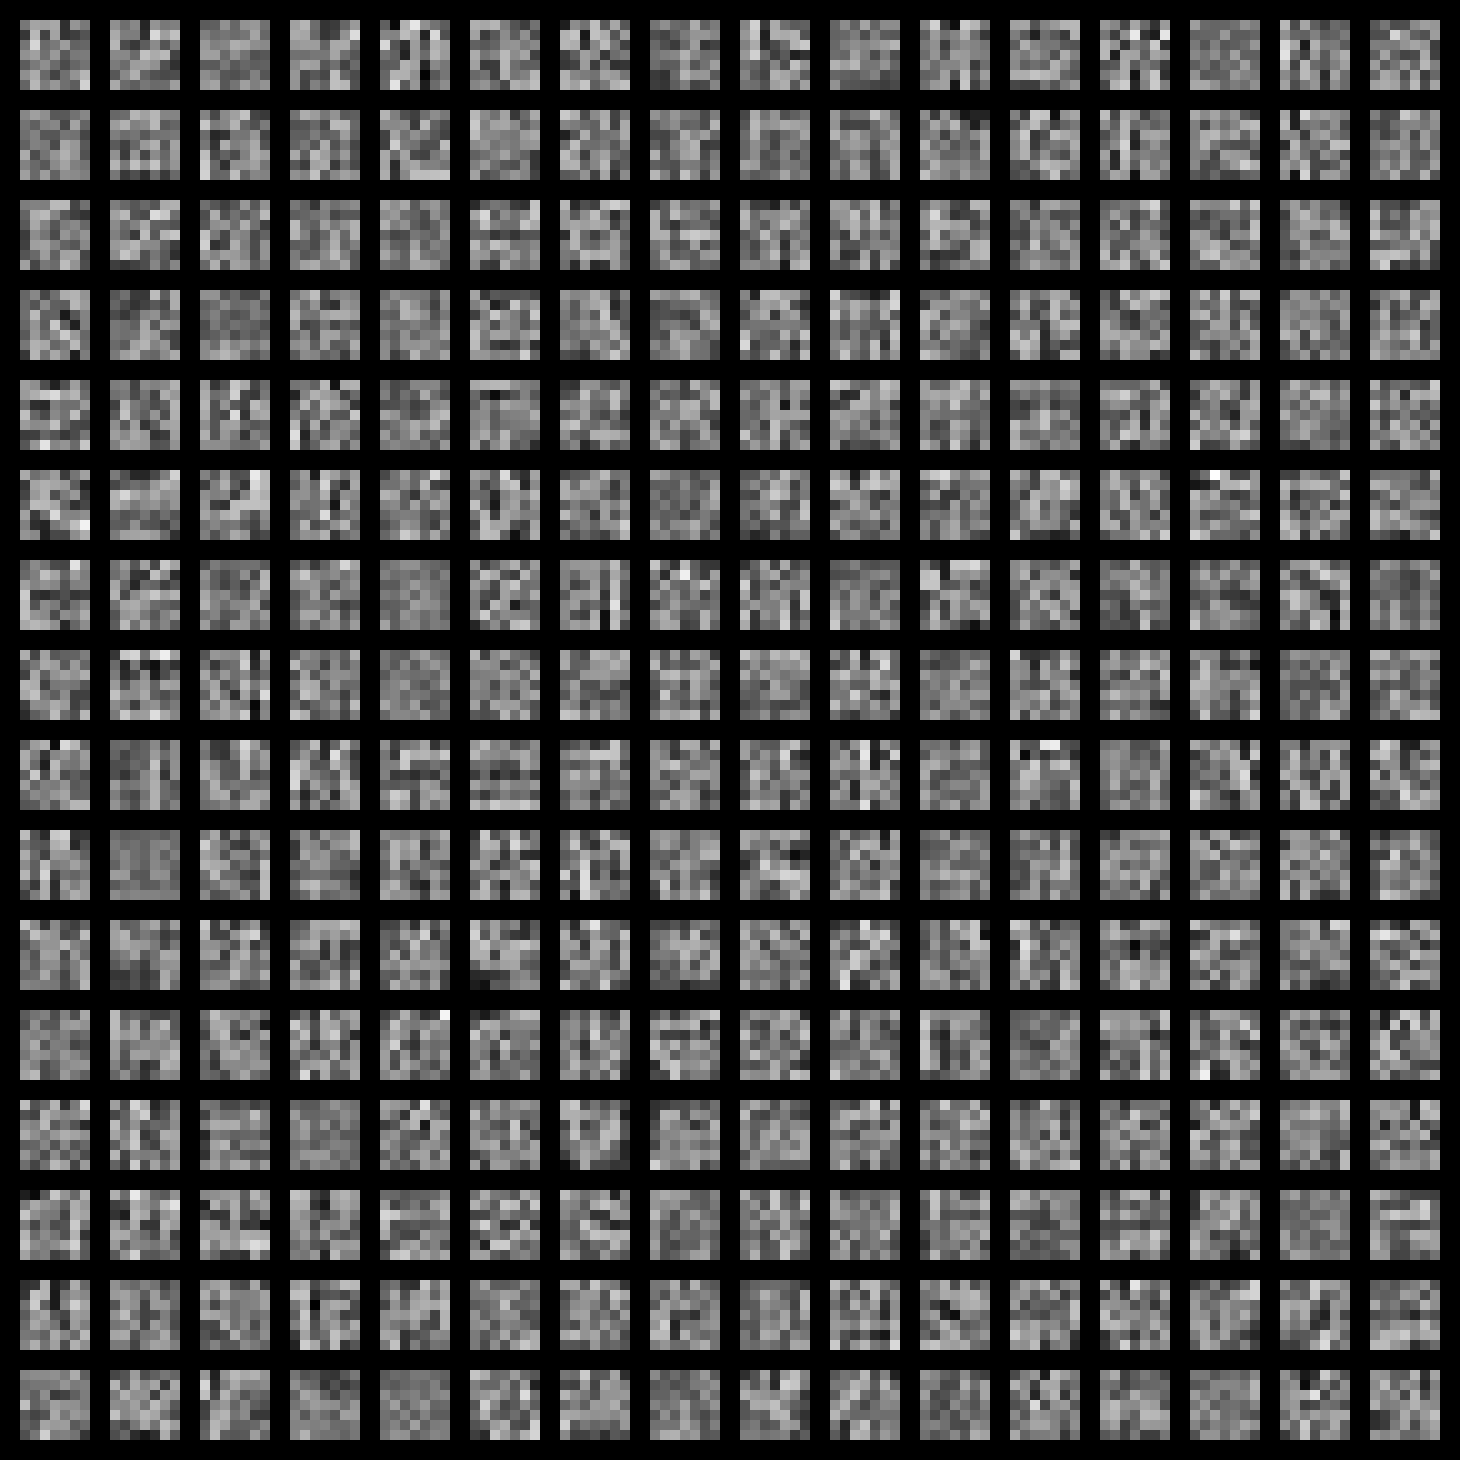
Here is the visualization of the learned filters from the first layer. The values are normalized to the range of 0 to 1.
 |
|---|
| Learned Filters |
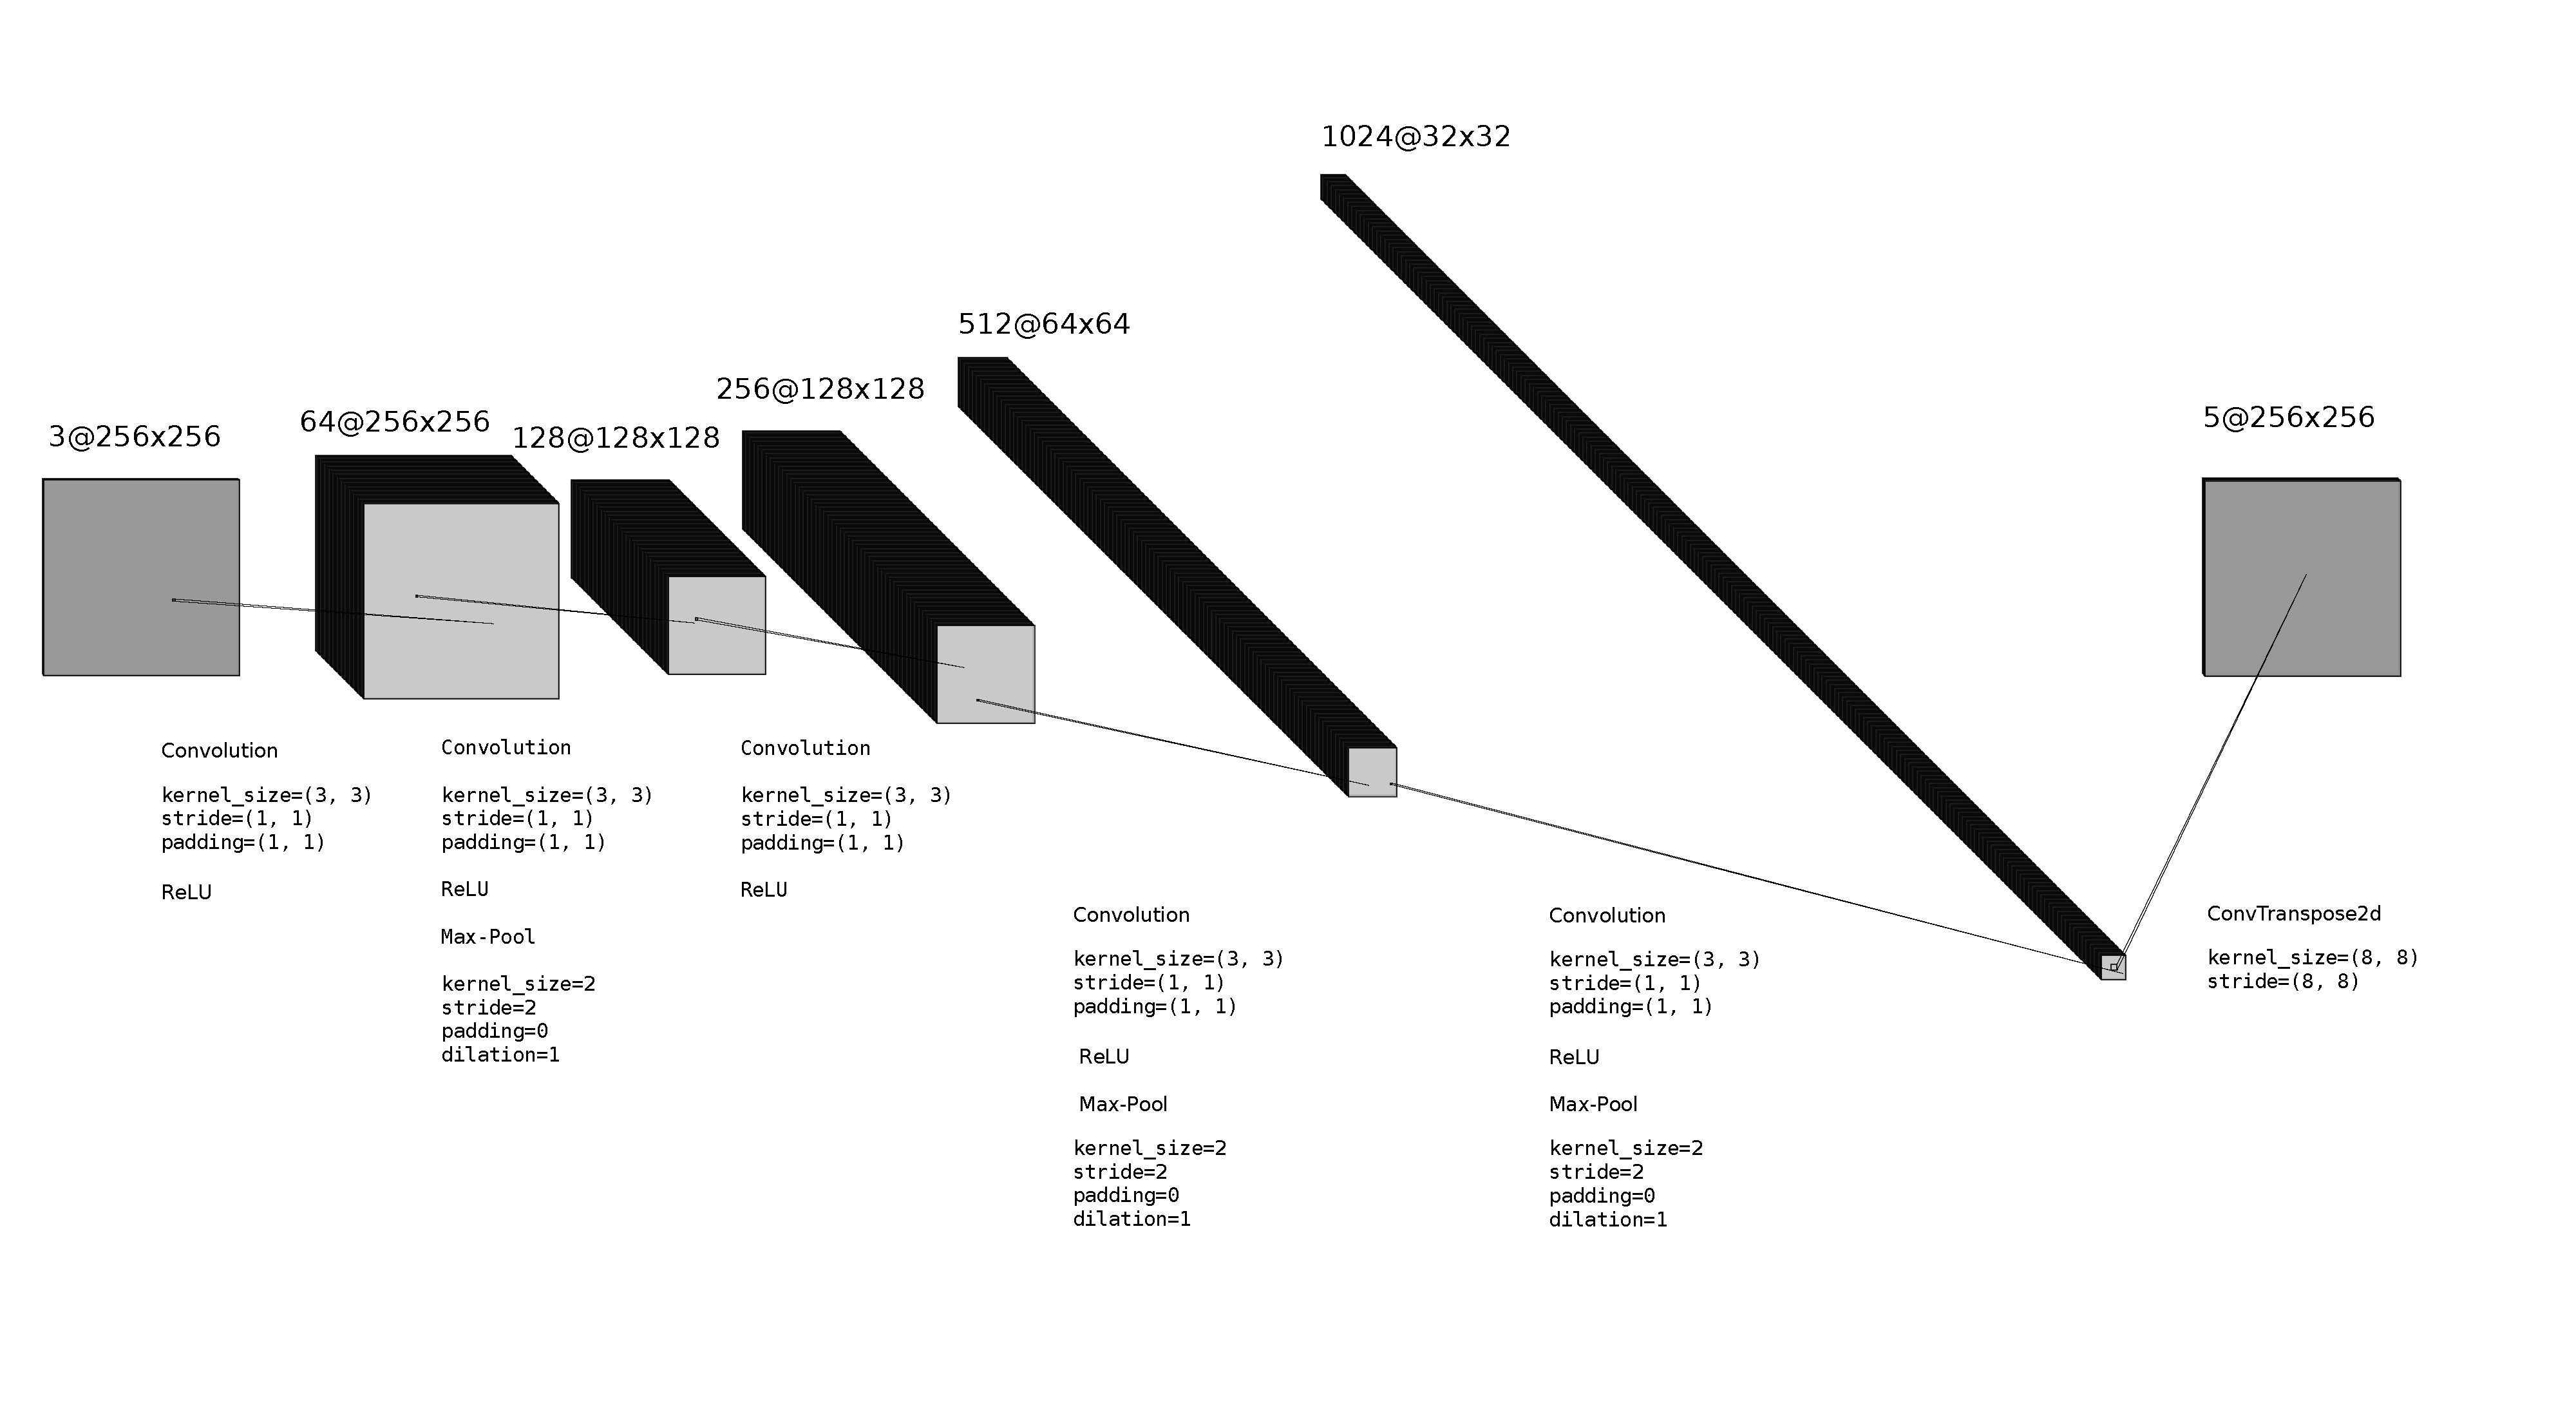
We trained a CNN on the Mini Facade dataset. The number of samples in the training set is 815. The number of samples in the validation set is 91. The number of samples in the test set is 114.
 |
|---|
| The CNN Architecture |
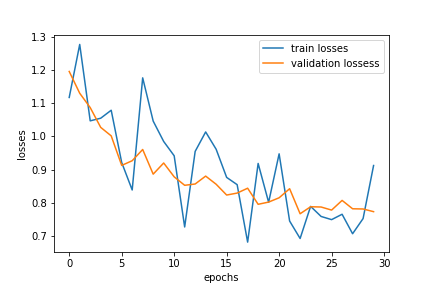
The number of epochs was 30. The batch size was 10. We used cross entropy loss and Adam optimizer for training. The learning rate was set at 0.0025, and the weight decay was set at 0.0001
 |
|---|
| Losses during Training |
The average precision(AP) on the test set was 0.569
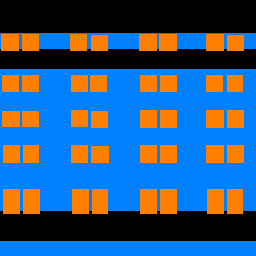
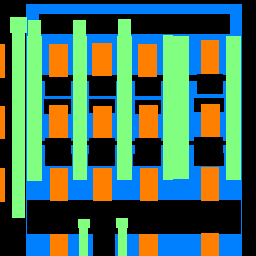
Here are a few sample predictions from the Mini Facade dataset.
| Image | Ground Truth | Prediction |
|---|---|---|
 |
 |
 |
 |
 |
 |
 |
 |
 |
 |
 |
 |
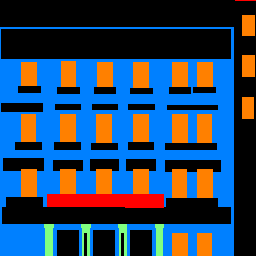
This is the result from running the trained model on the photo of a building from my own collection.
| Image | Prediction |
|---|---|
 |
 |
In general, the model did pretty good on parts of window and facade. It got it right for the windows in the image and the facades of the building are mostly correctly labeled. If failed on parts of pillar: as we can see, there are no pillars in the image yet the model labeled some parts as pillar in the prediction. It also failed on parts of balcony: the right side of the image are all balconies, but the model predicted them as window.