


In this project, we will use Convolutional Neural Network (CNN) to solve classication of images in the Fashion MNIST dataset and semantic segmentation of images in mini Facade dataset.
In this part, we aim to classify images in the Fashion MNIST dataset to one of the ten categories. I used 50000 images for training, 30000 for validation, and another 30000 for testing. Here are some example pictures in the training set along with there labels
| Shirt | Ankle boot | Shirt | Coat | Bag |
|---|---|---|---|---|
|
|
|
|
|
 |
| Category | Validation Accurary | Test Accuracy |
|---|---|---|
| T-shirt/top | 83% | 85% |
| Trouser | 92% | 90% |
| Pulllover | 96% | 94% |
| Dress | 80% | 79% |
| Coat | 92% | 92% |
| Sandal | 81% | 87% |
| Shirt | 72% | 71% |
| Sneaker | 93% | 94% |
| Bag | 98% | 93% |
| Ankle Boots | 97% | 92% |
| Average | 88% | 87% |
| Category | Correct #1 | Correct #2 | Misclassified #1 | Midclassified #2 |
|---|---|---|---|---|
| T-shirt/top |  |
 |
 Classfied as coat |
 Classfied as shirt |
| Trouser |  |
 |
 Classfied as dress |
 Classfied as dress |
| Pullover |  |
 |
 Classfied as shirt |
 Classfied as coat |
| Dress |  |
 |
 Classfied as shirt |
 Classfied as coat |
| Coat |  |
 |
 Classfied as shirt |
 Classfied as coat |
| Sandal |  |
 |
 Classfied as sneaker |
 Classfied as ankle boots |
| Shirt |  |
 |
 Classfied as coat |
 Classfied as t-shirt/top |
| Sneaker |  |
 |
 Classfied as ankle boots |
 Classfied as bag |
| Bag |  |
 |
 Classfied as t-shirt/top |
 Classfied as shirt |
| Ankle boot |  |
 |
 Classfied as sandal |
 Classfied as sneaker |
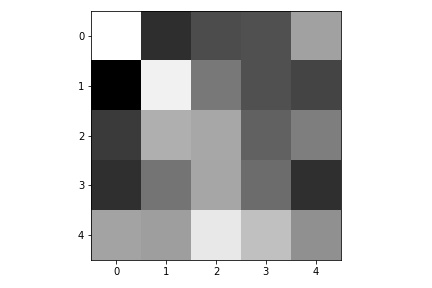
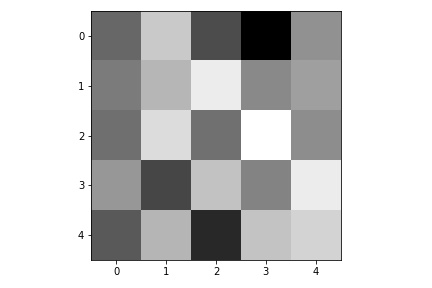
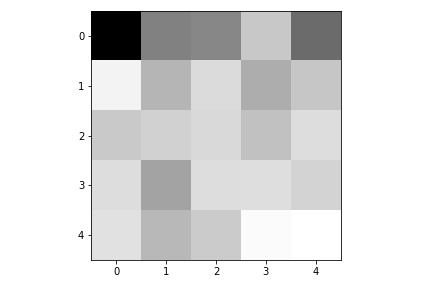
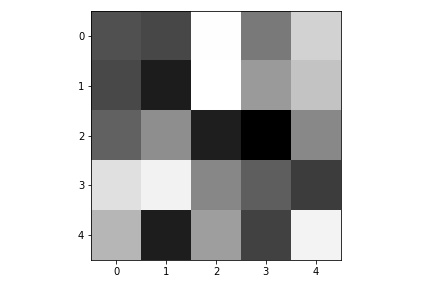
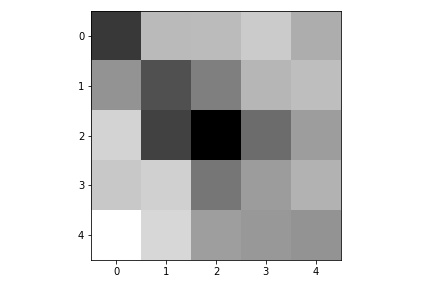
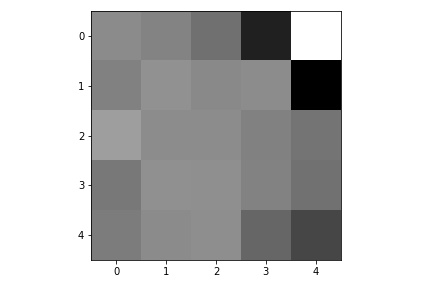
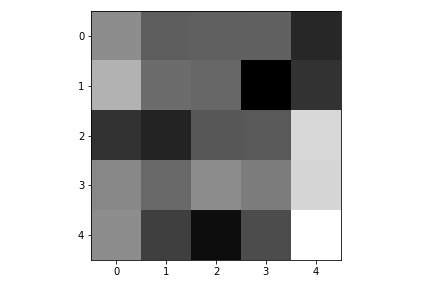
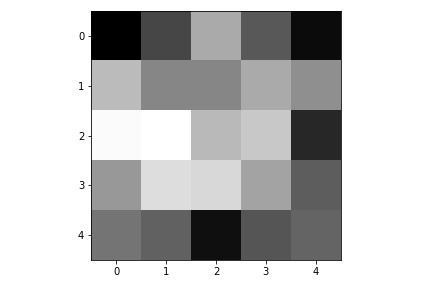
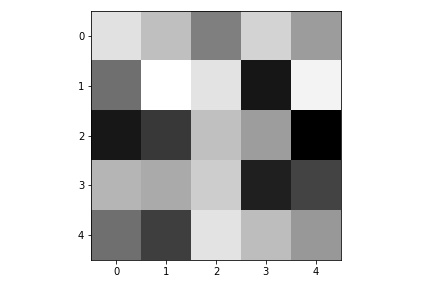
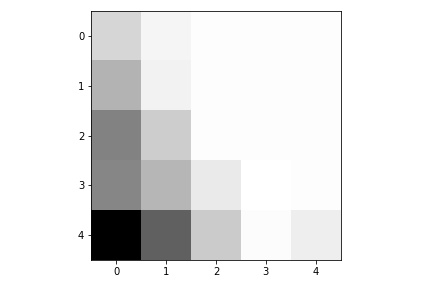
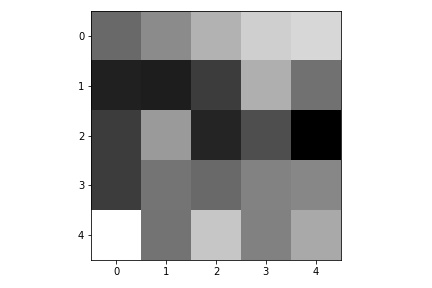
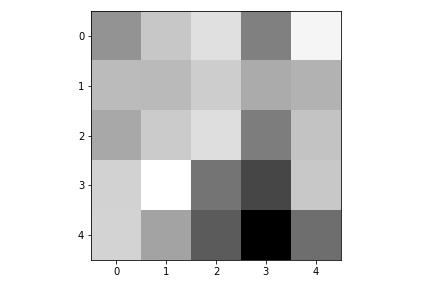
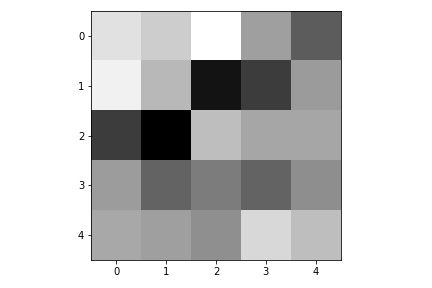
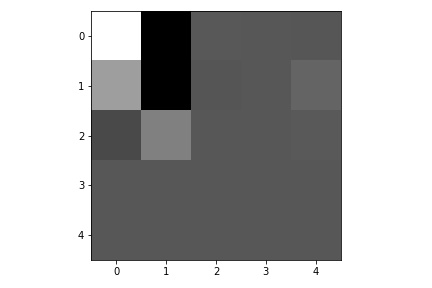
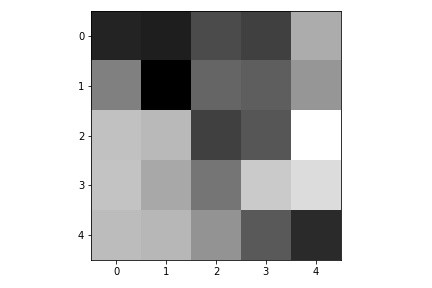
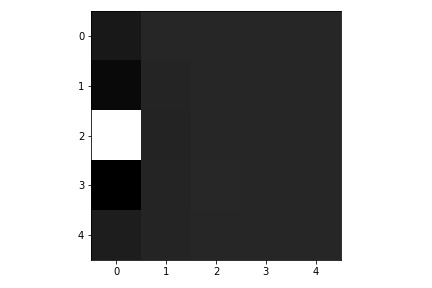
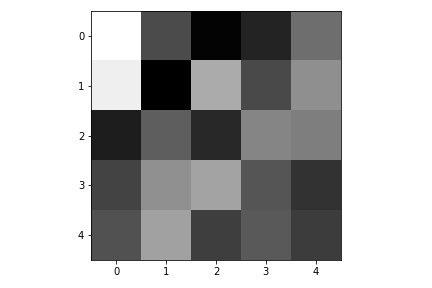
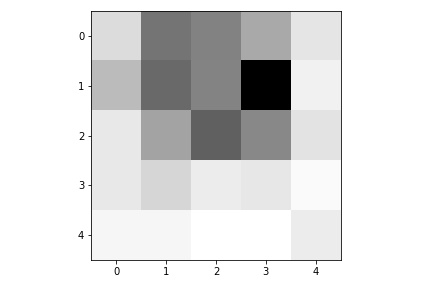
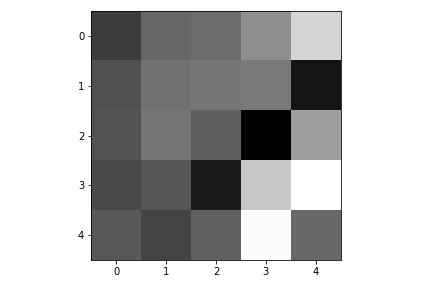
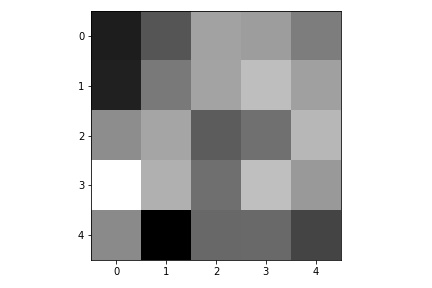
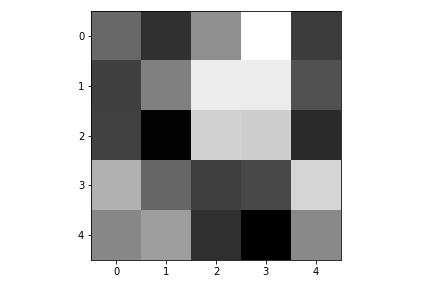
Here are the learned filters in the first convolutional layers.
 |
 |
 |
 |
 |
 |
 |
 |
 |
 |
 |
 |
 |
 |
 |
 |
 |
 |
 |
 |
 |
 |
 |
 |
 |
 |
 |
 |
 |
 |
 |
 |
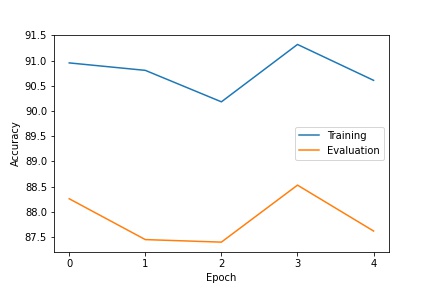
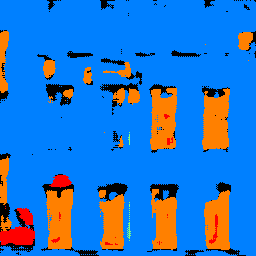
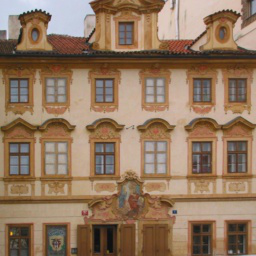
In this part, we aim to classify each pixel of images in the Facade Dataset to one of the five categories. I used the first 707 images in the training set as training images and set side the last 200 images in the training set as evaluation data set.
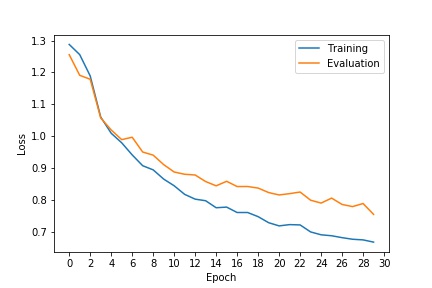
After hyperparameter tuning, I settled on the following architecture with 6 layers and alternating between maxpooling and upsampling in layer 2-5. After experimenting with different number channels, I noticed that increasing the number of channels in a certain layer alone by a factor of 2-4 will not significantly increase the average AP than the current result. With filter sizes, I used larger 5-by-5 filters in the begining to have a larger area vision and used 3-by-3 filters in the following layers to reduce computational costs.
 |
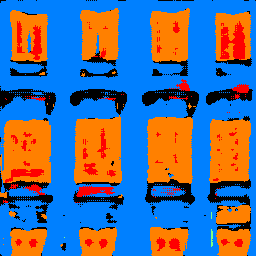
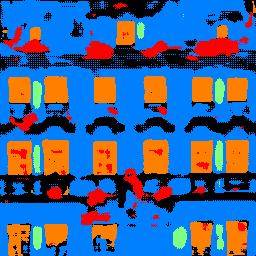
Here is the average precision of five classes. Notice that the classifier did a decent job on distinguish facade, balcony and others while did poorly on distinguishing pillars.
| Category | AP |
|---|---|
| Others | 68.22% |
| Facade | 78.43% |
| Pillar | 15.12% |
| Window | 83.08% |
| Balcony | 44.78% |
| Average | 57.92% |
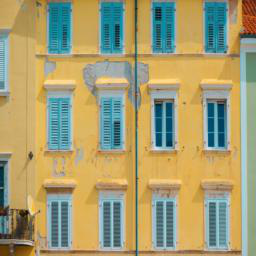
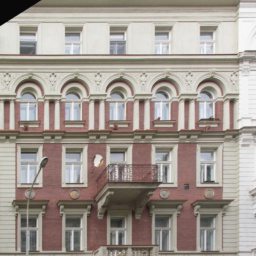
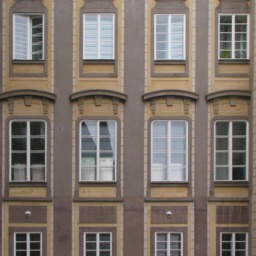
Here are some labeled images where the first one was not part of the original test set.
| Original Image | Labeled Image |
|---|---|
 |
 |
 |
 |
 |
 |
 |
 |