I trained a neural network with four convolution layers on the Fashion MNIST dataset with the following 10 classes:
| Label | 0 | 1 | 2 | 3 | 4 | 5 | 6 | 7 | 8 | 9 |
| Class | T-Shirt | Trouser | Pullover | Dress | Coat | Sandal | Shirt | Sneaker | Bag | Ankle Boot |
I trained a neural network with four convolution layers on the Fashion MNIST dataset with the following 10 classes:
| Label | 0 | 1 | 2 | 3 | 4 | 5 | 6 | 7 | 8 | 9 |
| Class | T-Shirt | Trouser | Pullover | Dress | Coat | Sandal | Shirt | Sneaker | Bag | Ankle Boot |
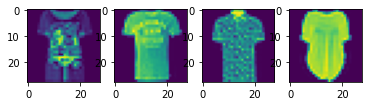
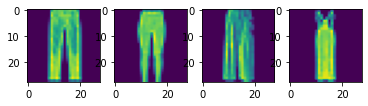
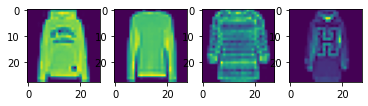
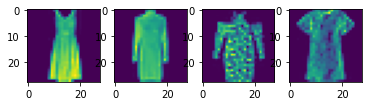
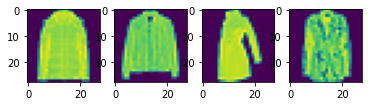
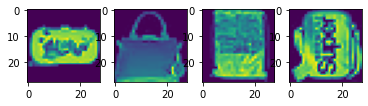
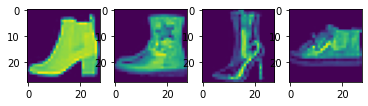
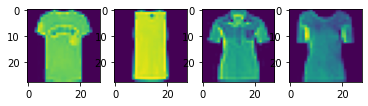
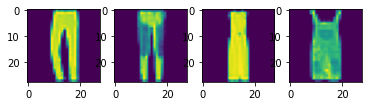
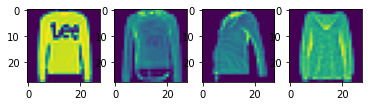
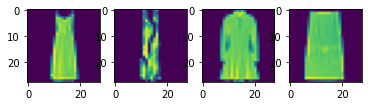
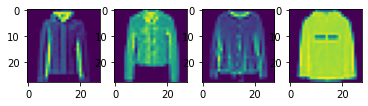
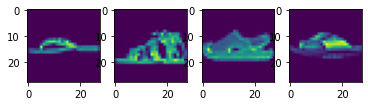
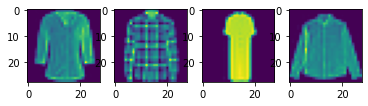
I split the 60,000 images in the training set data into a training set with 48,000 images and a validation set with 12,000 images. Here are some samples images from the training set:
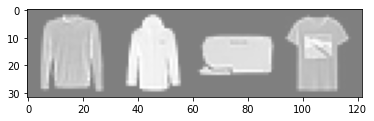 Fashion MNIST Training Set Sample Images of a Pullover, Coat, Bag, and T-Shirt, respectively
Here is my neural network applied sequentially from left to right:
| Conv2d: 1-32 (3 by 3) | ReLU | Conv2d: 32-32 (3 by 3) | ReLU | MaxPool2D (2 by 2) | Conv2d: 32-64 (3 by 3) | ReLU | Conv2d: 64-64 (3 by 3) | ReLU | MaxPool2D (2 by 2) | FC: 1024-256 | FC: 256-10 |
Here is a plot of the training and validation accuracy per epoch.
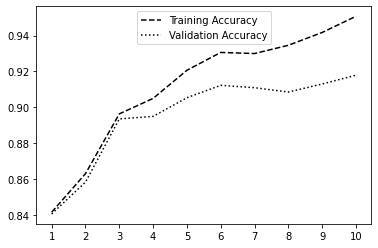 Training and Validation Accuracy for 10 Epochs
Below is the per-class accuracy of the validation set & the testing set:
The network has the most trouble differentiating between t-shirts, pullovers, coats, and shirts. This is understandable because all four categories share the similar structure of a somewhat blocky rectangular shape.
For each class, here are some examples of correctly and incorrectly classified images:
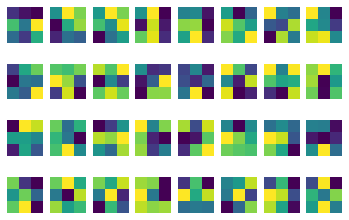
Here are the visualized filters for the first layer of convolution. I had 32 channels, with each channel consisting of a 3x3 filter.
I trained a neural network with six convolution layers on the Mini Facade dataset with the following 5 classes:
| Class | Color | Pixel Value |
|---|---|---|
| others | black | 0 |
| facade | blue | 1 |
| pillar | green | 2 |
| window | orange | 3 |
| balcony | red | 4 |
Here is my neural network applied sequentially from left to right:
| Conv2d: 3-32 (3 by 3) | ReLU | MaxPool2D (2 by 2) | Conv2d: 32-64 (3 by 3) | ReLU | MaxPool2D (2 by 2) | Conv2d: 64-128 (3 by 3) | ReLU | MaxPool2D (2 by 2) | Conv-Transpose-2D: 128 | Conv2d: 128-64 (3 by 3) | ReLU | Conv-Transpose-2D: 64 | Conv2d: 64-32 (3 by 3) | ReLU | Conv-Transpose-2D: 32 | Conv2d: 32-5 (3 by 3) |
I modelled my neural network for this part after the one I created in the previous part, thus I opted to use the same loss function (CrossEntropyLoss) and to have a convolution network followed by a rectilinear unit before max pooling. In order for dimensions to work out, I followed the advice listed in specs recommending ConvTranspose2d for every MaxPool2d layer. I also noticed that I needed to add more layers to increase the validation accuracy, so I used the maximum number of convolution layers according to specs, which stated 5-6. To select hyperparameters, I just increased the number of epochs to 25 until the validation error seemed to stay the same. Some additional experimentation demonstrated that adding more channels to my convolution layers made the validation accuracy increase until I added too many and then it started decreasing, most likely due to overfitting.
Below is a plot of the training and validation accuracy per epoch.
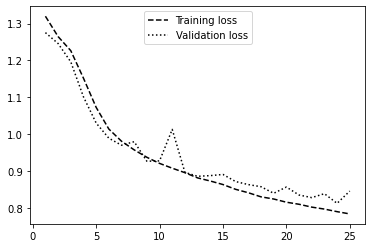 Training and Validation Loss for 25 Epochs
Below is the average precision of my network calculated on the testing set:
Average AP: 0.55261863535
| Class | Average Precision |
|---|---|
| others | 0.6705710087253407 |
| facade | 0.7861797879915271 |
| pillar | 0.07096875925096052 |
| window | 0.8125927422378851 |
| balcony | 0.42278087856745156 |
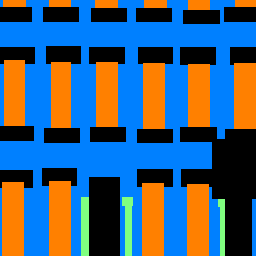
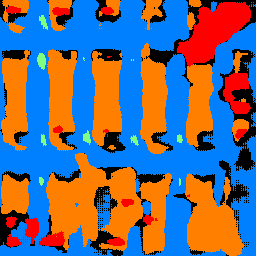
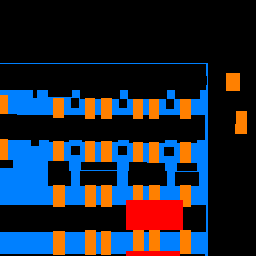
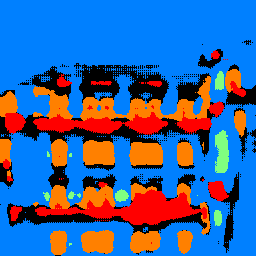
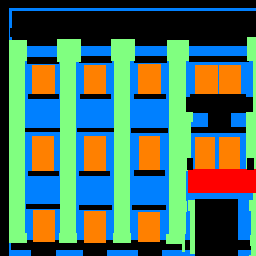
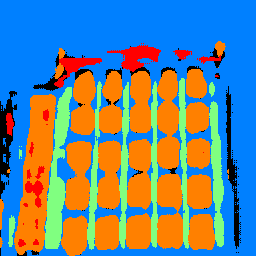
Here are some examples of my network's output from the testing set:
The model performs well when identifying facade and windows. It does not do as well with balconies and does extremely poorly with pillars.
This makes sense because the majority of a building in the test images is composed of mostly facade and windows. As a result, the prior probabilities of those two values are much higher so the model would be more likely to guess one of those two categories even when the conditional probability of another class may be higher than those of these two classes. For a similar reason, the area coverages of balconies and pillars of the training images are very low, thus their prior probabilities are also low. This means that the model would be less likely to guess pillars or balconies, and so the false negative rates for these two classes are very high.
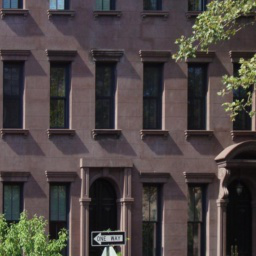
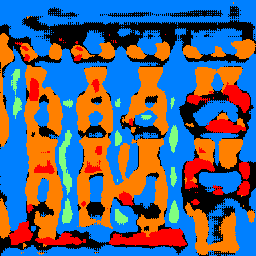
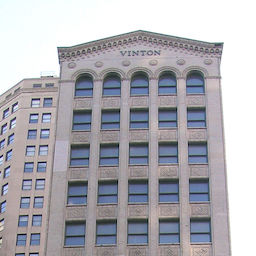
The last image and output pair is a picture I found online when I just searched for building images that I then cropped to be of size 256 by 256 in RGB. It classified the large windows quite well, but seemed to do poorly with the many little windows, which it either classified as entirely facade or just one large windows with random balconies. It classified the sky as part of the facade, demonstrating the large false positive rate when classifying the facade category. For the parts of the building along the window, my model classified them as pillars, which makes sense because they share many pillar properties (ie long, vertical, and surrounding sides not facade), even though it should just be facade.