by Suraj Rampure (suraj.rampure@berkeley.edu, cs194-26-adz)
In this project, we train convolution neural networks for classification and segmentation tasks.
Here, we trained a neural network in order to classify images from the FashionMNIST dataset. Each image is greyscale, of size 28x28, and belongs to one of 10 classes:
| Label | 0 | 1 | 2 | 3 | 4 | 5 | 6 | 7 | 8 | 9 |
|---|---|---|---|---|---|---|---|---|---|---|
| Mapping | t-shirt | trouser | pullover | dress | coat | sandal | shirt | sneaker | bag | ankle boot |
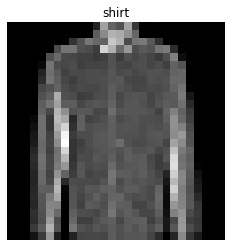
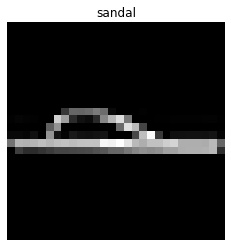
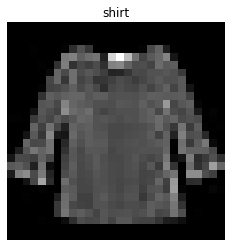
Here are a few visualized images, along with their classes:
After some tweaking, I ended with the following sequence of layers:
To train the network, I used the following:
The following figure provides the training and validation accuracies, computed as the model trained. I used a train-valid split of 20%.
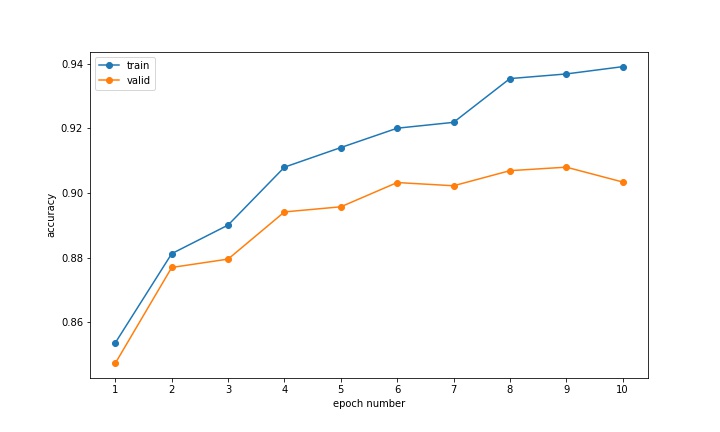
After around 6 epoches, the training accuracy failed to increase significantly, while the training accuracy continued to rise, likely signalling overfitting to the training data.
The final testing accuracy on the model was 90%. The per-class testing accuracies are provided below:
| Class | Accuracy |
|---|---|
| t-shirt | 0.832 |
| trouser | 0.97 |
| pullover | 0.904 |
| dress | 0.871 |
| coat | 0.838 |
| sandal | 0.973 |
| shirt | 0.728 |
| sneaker | 0.955 |
| bag | 0.963 |
| ankle boot | 0.979 |
The model does quite well on most classes, but somewhat struggles with shirt (sub-75% testing accuracy).
Below, each row corresponds to a class. The first two columns contain correct classifications of that class, and the last two columns contain incorrect classifications.
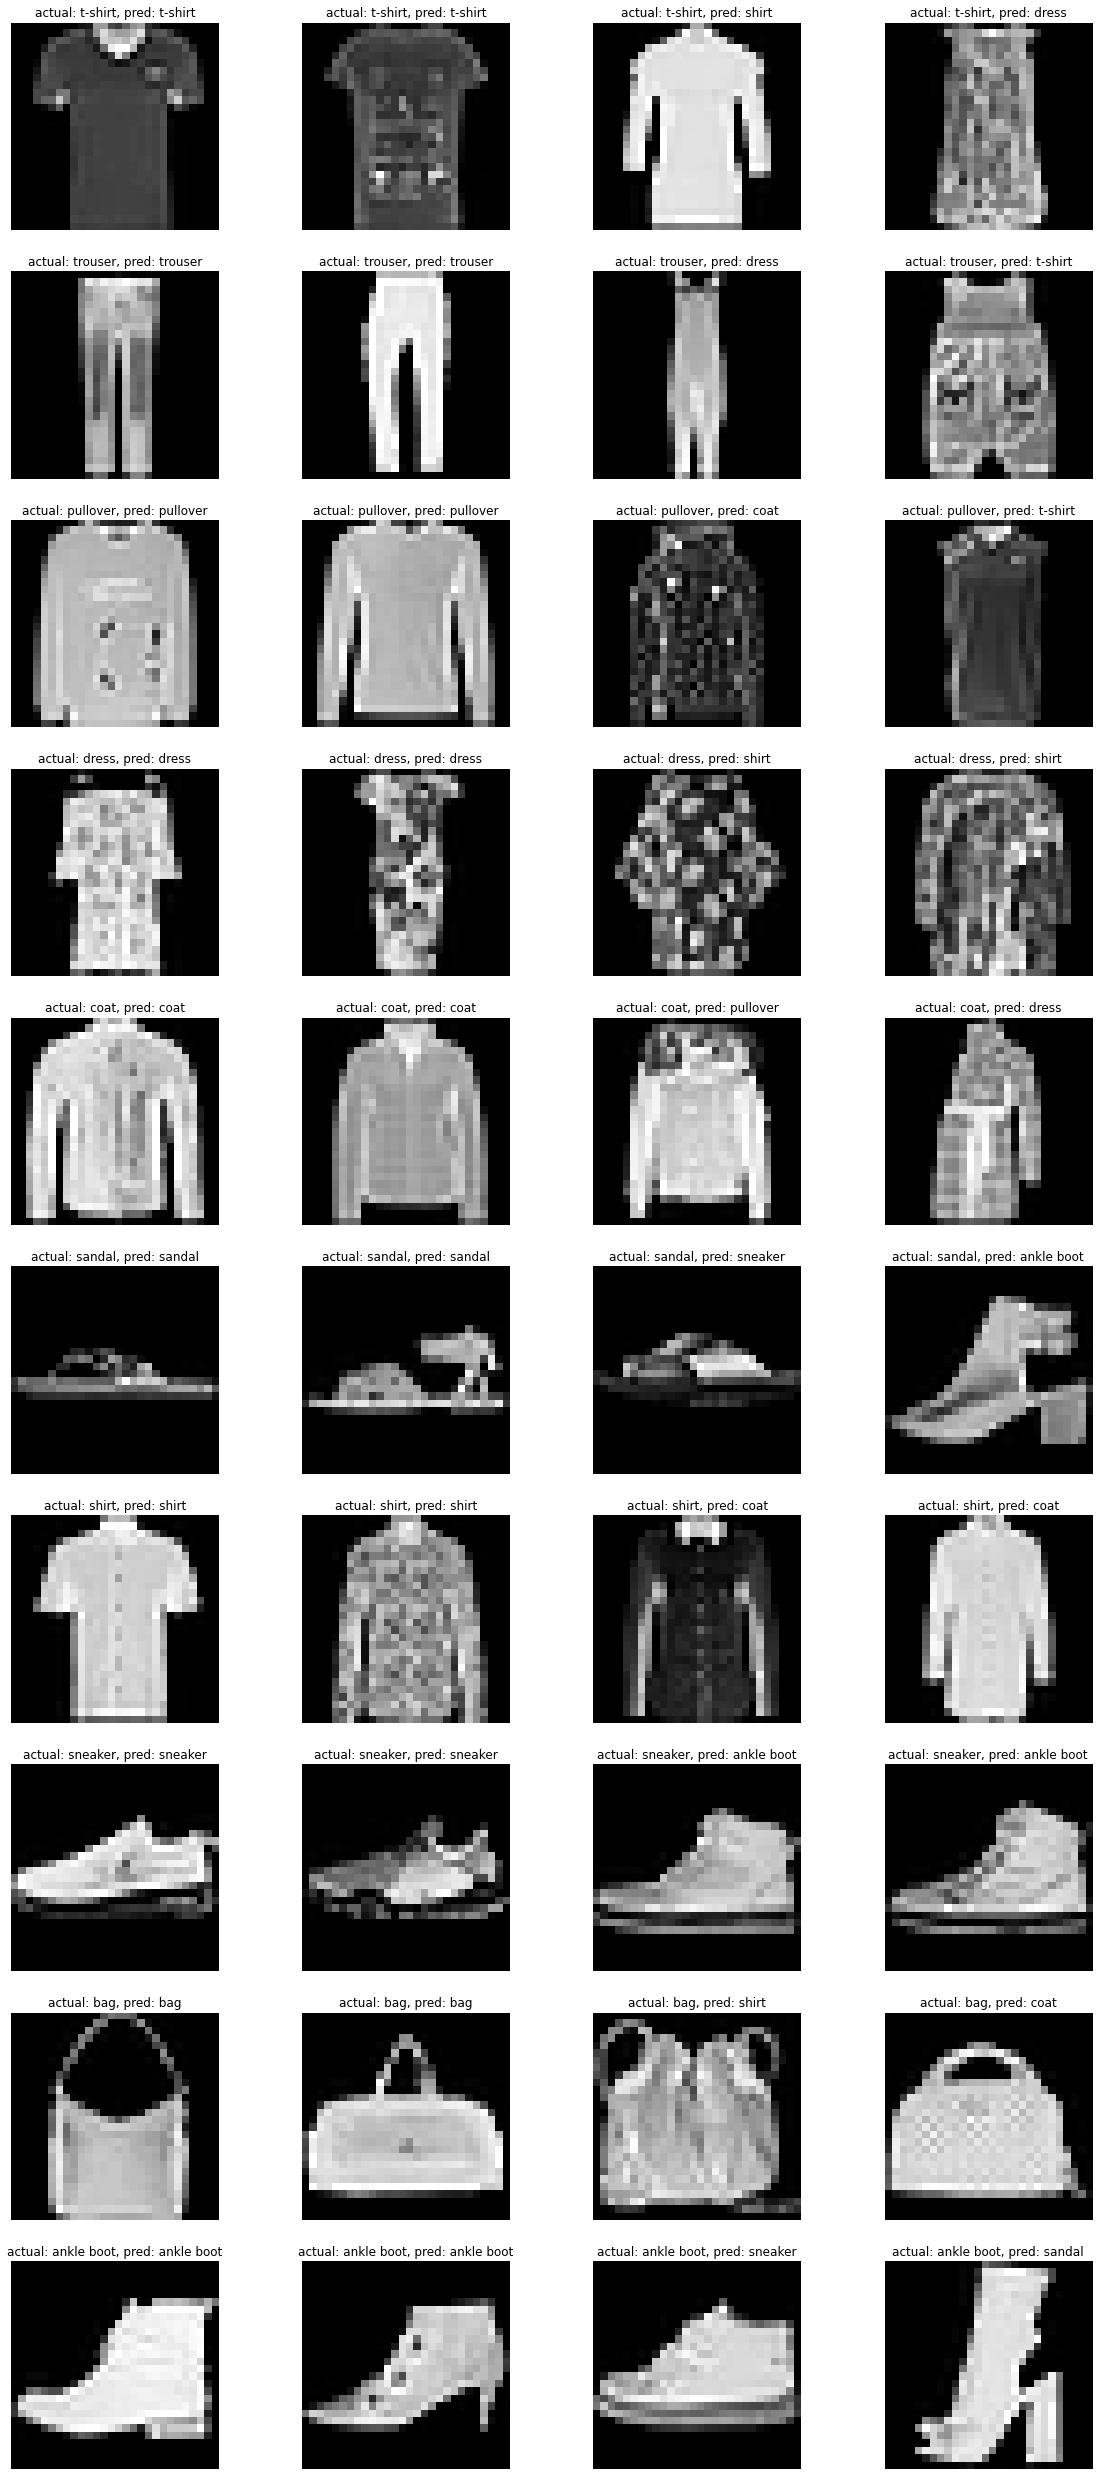
Unsurprisingly, many of the incorrect classifications come from testing set examples that look atypical compared to most of the members in the correct class.
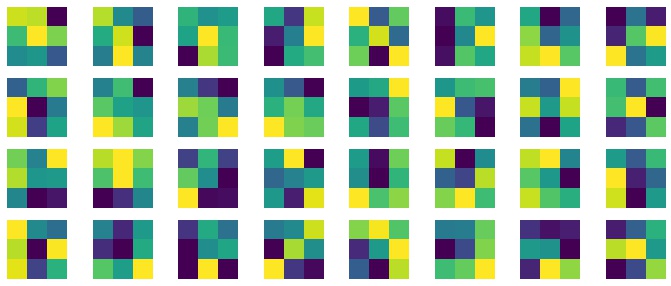
In the first convolutional layer, there were 32 filters, each of size 3x3 and depth 1 (since our input images only had one channel).
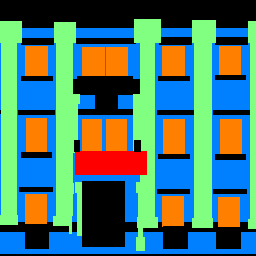
In this part, the task was to train a net to label each pixel of an image as being either a balocy, window, pillar, facade, or other. Our training data came from the Mini Facade dataset.
My final model featured seven convolutional layers, with 64, 128, 256, 512, 512, 128, and 5 output layers, respectively. All used a 3x3 kernel, with the exception of the fifth, which used a 1x1 kernel. I placed a ReLU activation after each layer (except for the last). In addition, my net had:
To train the network, I used the following:
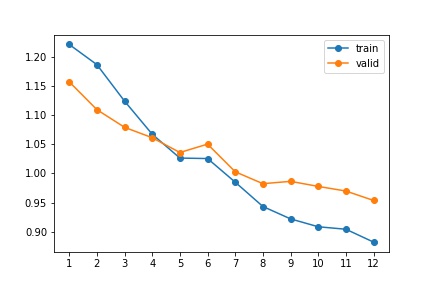
The following figure provides the training and validation losses, computed as the model trained. There were 906 training images provided; I used 800 for training and the remaining 106 for validation.
The mAP (mean average precision) of my model was 0.467. Below is the per-class AP:
| Class | AP |
|---|---|
| others (black) | 0.610 |
| facade (blue) | 0.612 |
| pillar (green) | 0.124 |
| window (orange) | 0.524 |
| balcony (red) | 0.465 |
Clearly, the model struggled with classifying pillars, with a paltry 12.4% average precision.
In example 21 from the test set, the model performs pretty well. It is able to generally capture the shape of each balcony and window, and did not classify very much as a pillar. From left to right, the original image, ground truth segmentation, and result of the model are presented below (note the classes corresponding to each color are in the above table):
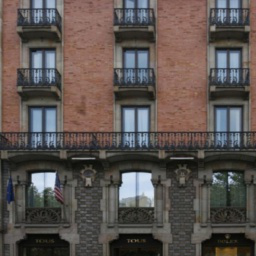
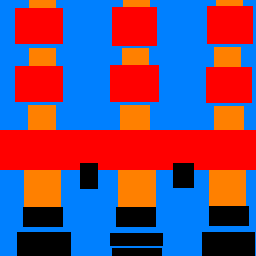
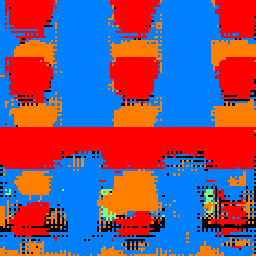
However, in example 44 from the test set, things don’t look so good. The model failed to identify much of the pillar space, and seemed to think the windows were larger and more connected than they really were.
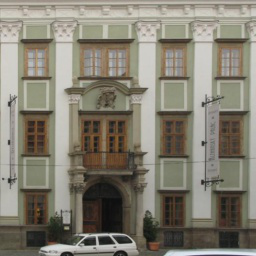
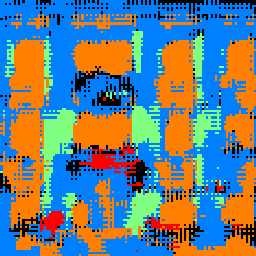
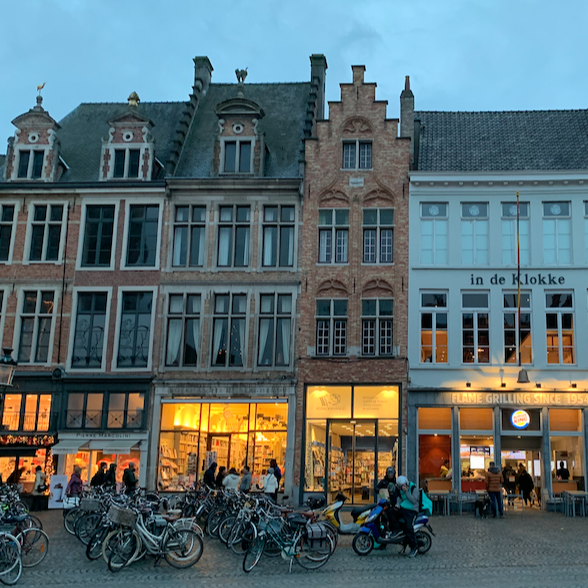
Lastly, I ran the model on an image that I took in Brugge, Belgium. It doesn’t perform very well; it fails to identify the small gaps between the many windows in the image (there is a lot more orange than there should be). There are no balconies in the image, and it identified very little as being red, which is good (though there are some red patches). It also correctly identified most of the facade (the excess regions of blue are the sky and ground, which the model isn’t trained to predict; it makes sense that it classifies these regions as facade, though).