CS194 Project #4: Classification and Segmentation
Part I: Image Classification
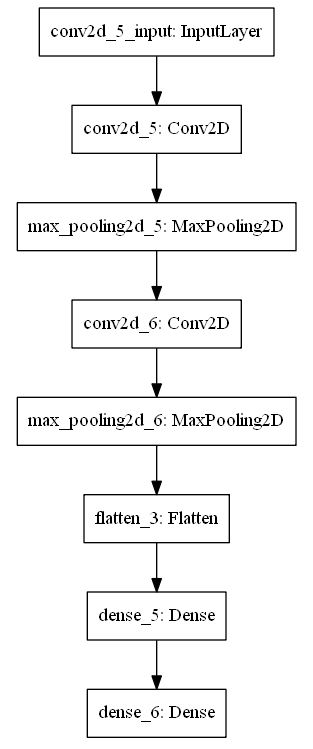
For this problem, I used keras with tensorflow as my backend. I defined my model as the following:
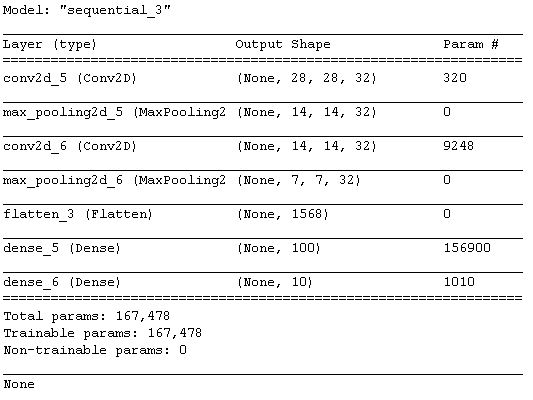
The loss was categorical crossentropy and the optimizer was Adam with learning rate of 0.001.
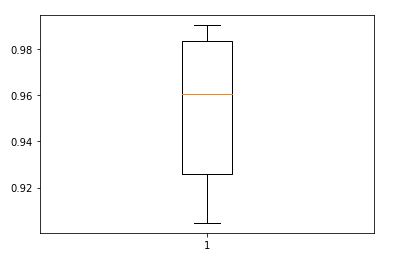
First I evaluated the model using 5-fold cross validation on training data with 10 epochs to see how well the model will perform before actually fit the model with more epochs. The results of the 5-fold cross validation are 90.467, 92.575, 96.058, 98.342, and 99.025. Overall the model seems pretty good. I have also plot the 5-fold cross validation cross entropy loss and Classification accuracy, as well as the model confidence interval as shown below.
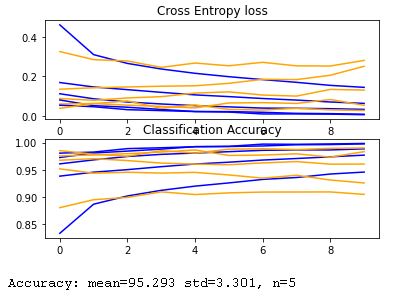
and Classification accuracy
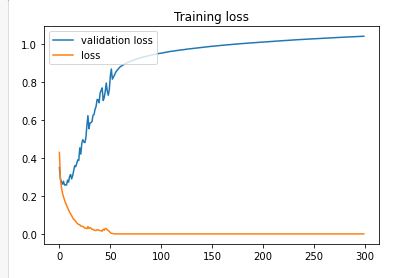
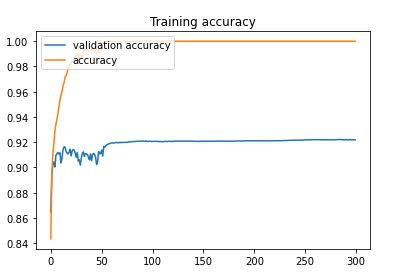
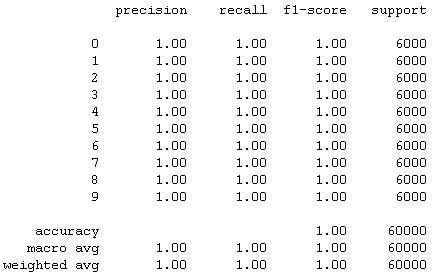
For the actual training I fit the model with 300 epochs with checkpoints to save the model with the best validation loss and the best validation accuracy. The training loss and the training accuracy are shown below. The loss keeps increases after about 20 epochs while the accuracy plateaued at around 92%. This suggested that the model might be overfitting to the training data. For the next section, I will present the results of the best accuracy model and the best loss model side by side. The best accuracy model predicted 92.210% of the test data correctly and 100% of the training data correctly. The best loss model predicted 90.960% of the test data correctly and 94.255% of the training data correctly.
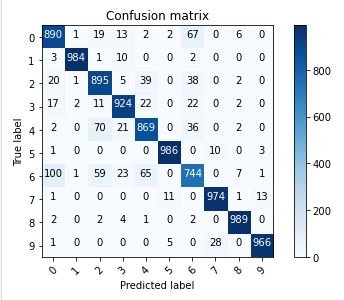
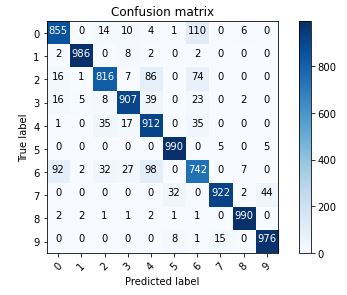
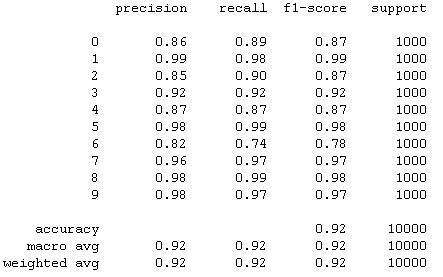
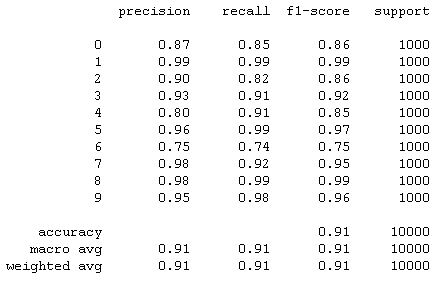
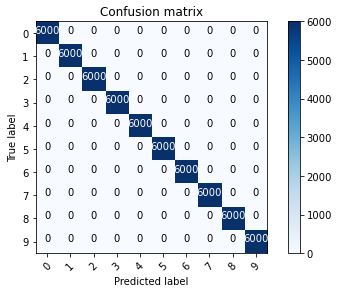
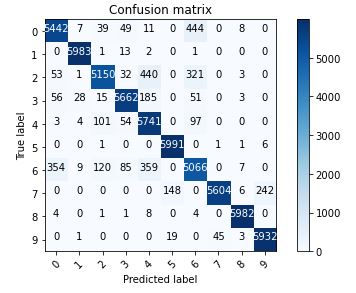
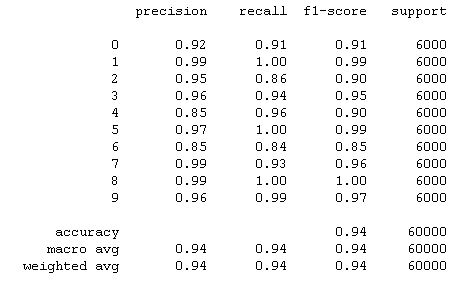
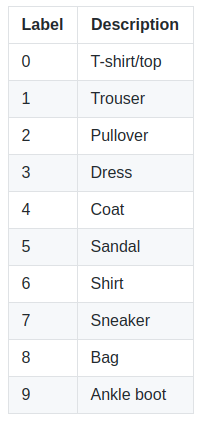
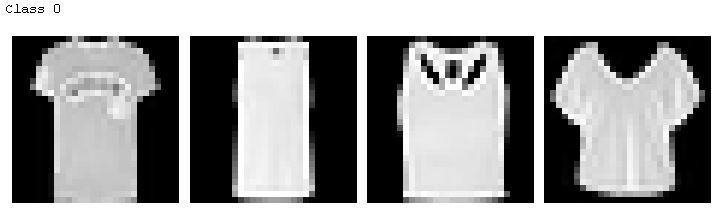
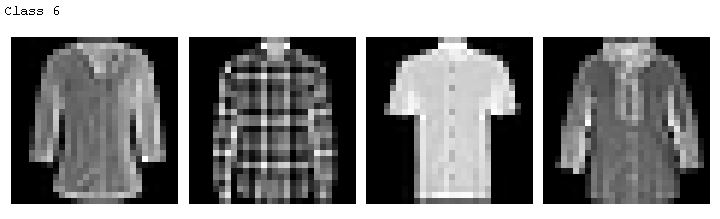
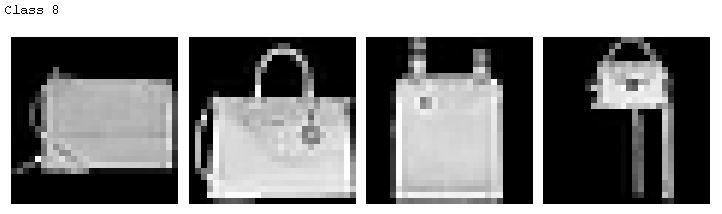
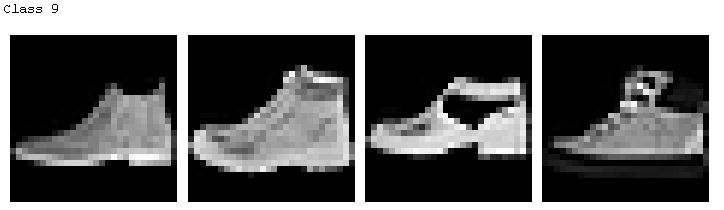
The hardest classes to get are class 0 T-shirt/top and class 6 Shirt. It is especially difficult to distinguish between T-shirt/top and Shirt.
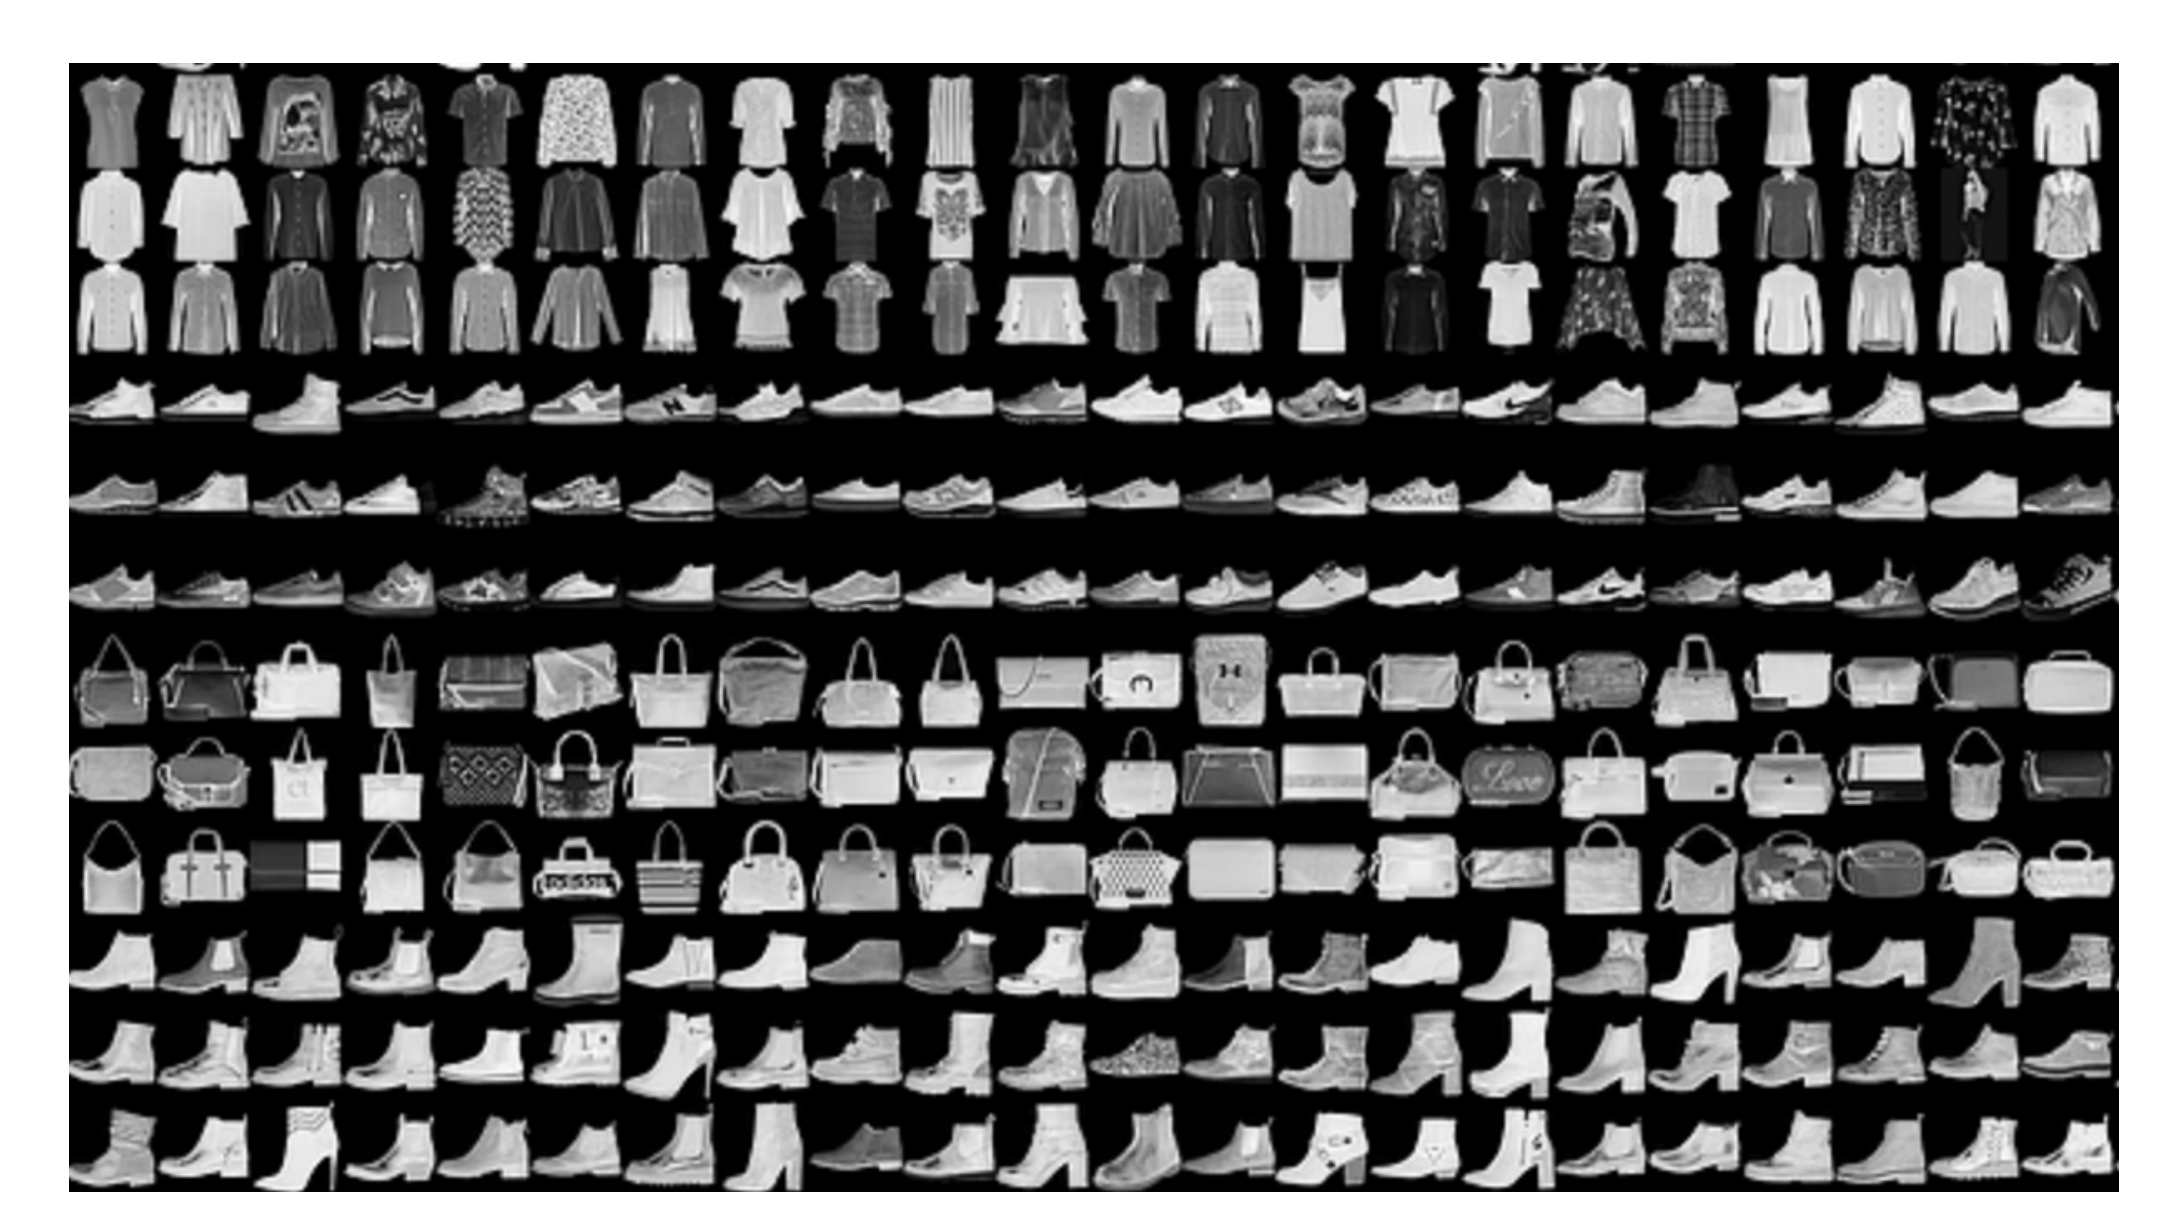
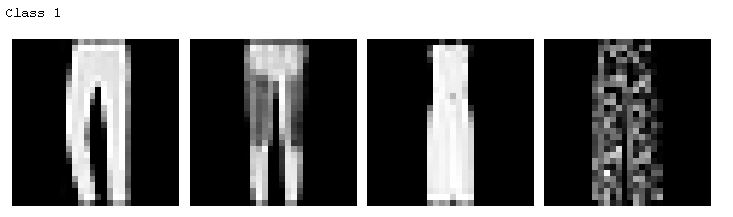
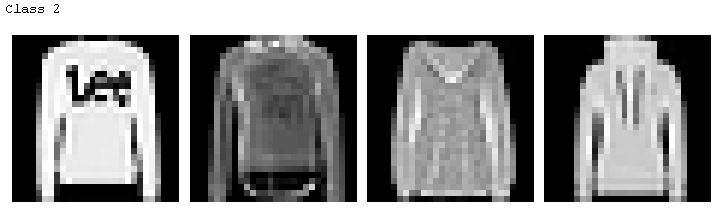
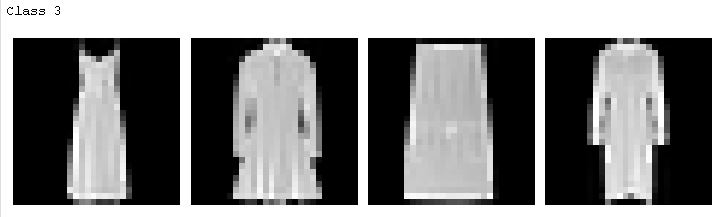
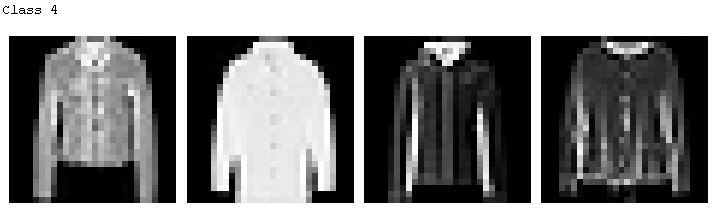
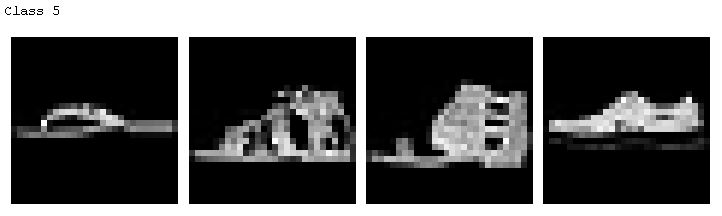
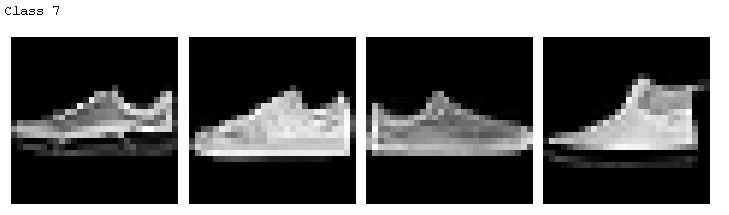
For the following ten sets of images. Each set represent a class. The left two images are the correct classification and the two on the right are the wrong classification where the images were classified as some other classes.
The next two images showed the learned filter for the first 2D convolutional layer of the best accuracy model and the best loss model. Since the accuracy did not improve much between the two models, the learned filters should be very similar. However, the best loss model has a loss that was much smaller than the best accuracy model. This shows that loss is a better metrics compared to the accuracy in training the model.
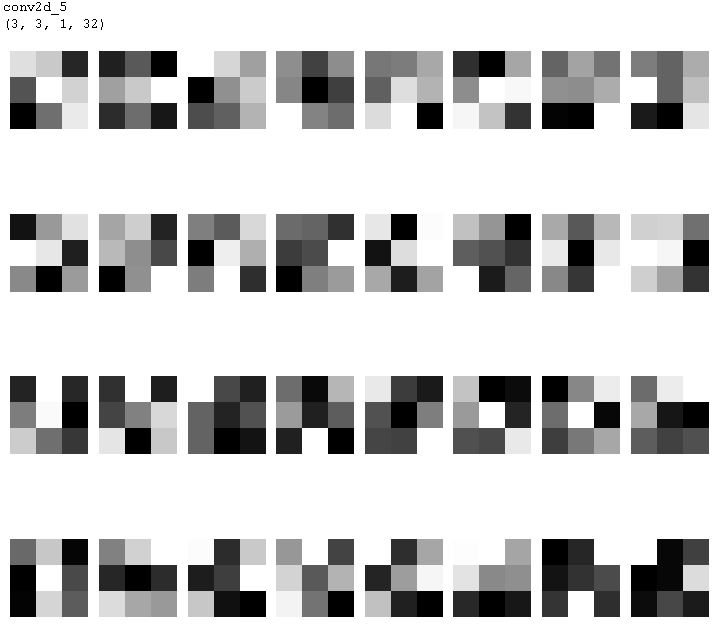
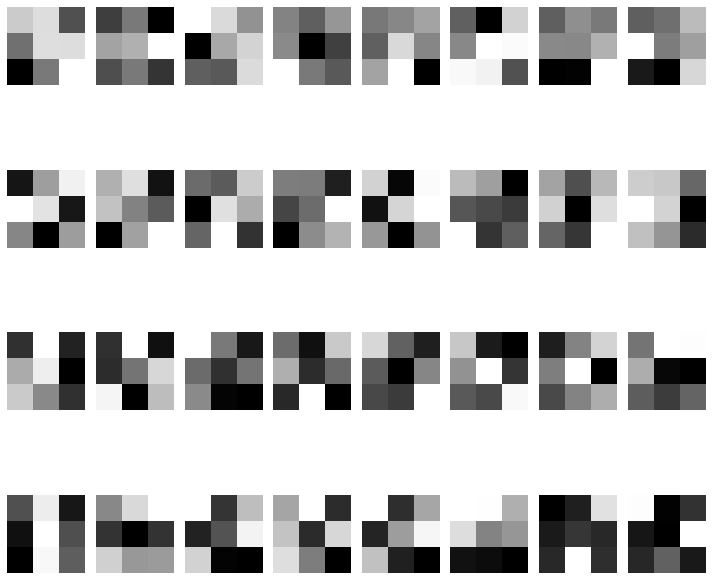
As expected, they are generally the same.
Part II: Semantic Segmentation
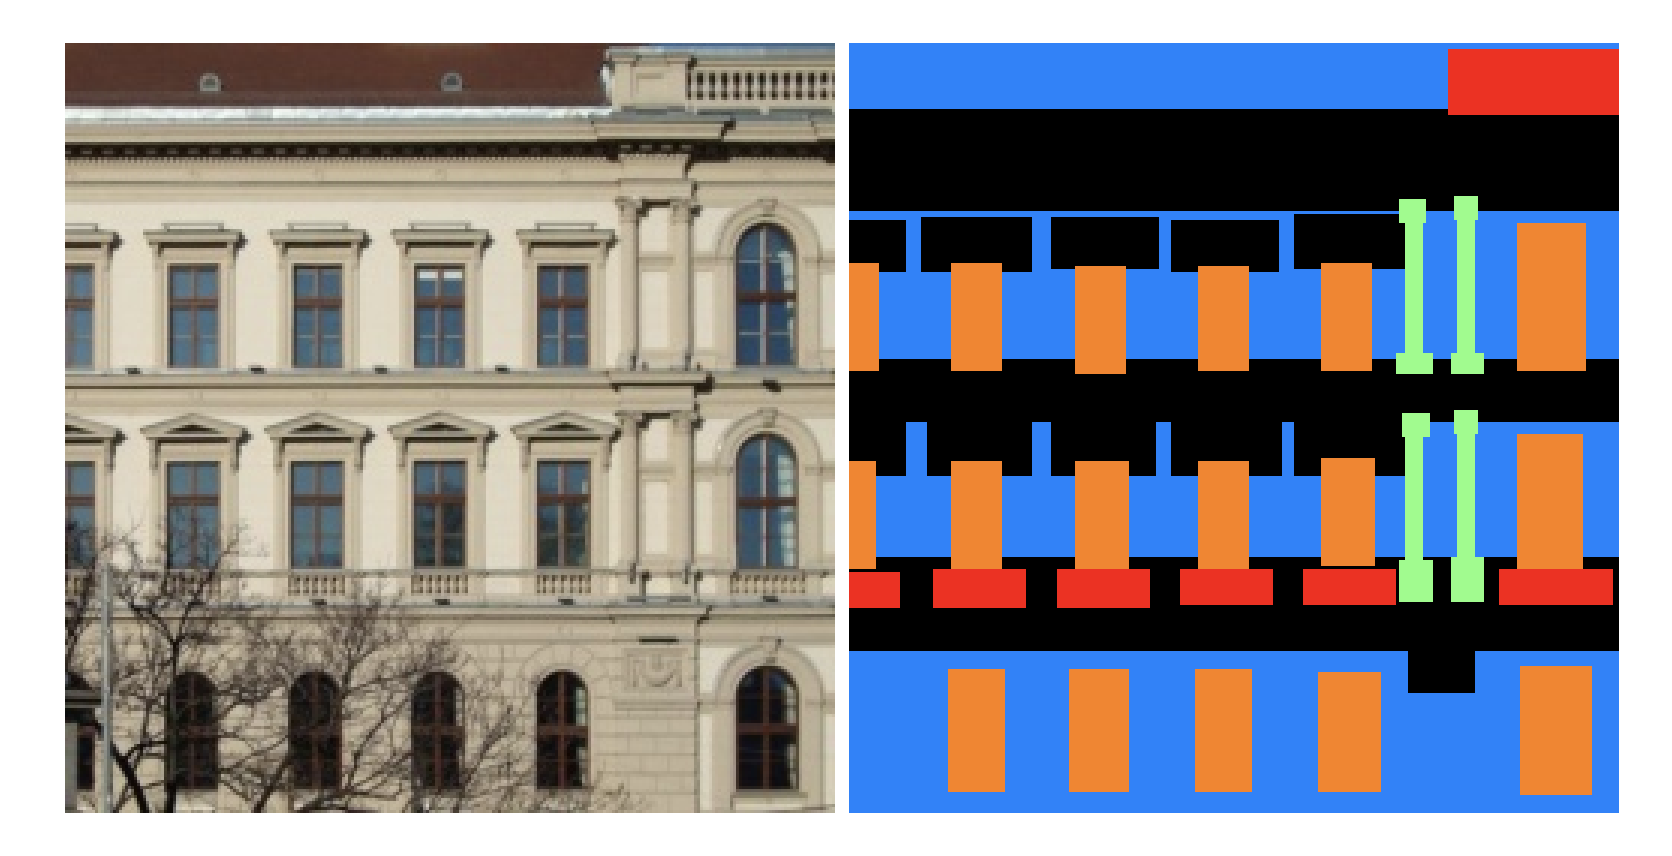
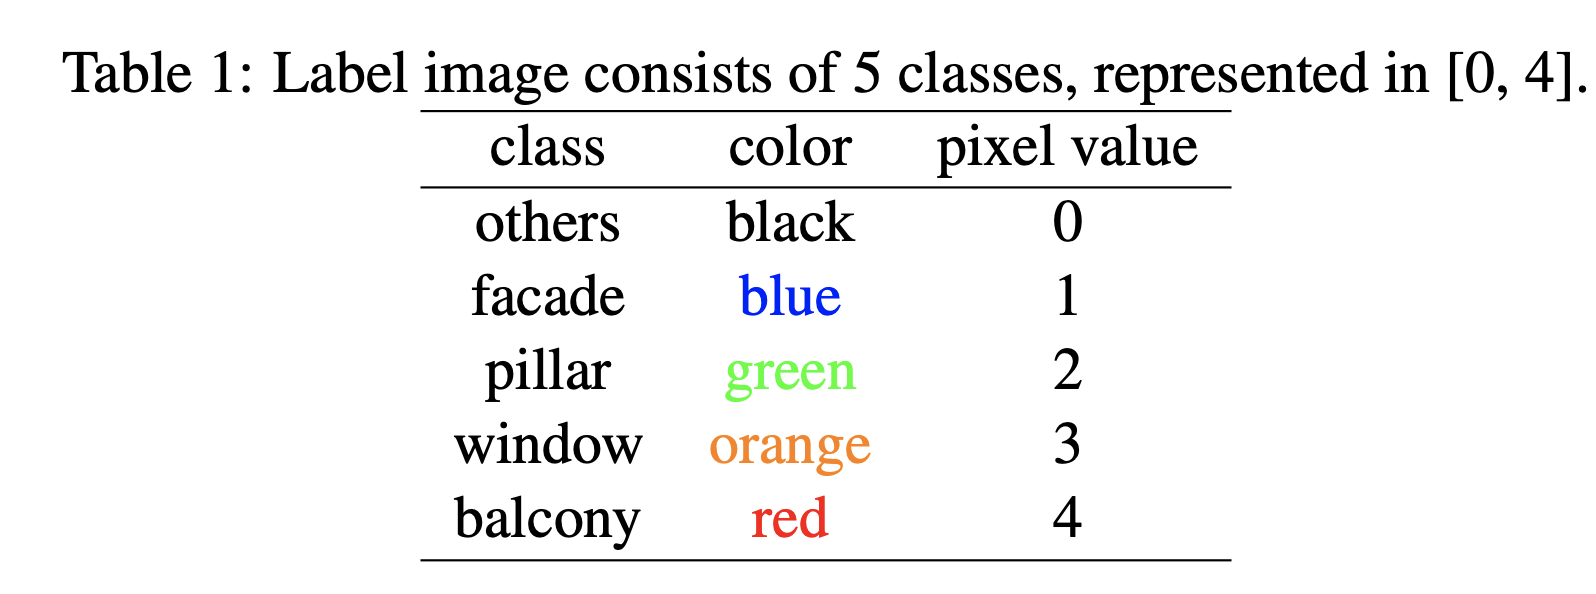
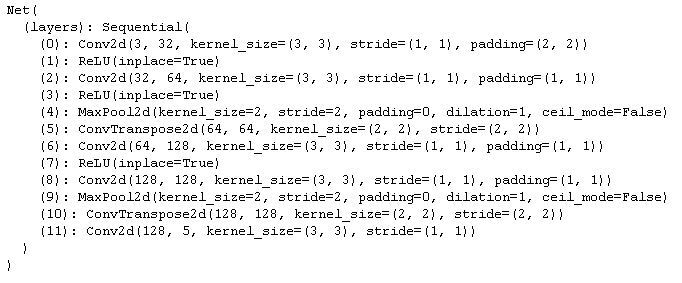
The dataset used is the Mini Facade dataset. PyTorch was used as the backend. The model is defined as the follows with crossentropy loss and Adam optimizer with 0.001 learning rate and 1e-5 weight decay:
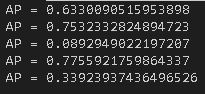
The average precision on the test set output from the training. The average AP is 0.518073757:
| Class | Average Precision |
|---|---|
| Others | 0.6330090515953898 |
| Facade | 0.7532332824894723 |
| Pillar | 0.0892949022197207 |
| Window | 0.7755921759864337 |
| Balcony | 0.33923937436496526 |
| Average | 0.518073757 |
The model was trained on the training data with 115 images reserved for validation. The model was trained for 100 epochs.
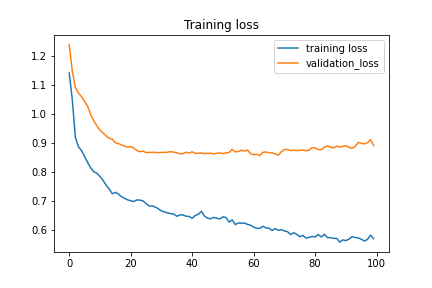
The following are some examples from the test output. The difference between the ground truth and the predicted was calculated using SSD to get the best and the worst predictions and some in betweens.
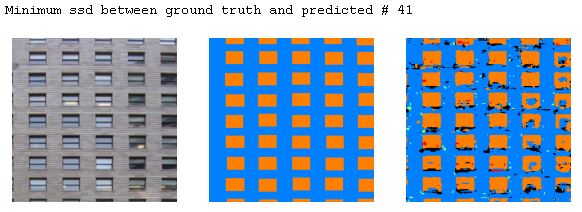
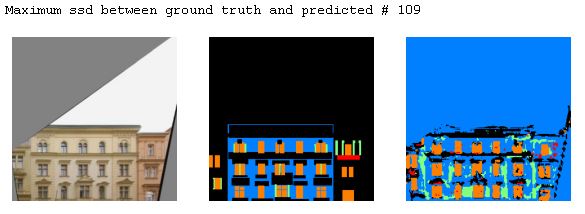
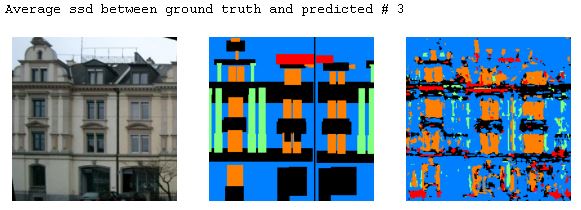
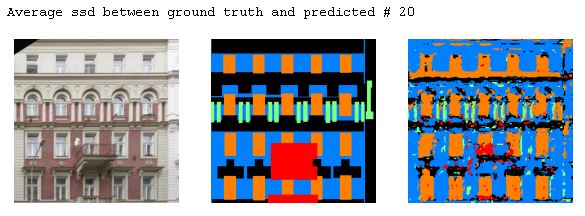
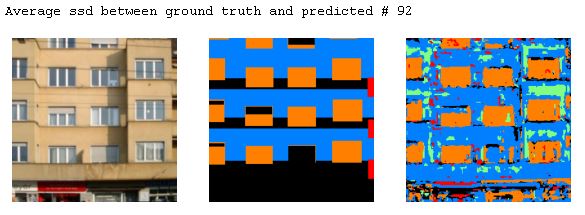
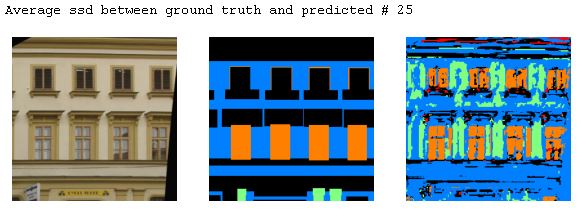
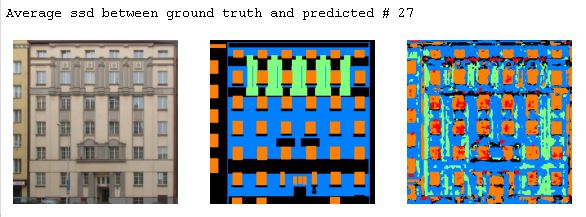
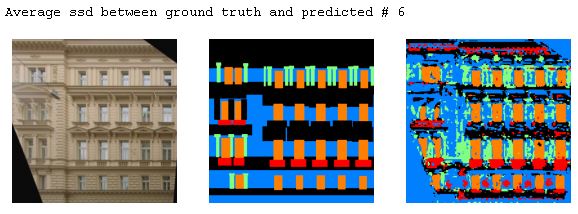
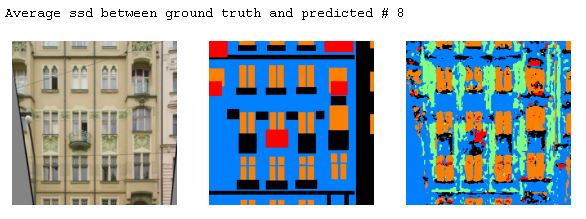
In terms of the model's ability to predict classes, window > facade > otehrs > balcony > pillar. Windows and the facade are the easier ones to get right and the pillar are the most difficult. Upon examine the results, others is also very hard to predict as it always gets predicted as the facade.