Sofie Yang
CS 194-26 - Project 4 Classification and Segmentation
Project Overview

This project explored using convolutional neural networks to perform classification on FashionMNIST and segmentation on building facades.
Part 1: FashionMNIST Classification Results
Training and validation accuracy across epochs
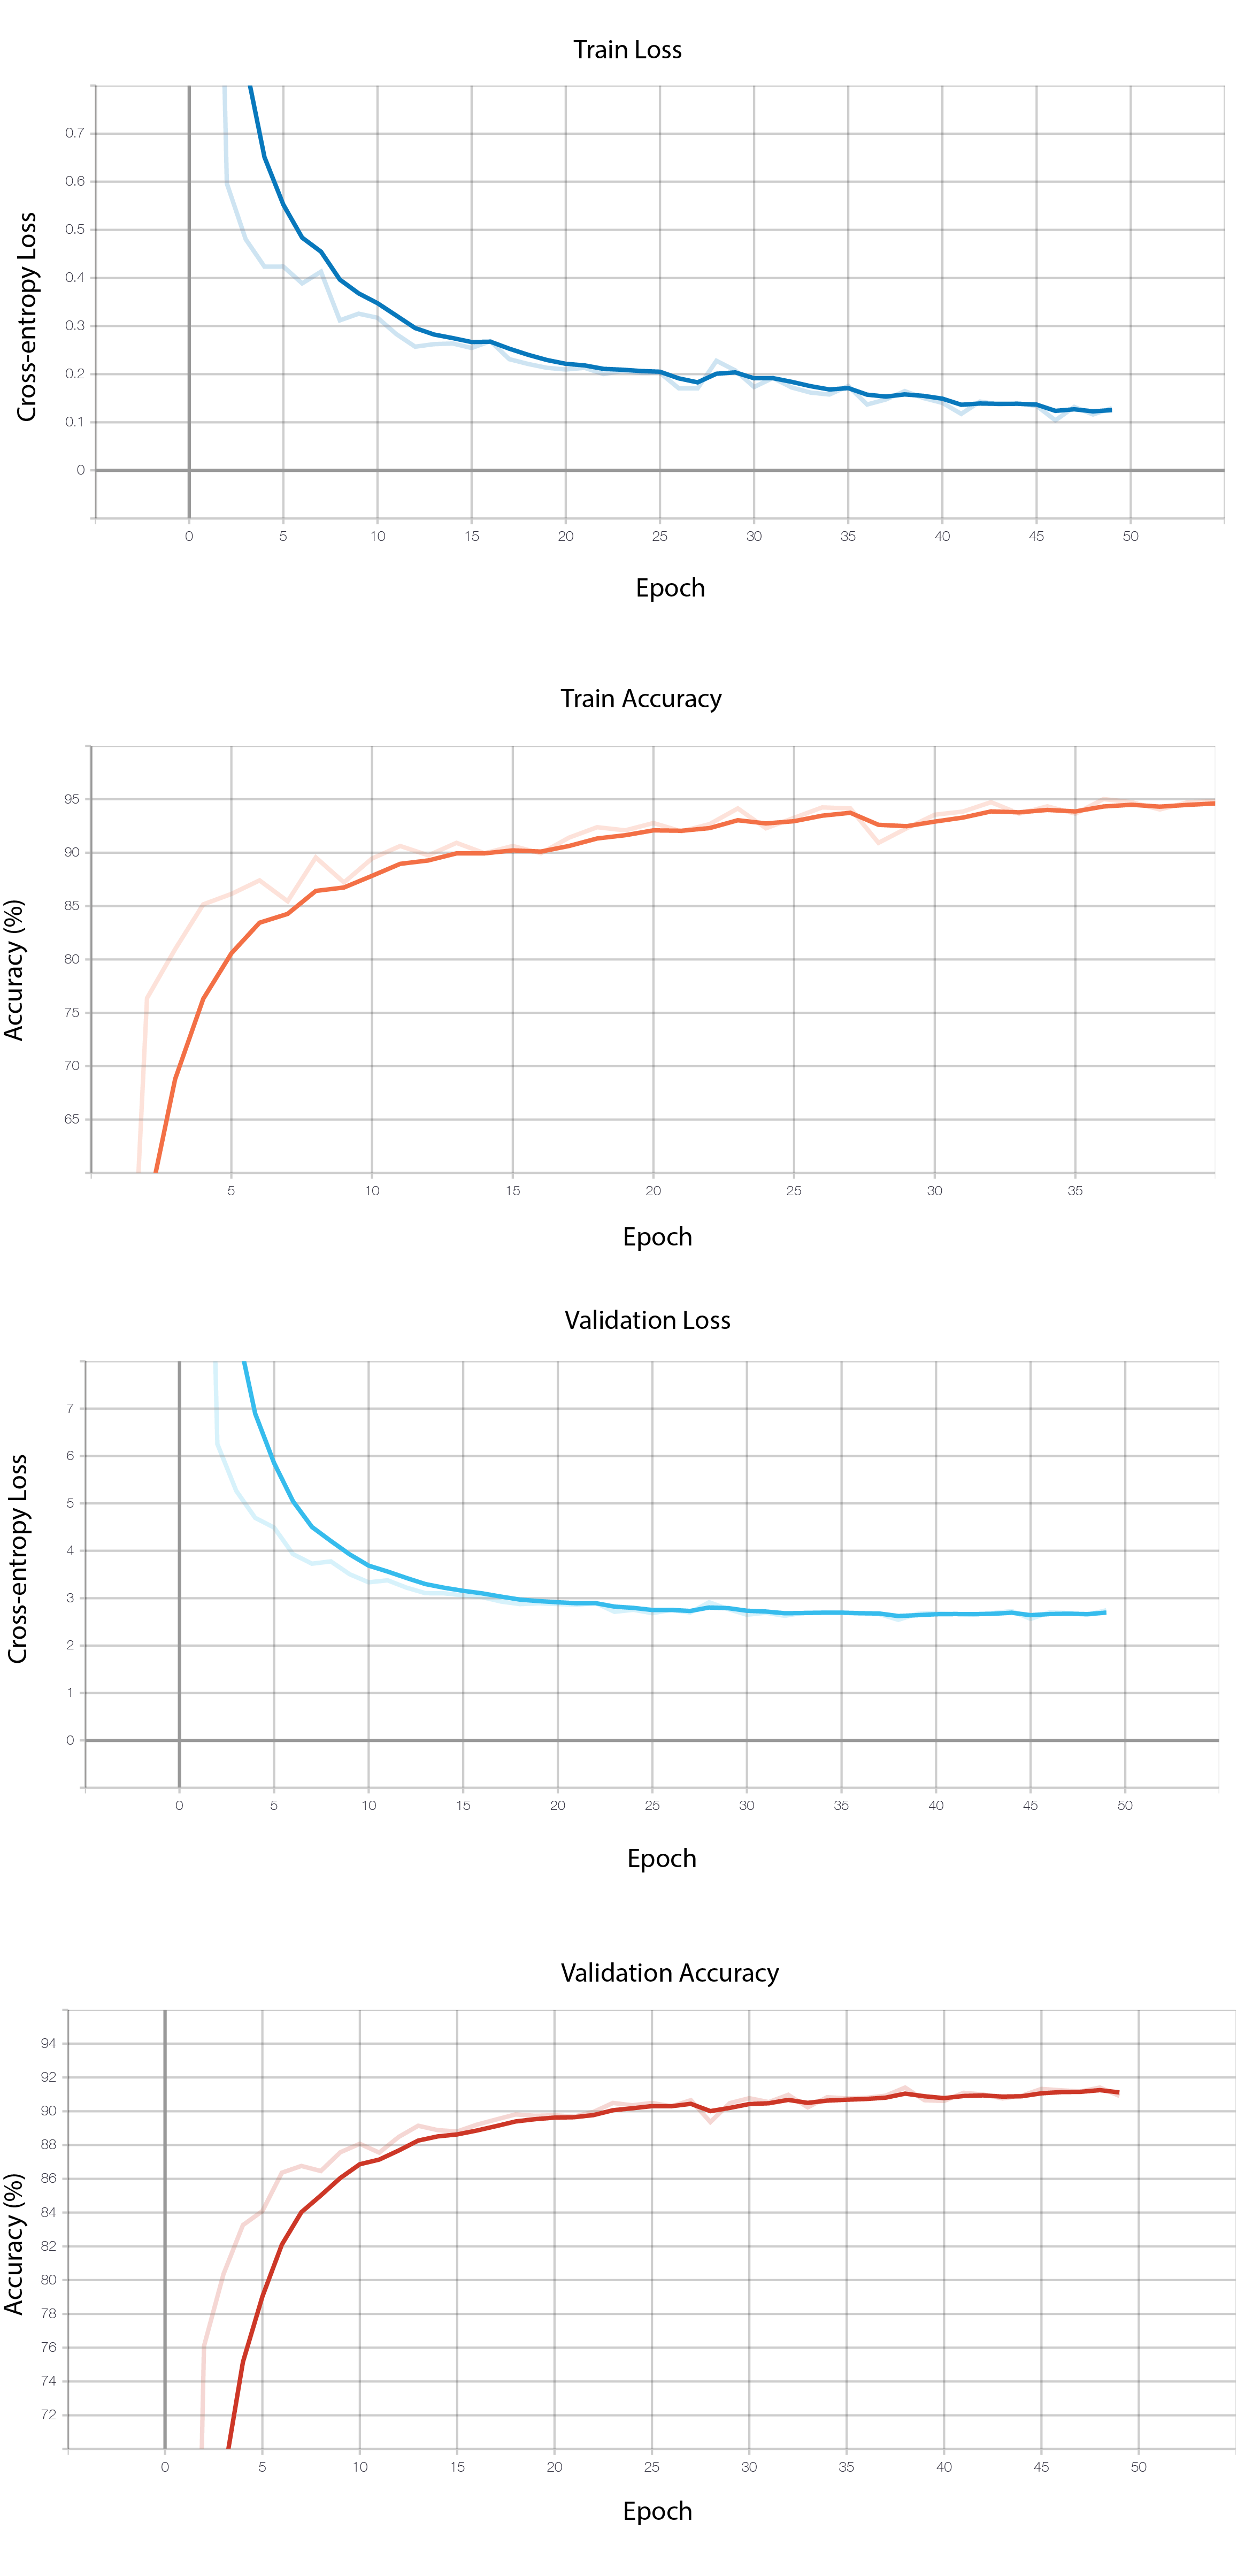
FashionMNIST reached 0.134 training loss and 0.277 validation loss, 94.8% training accuracy and 91.2% validation accuracy over 50 epochs using hyperparameters: 1024 batch size, 0.001 learning rate, Adam optimizer, and unweighted CrossEntropy Loss.
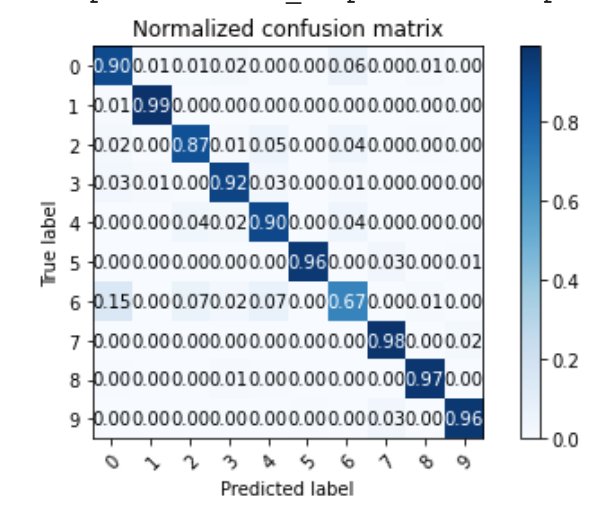
Per class accuracy on the validation dataset
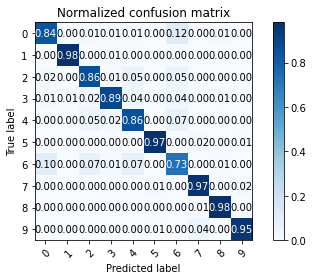
Per class accuracy on the test dataset
Which classes were hardest to classify?
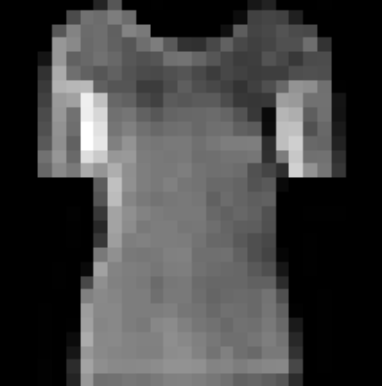
The model performs the worst on Class 6 (Shirt) with 73% accuracy which is most commonly confused with Class 0 (T-Shirt/Top) and 4 (Coat), which is understandable because they all have the same structure with sleeves. Since the resolution was so low, the model could not fit to differences in texture/fabric.
Which classes were easiest classify?
It performs the best on Class 1 (Trousers) and Class 5 (Sandal) and Class 8 (Bag) with 98% accuracy on all of them. This is likely because trousers have different angles for the legs compared to shirts that would be captured by my small kernel filters. Sandals have more detail on them than the other footwear categories, so they are also easy to classify.
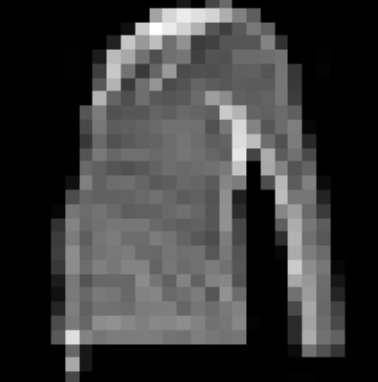
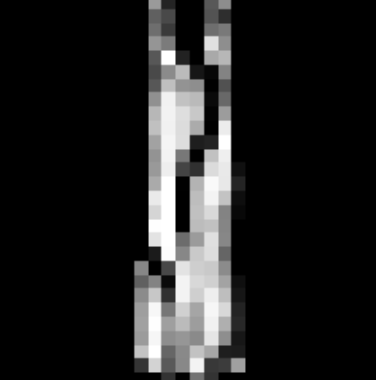
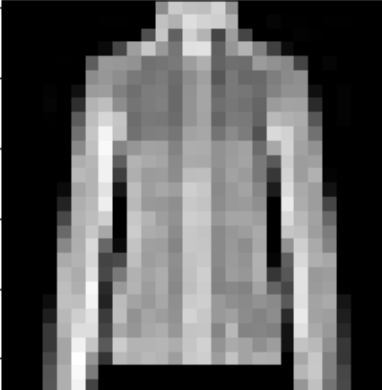
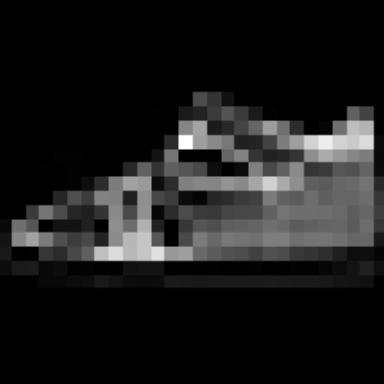
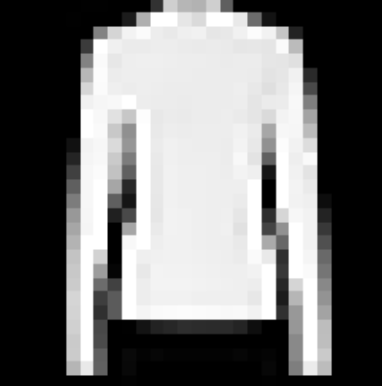
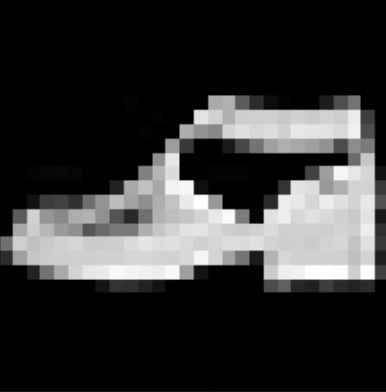
Correctly and Incorrectly Classified Testing Images
| True Class | Correct classification | Incorrect classification |
| 0: T-shirt/top |   |
 True: 6  True: 6 |
| 1: Trouser |  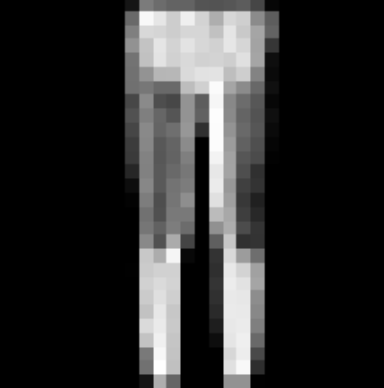 |
 True: 3 No other incorrect |
| 2: Pullover | 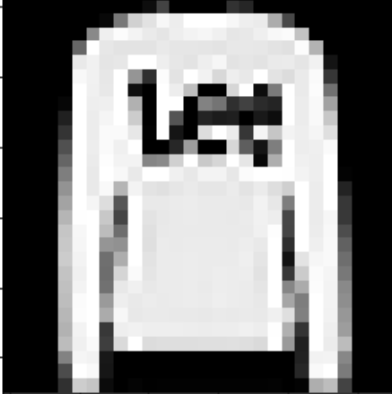 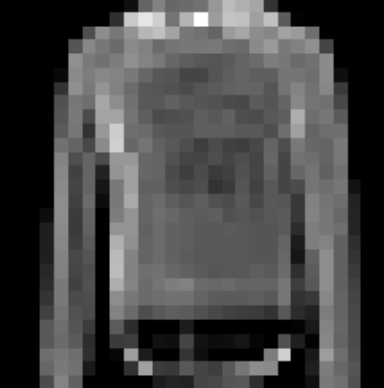 |
 True: 6 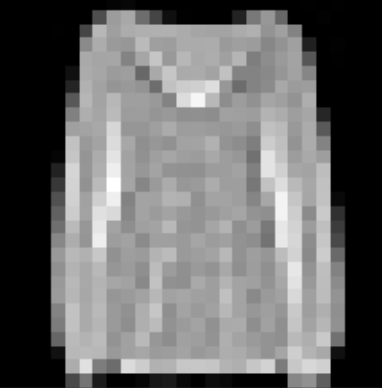 True: 6 |
| 3: Dress | 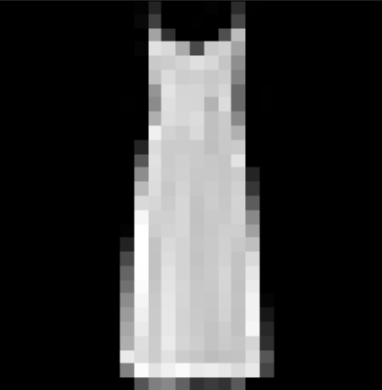 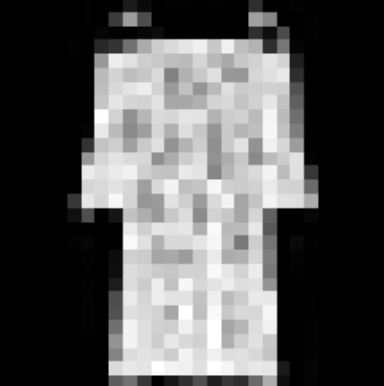 |
 True: 1  True: 4 |
| 4: Coat | 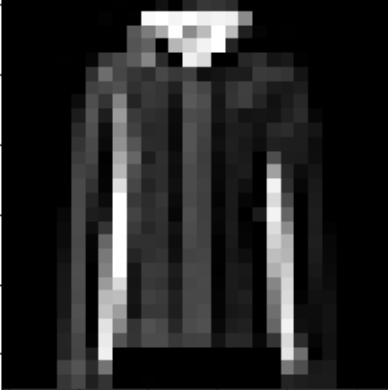 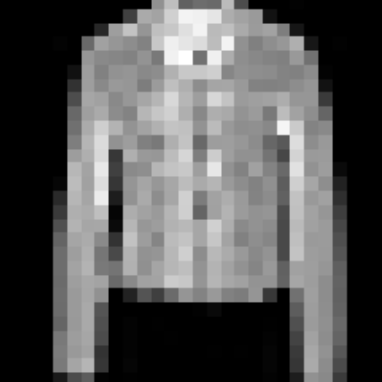 |
 True: 6 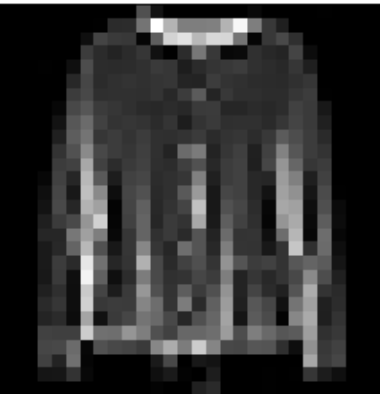 True: 6 |
| 5: Sandal |  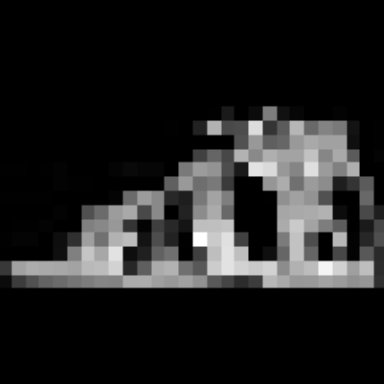 |
 True: 7 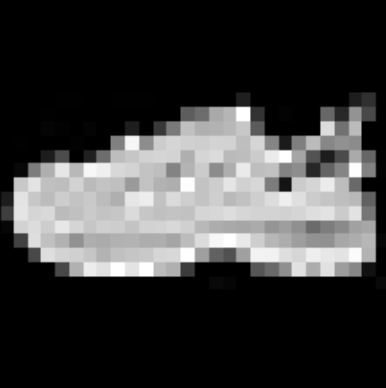 True: 7 |
| 6: Shirt | 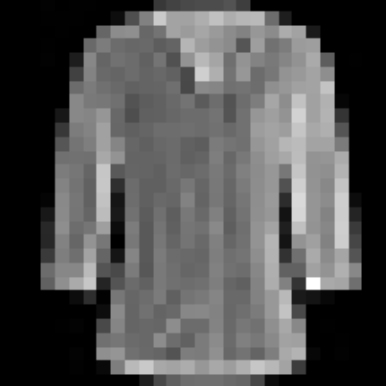 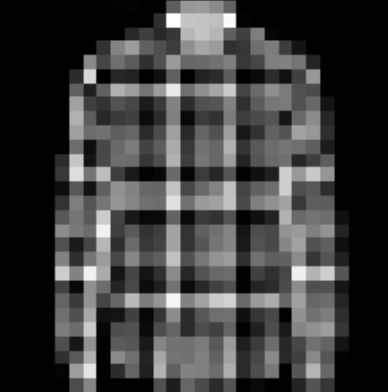 |
 True: 2  True: 3 |
| 7: Sneaker | 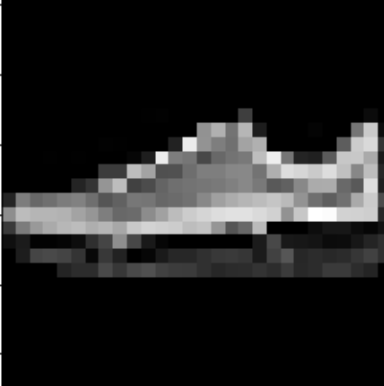 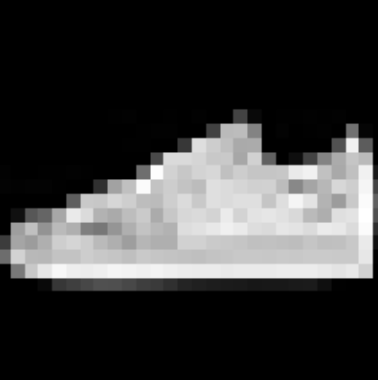 |
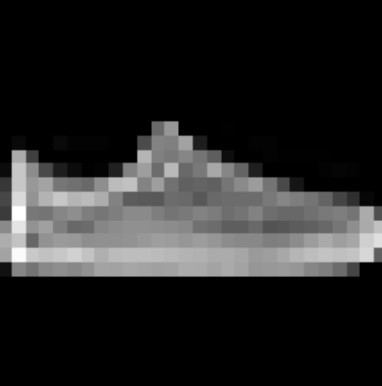 True: 8 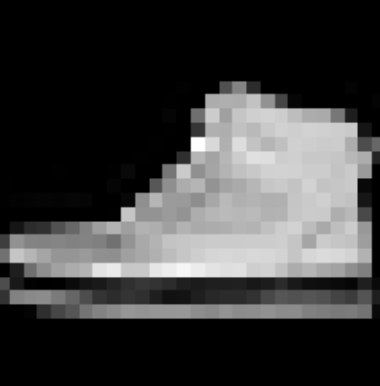 True: 9 |
| 8: Bag |   |
 True: 0  True: 6 |
| 9: Ankle boot | 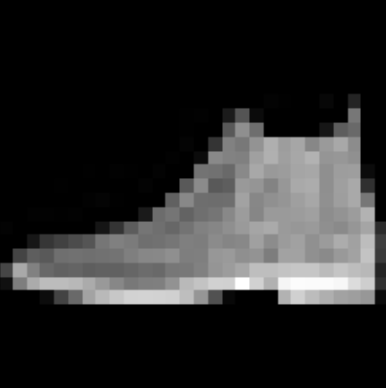 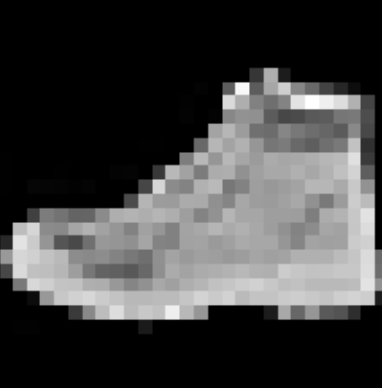 |
 True: 5 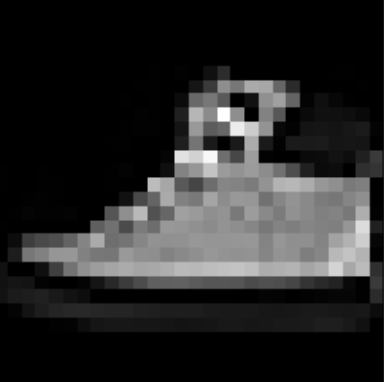 True: 7 |
It looks like Shirt and Coat have a lot of similarities in the images - "shirt" is too broad a category and has too much internal variation for my neural net.
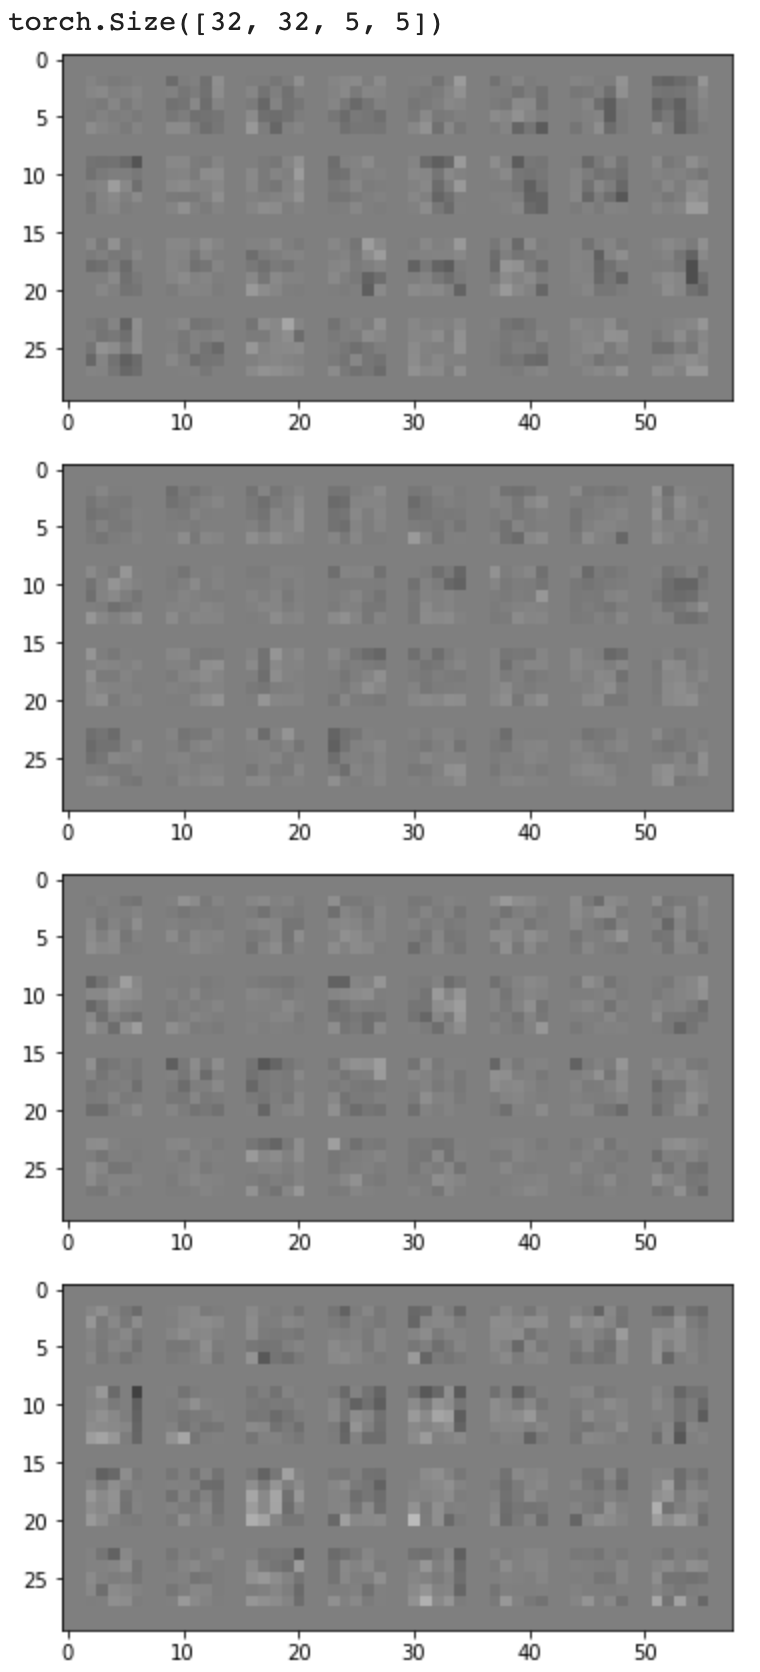
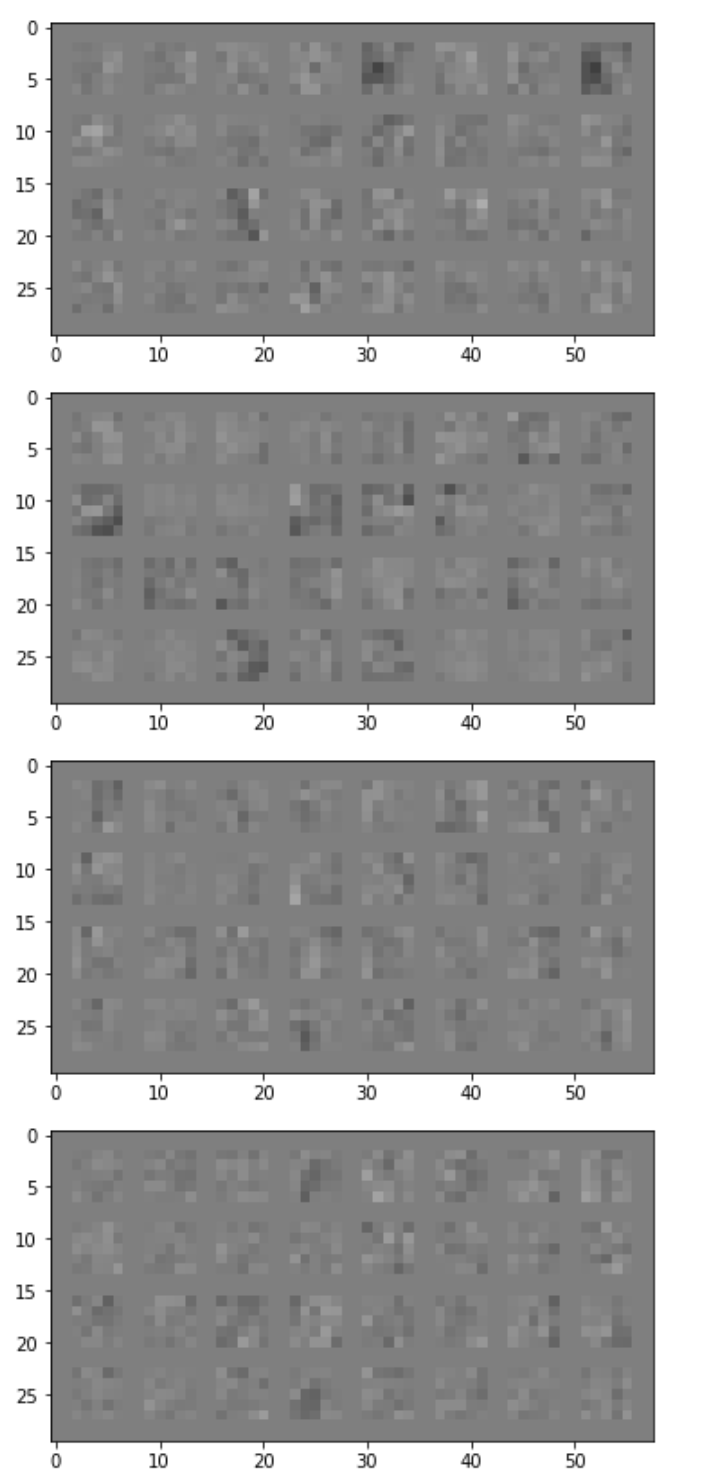
Visualization of learned filters
Conv Layer 1: 32 filters, kernel size 5
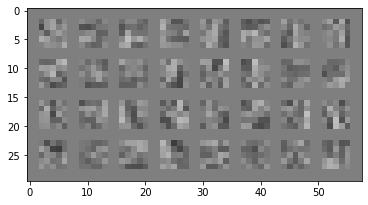
Many of the filters in the first convolutional layer look like they represent top, bottom, or side edges, especially filter 5 and 6. Even with only the first layer, my prototype neural net was able to get a 60% accuracy on some classes e.g. Bag.
Conv Layer 2: 32 filters, kernel size 5
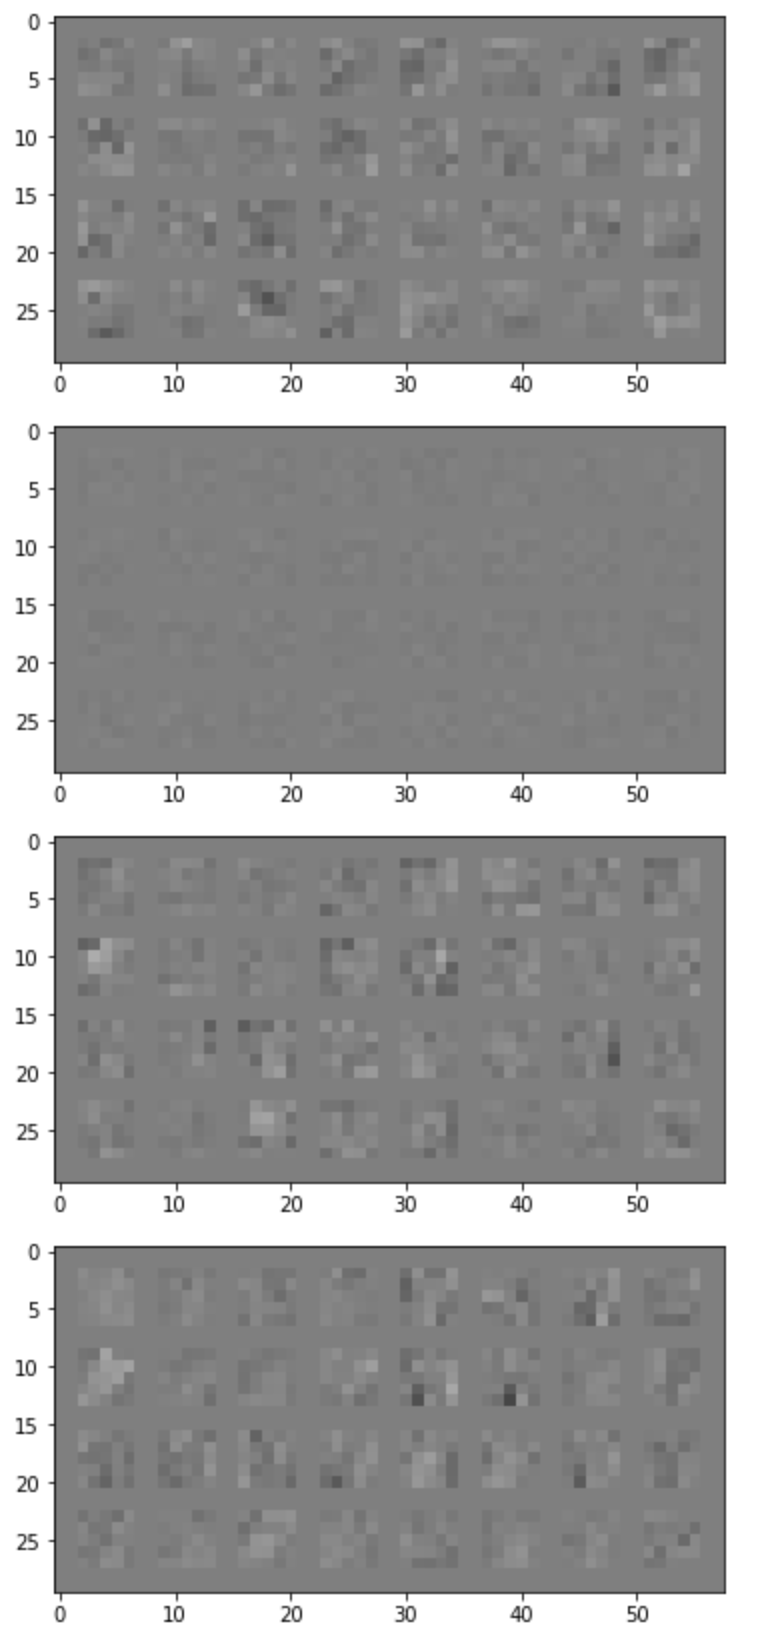
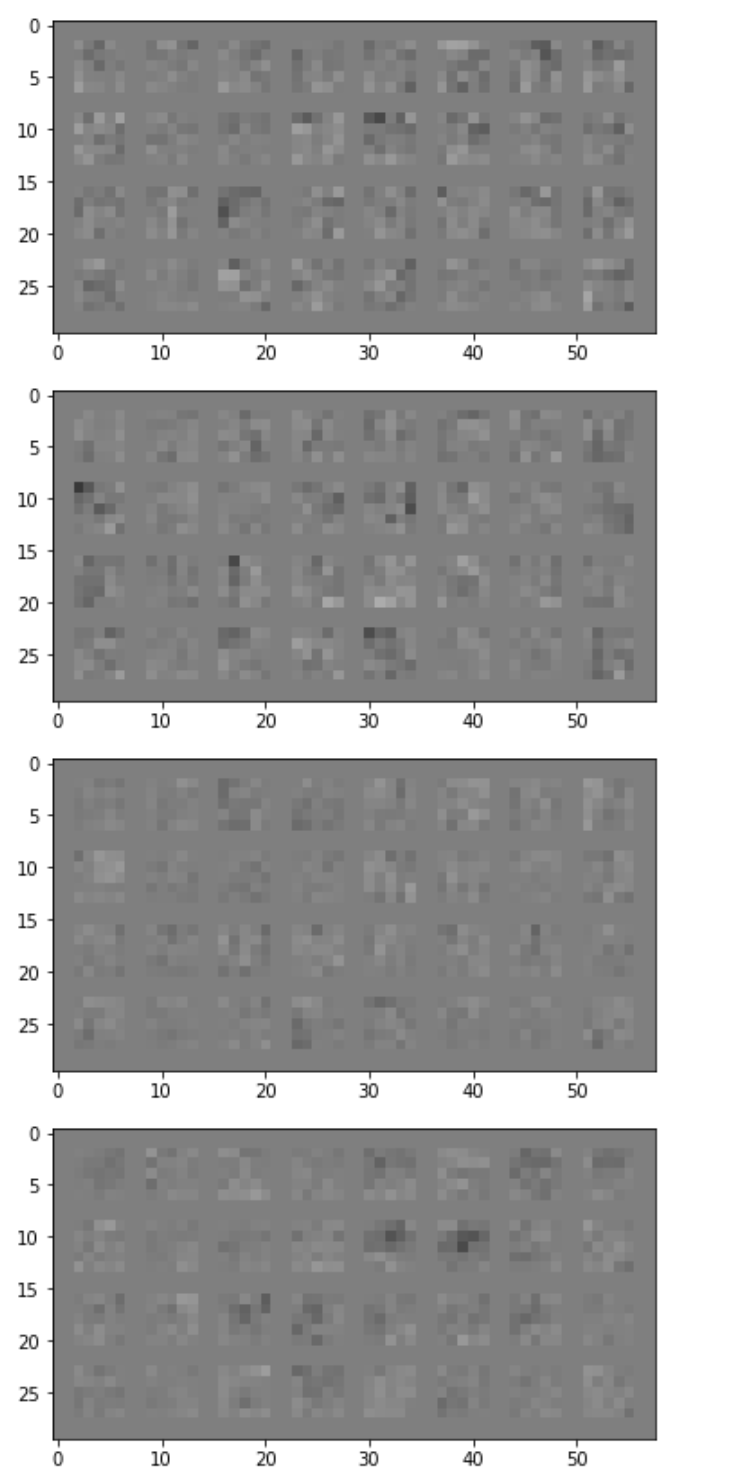
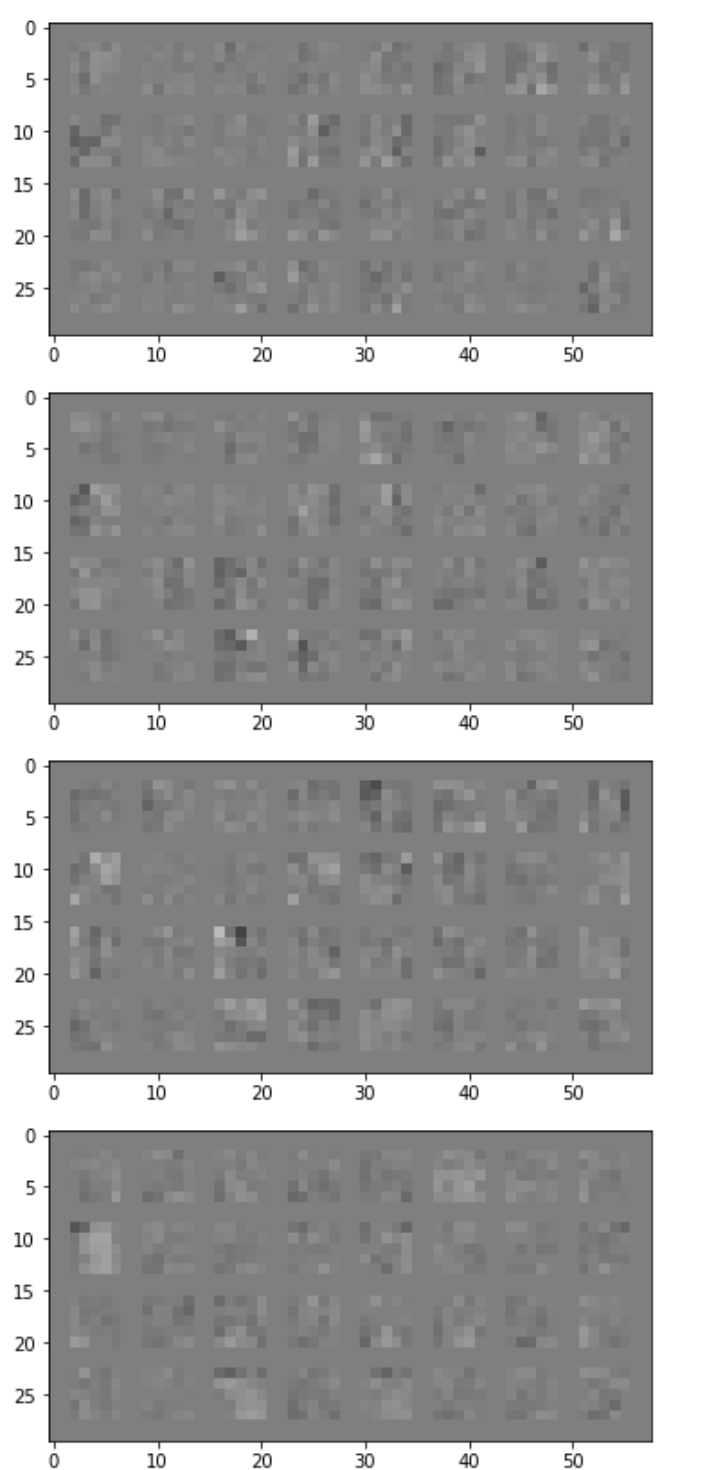
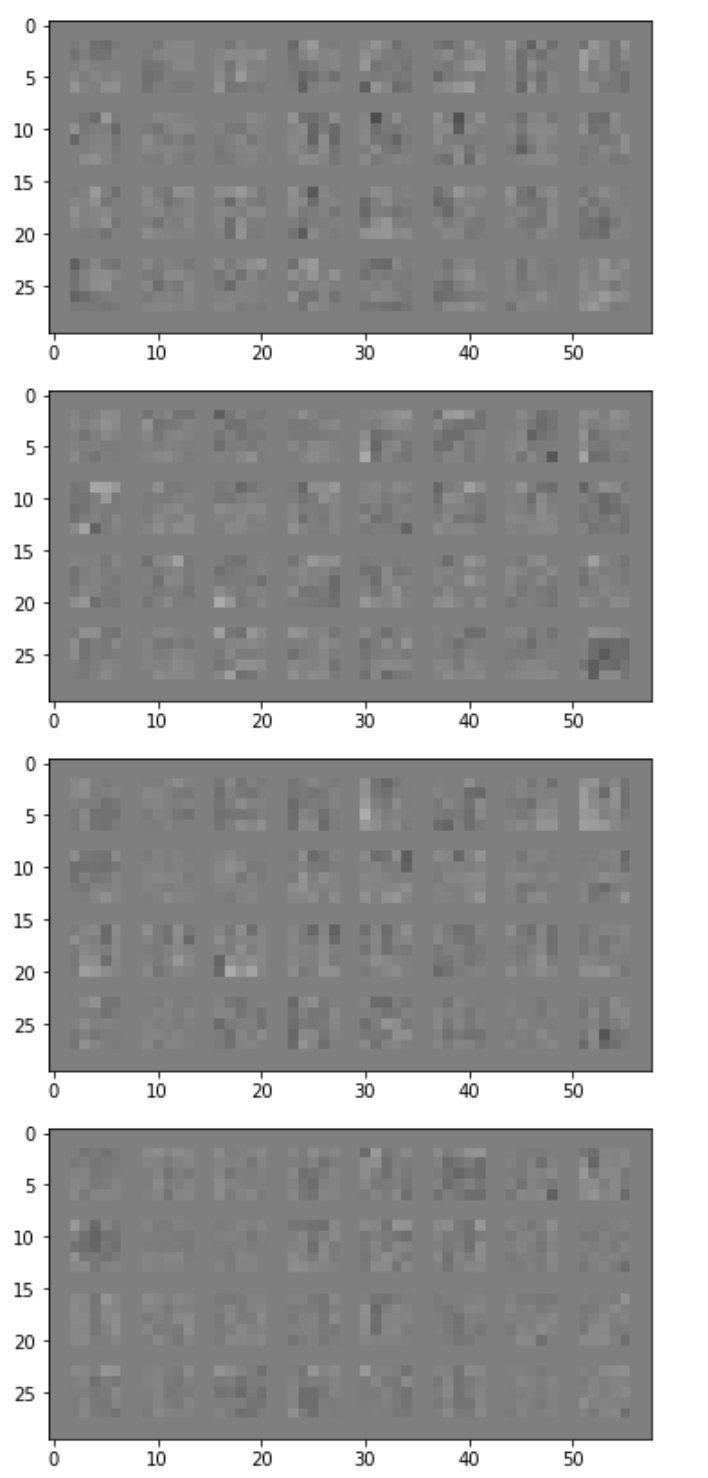
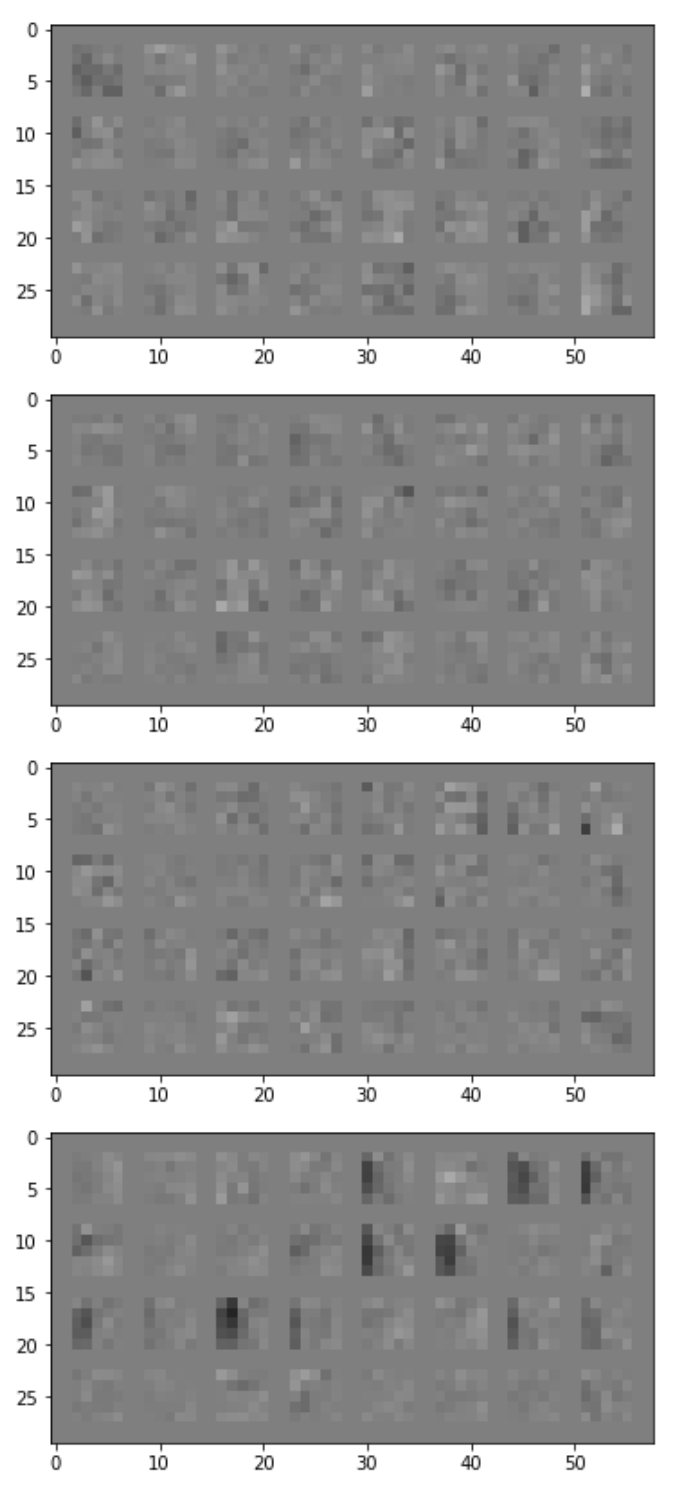
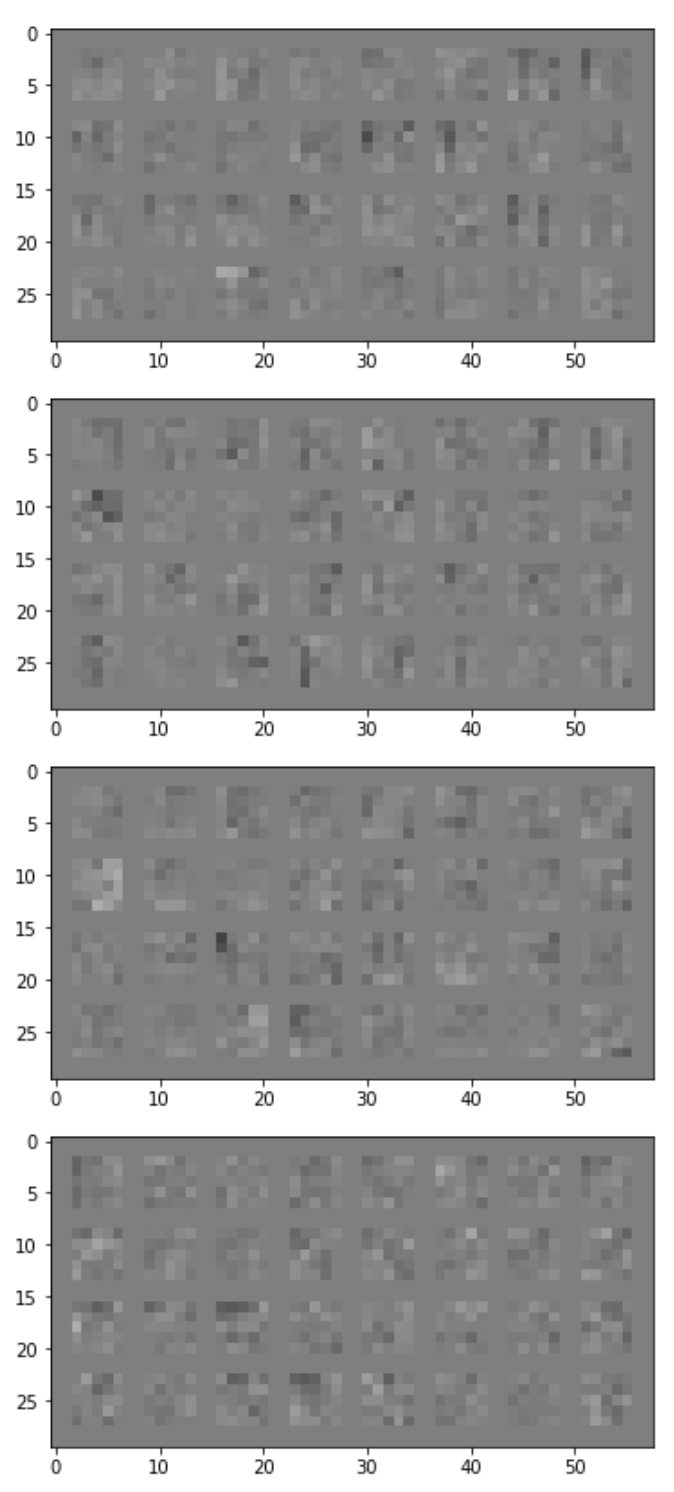
The different sets of 32 layers are different from each other in that some of them are sharp gradients while others are more uniform in color - picking up on edges or details on the surface of the fashion items.
Part 2: Semantic Segmentation"
Neural Net Architecture
Sources of architecture inspiration:
1
Long, Shellhammer, Darrell, 2018 FCN2
Suh AlexNet Pytorch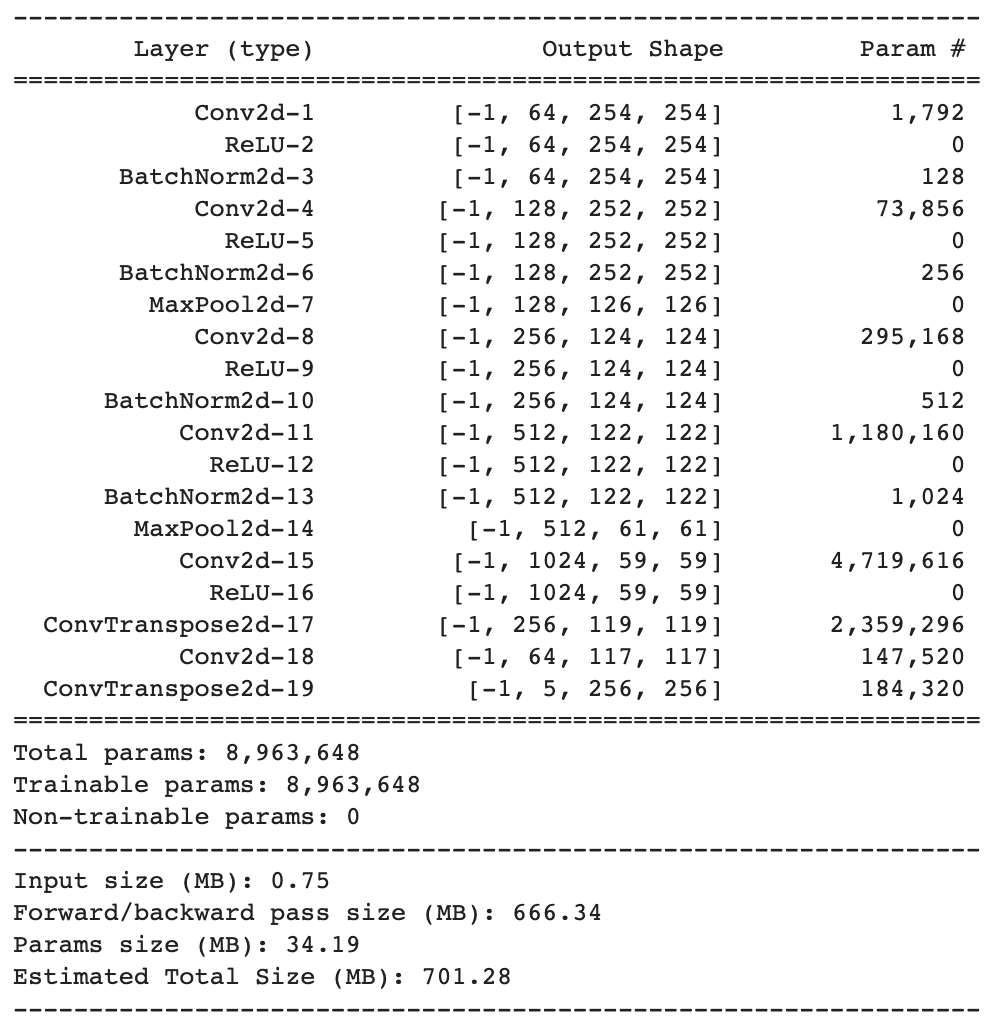
Design choices:
- 6 convolutional layers and 2 transpose convolutional layers
- Used deep convolutional layers in the middle of the network with up to 1024 filters to learn more detailed information
- Used batch normalization after ReLU to renormalize the values truncated by the non-linearty - improved performance substantially
- Found that small kernels worked better than larger ones, so I kept the size at 3 for all convolutional layers
- Dropout layers or more maxpool layers did not help decrease loss or increase AP
Hyperparameters:
- Criterion: Cross Entropy Loss with equal weights on each class (overweighting pillars did not boost its accuracy)
- Optimizer: Adam with learning rate 1e-3 and weight decay 1e-5)
- Validation size: 10%, Training size: 90% (Chose larger training set because there were very few samples given the number of NN parameters)
- Batch size: 10 for training, 0 for validation and test
- Epochs: 15
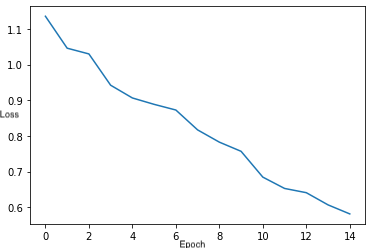
Training loss curve across 15 epochs
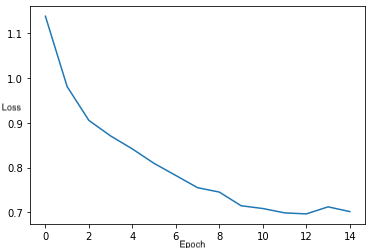
Validation loss curve across 15 epochs
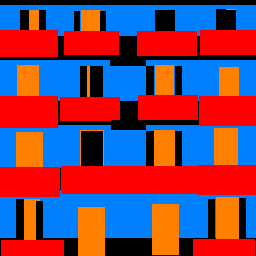
Test Set Average Precision
| Class | Average Precision |
| 0: Other | Black | 0.615 |
| 1: Facade | Blue | 0.700 |
| 2: Pillar | Green | 0.202 |
| 3: Window | Orange | 0.835 |
| 4: Balcony | Red | 0.562 |
| Mean AP across all classes | 0.583 |
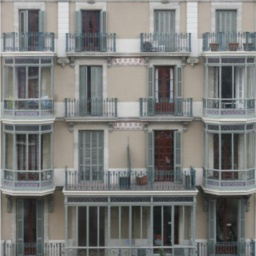
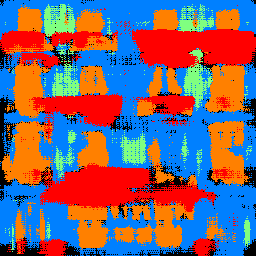
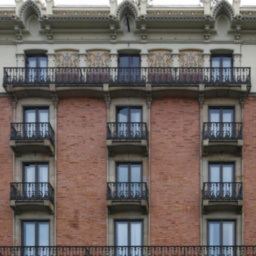
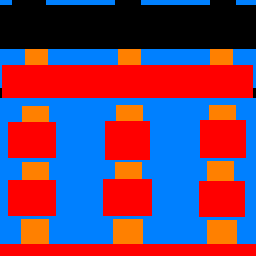
Example Image Result
I chose a picture of Doe Library because it has very thin windows and columns which will be difficult for the neural network to segment and it also has a bit of sentimental value since I'm a graduating senior. The neural network was still able to identify the middles of the pillars (but fails on the extremities of the pillars) and performed very well on the windows.
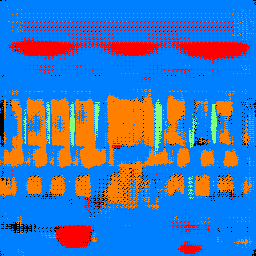
Test set success and failure case
My FacadeNet works very well for regular, rectangular windows and balconies.

It tends to fail when it detects pillars where there are none.