In this project, I first use block matching method to calculate the disparity map of stereo image pairs from KITTI (Karlsruhe Institute of Technology and Toyota Technological Institute) dataset. Then, Muti-Image Matching methods described in [1] such as Harris point detector, Adaptive Non-Maximal Suppression (ANMS) are used to find and match features between frames. Finally, the motion between frames or odometry results are obtained by minimizing image re-projection error using standard Levenberg-Marquardt least-square algorithm [2] in Matlab.
In the past few decades, the area of autonomous driving has attracted substantial attention in both academia and industry. The localization of the vehicle and the identification of surrounding object is crucial in making complicate decisions in real-time. Various methods such as combination of high-resolution cameras, Lidar and object detection CNN have been developed to tackle the problem. Currently, due to the limitations of hardware, the spatial resolution of Lidar is much lower than color cameras. Fusion of Lidar and camera images have been implemented for depth estimation with better performance on the poorly textured or occluded areas. In the first part of the report, I derive the disparity map from only stereo-camera image pairs with known calibration parameters and show the results that will be used in the following Visual Odometry task.
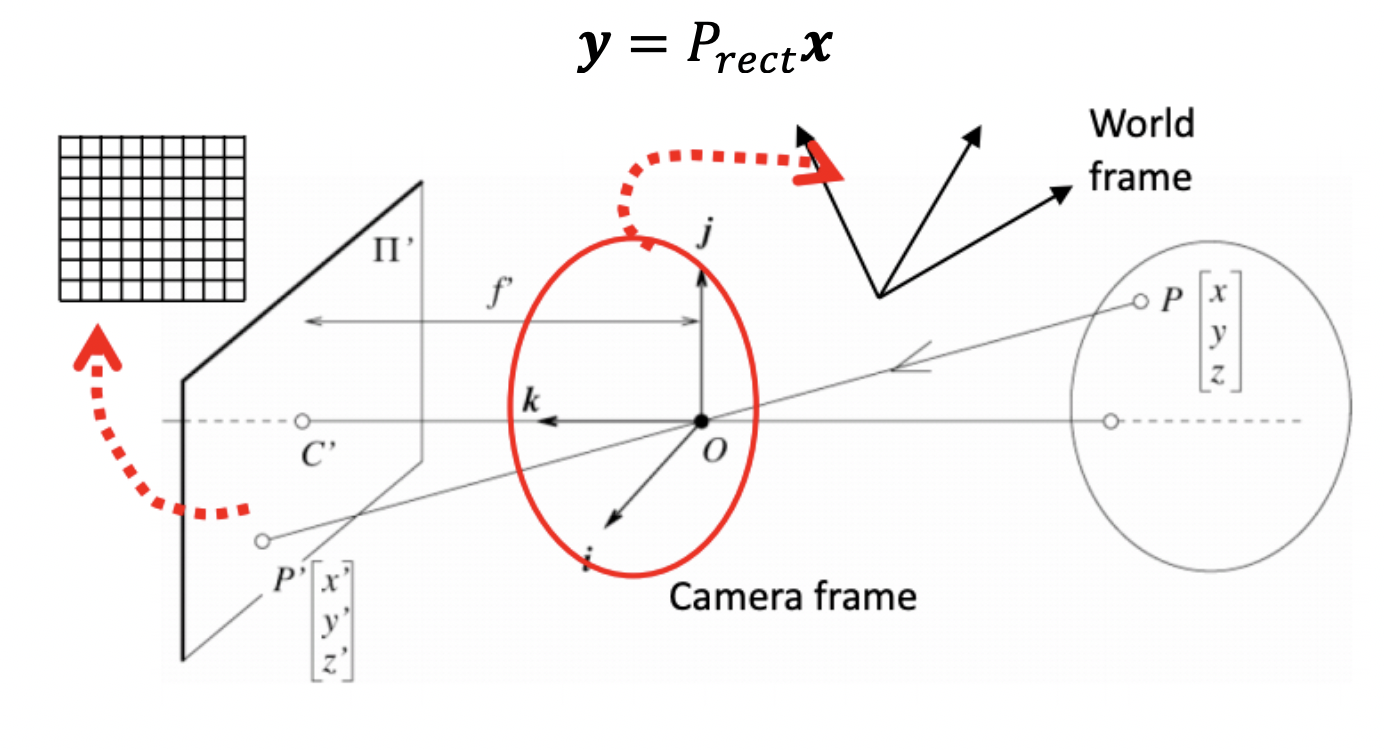
In the multi-view geometry problem, coordinates of 3D objects are captured by multiple cameras at different positions. Before applying the images for advanced task, calibrations are needed to correct the aberrations in the imaging system. Extrinsic calibration is used to align world frame and camera frame. Intrinsic calibration parameters include focal length, image center points. After calibration, the one-to-one correspondence between a 3D point x=(x,y,z,1) in rectified camera coordinates and a point y=(u,v,1) is described by a projection matrix:
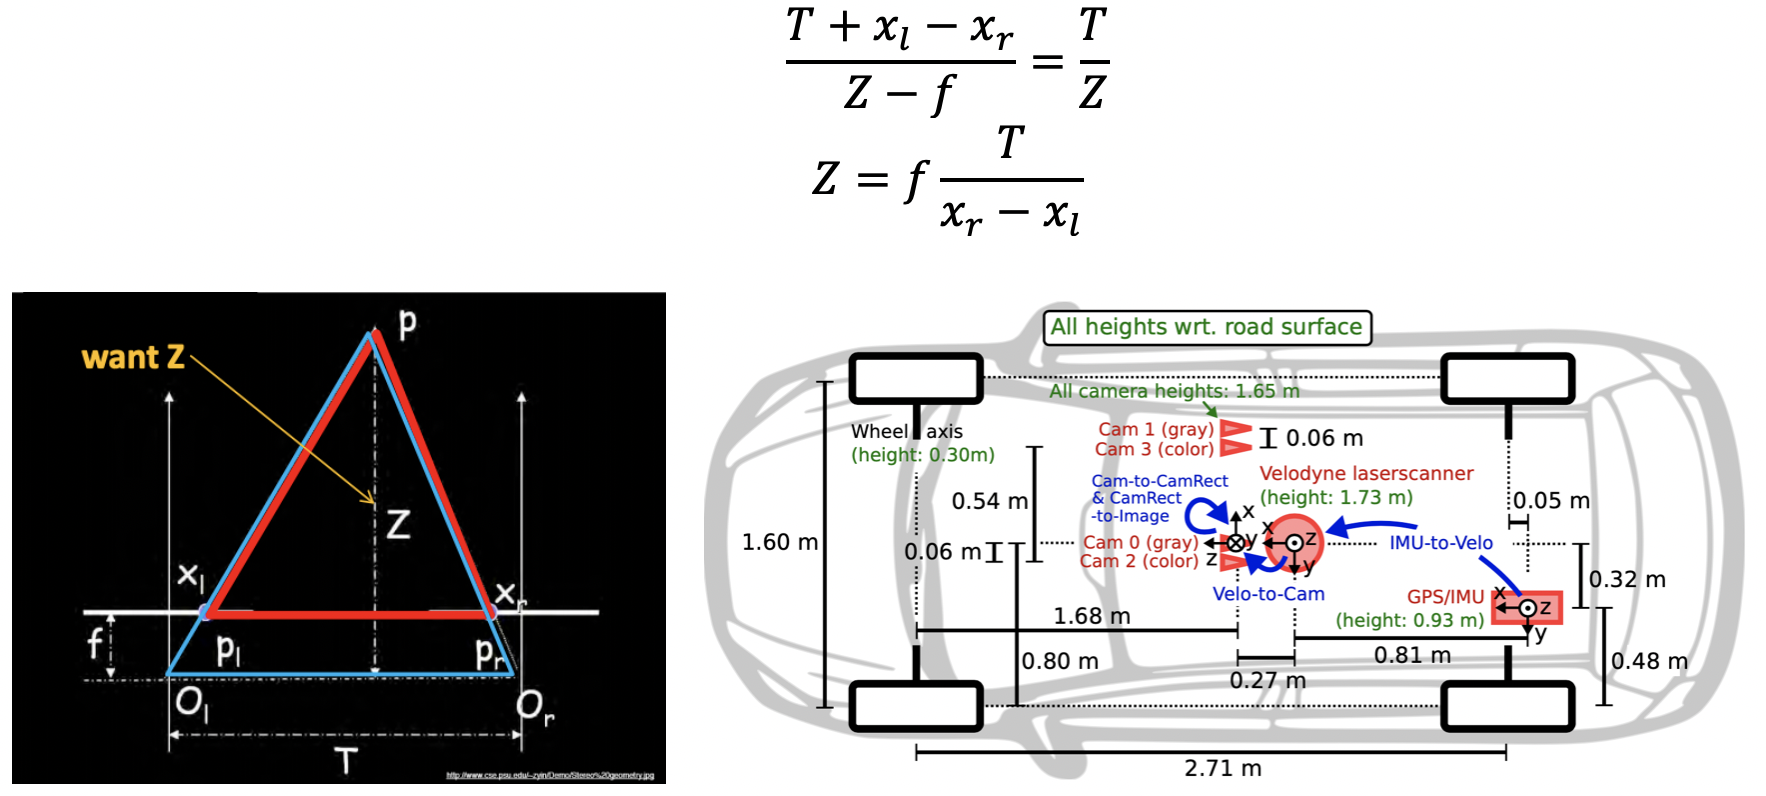
The setup of KITTI data collection is shown below. Stereo camera pairs (Cam2&Cam3 or Cam0&Cam1) are aligned horizontally and facing to the same forward direction. In this case, the disparity can be calculated straightforwardly using the schematic shown in left panel. For an object p in the 3D world, its projections in the stereo camera would be at different positions indicated by x_l and x_r. If we know the parameters of the stereo system, the ‘depth’ of the object can be obtained:
In order to calculate the disparity between stereo image pairs, corresponding points between them should be allocated first. As discussed above, for rectified and calibrated stereo image pairs, their epipolar lines are parallel horizontally which means corresponding features have the same vertical image coordinates. In light of this observation, I use pixel-wise block matching method which minimizes matching errors between the blocks at all possible position on the same epipolar lines as shown below.
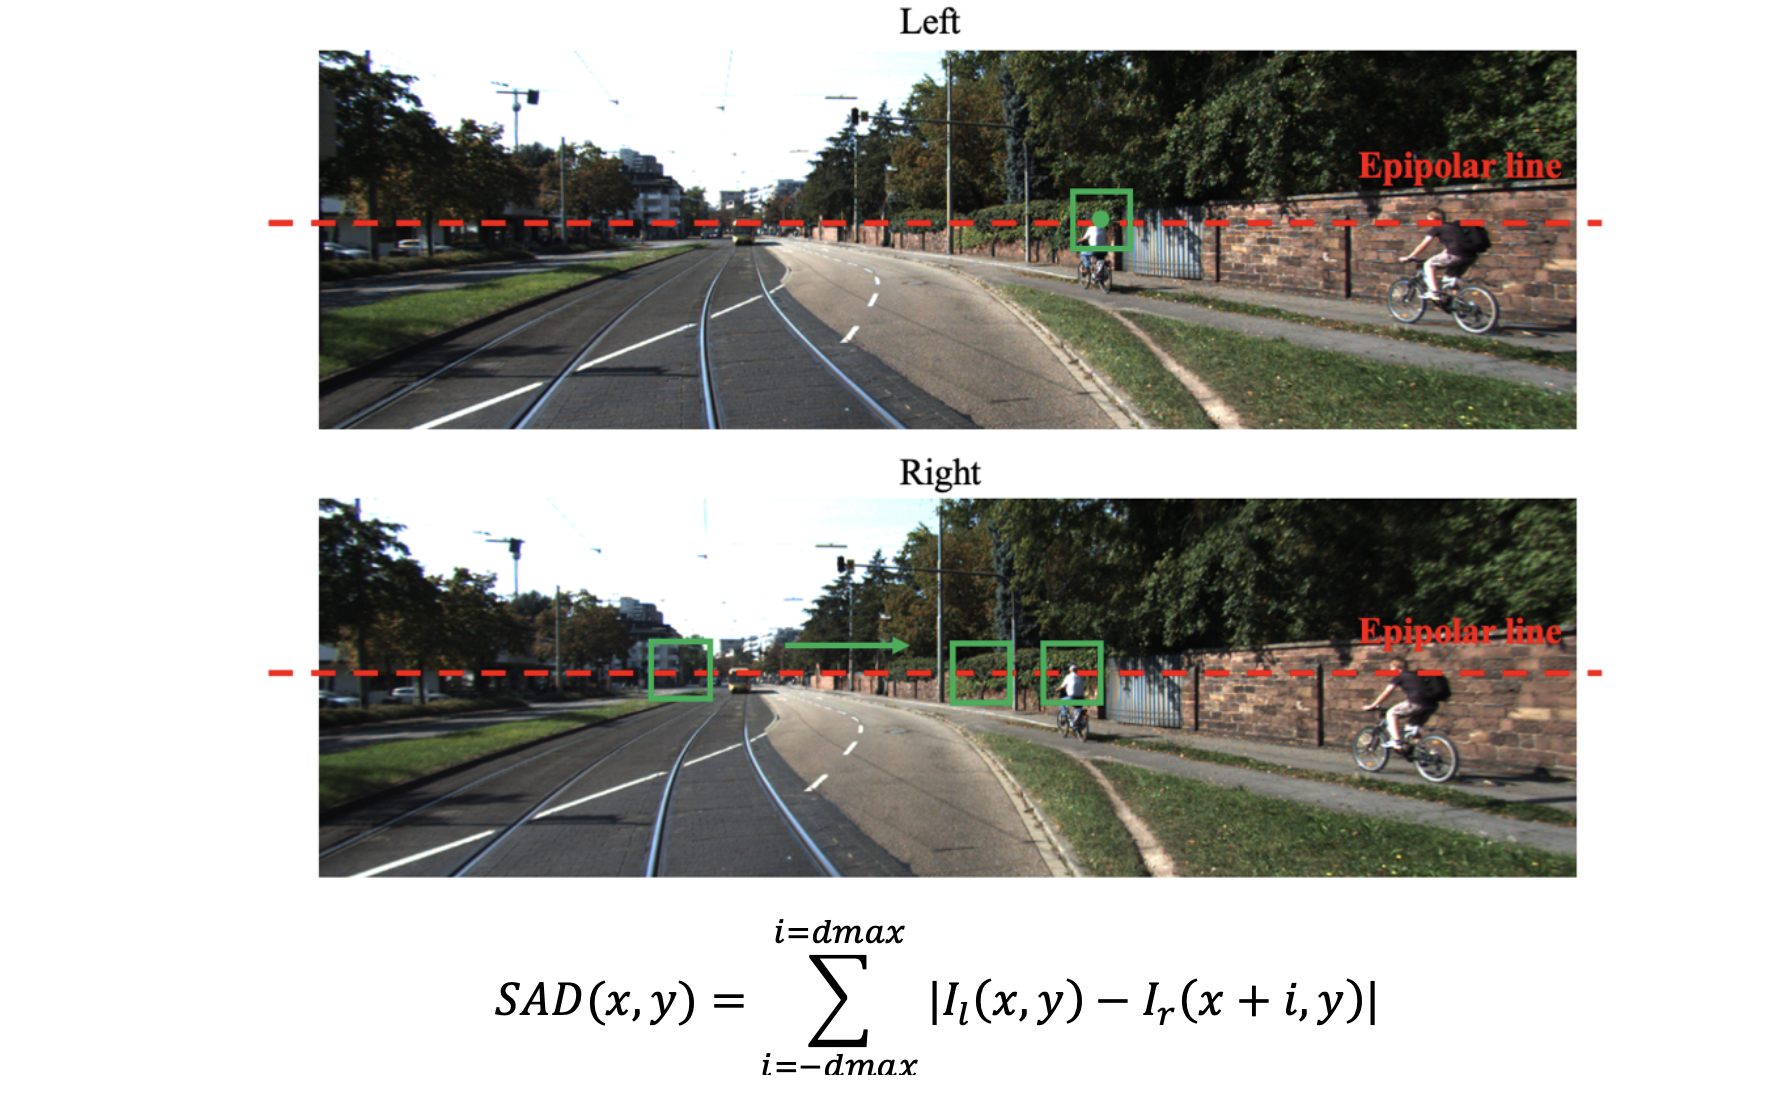
To measure the similarity between blocks, I calculate the sum of absolute difference (SAD). I_l (x,y) represent a block in left image centered at (x,y) and I_r (x+i,y) represent a potential match in right image with shift i pixels. The shift is bounded by dmax. As a result, the disparity is equal to the value i which minimize the above defined SAD.
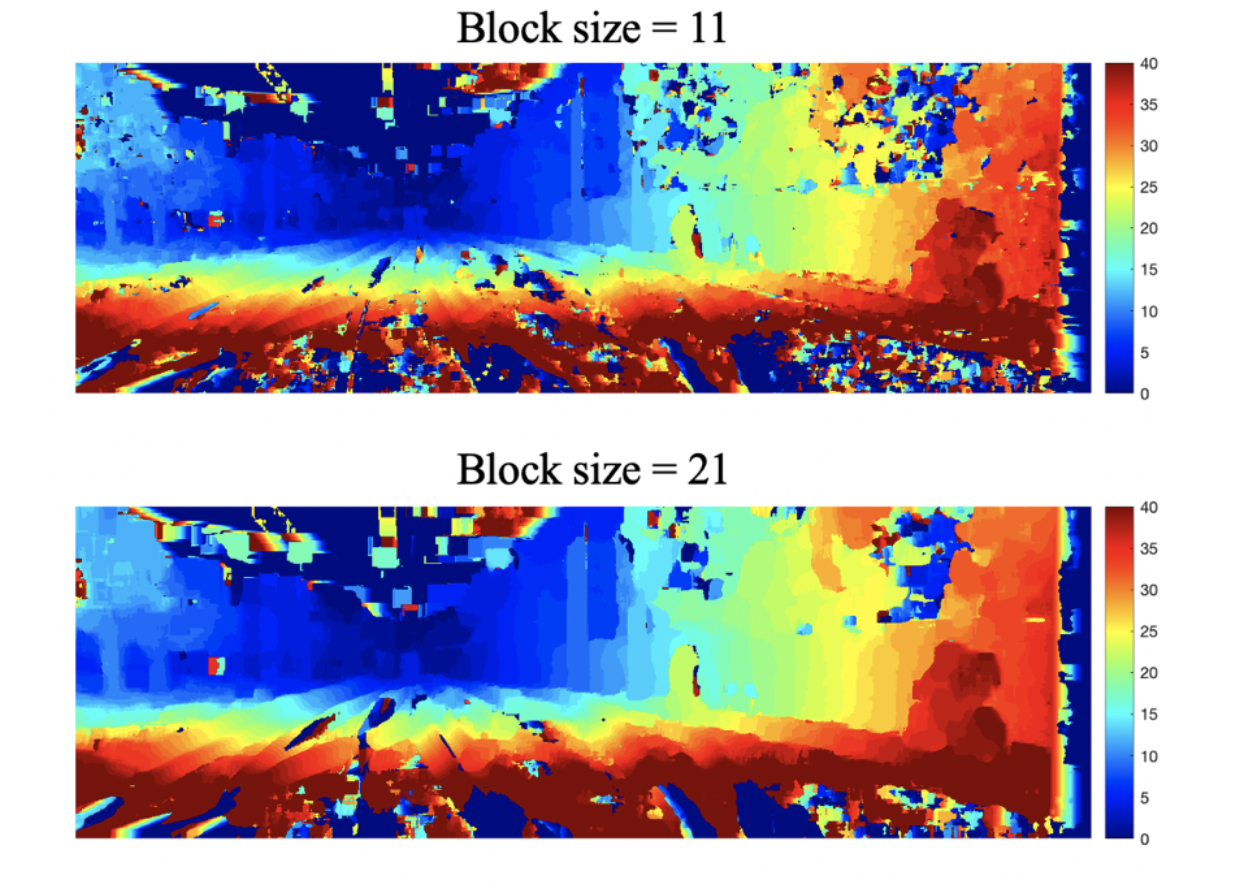
The disparity map of the above frame is shown below with different block size. On one hand, we want block size to be large enough to have sufficient intensity variation for more accurate correspondence calculation. On the other hand, we also want it to be small enough to contain only pixels of the same disparity. As a consequence, disparity map with small block size has more detailed feature while having more discrete artifacts. The situation is reversed for larger block size.
The task of visual odometry is to find the frame-to-frame motion (Translation t and Rotation R) of the stereo image pairs. The basic procedures are: find the features in the current and next frame; match features between frames; find the set of consistent matches which gives minimal reprojection error. For the feature detection and extraction, techniques learned in photostitching project can be readily applied here. Furthermore, circle matching framework in [3] is adopt to achieve a consist match loop.
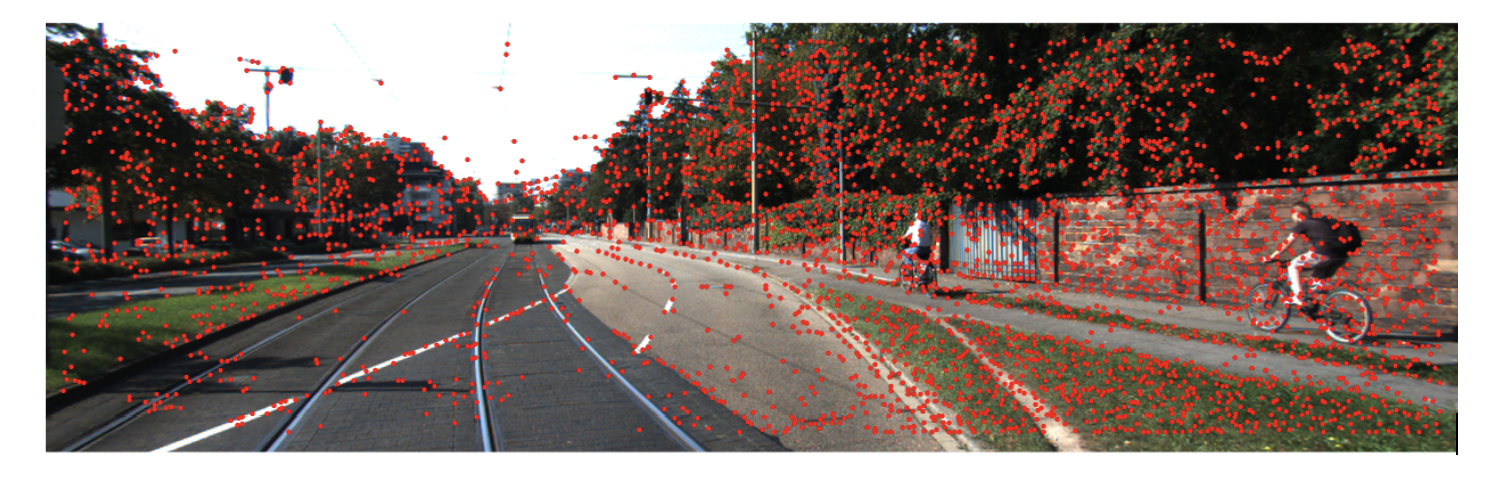
The first step is to detect corner features using Harris corner detector. Based on the definition of corner, when shifting a window in any direction in the image, a corner should give a large change in the intensity. Therefore, I evaluate the local gradient change of change to determine whether the interest point is corner or not. When the corner response value R=detM/TraceM is above certain threshold, the point is retained and then local maxima of Rs are taken as Harris corners. Harris points detection of one frame is shown below:
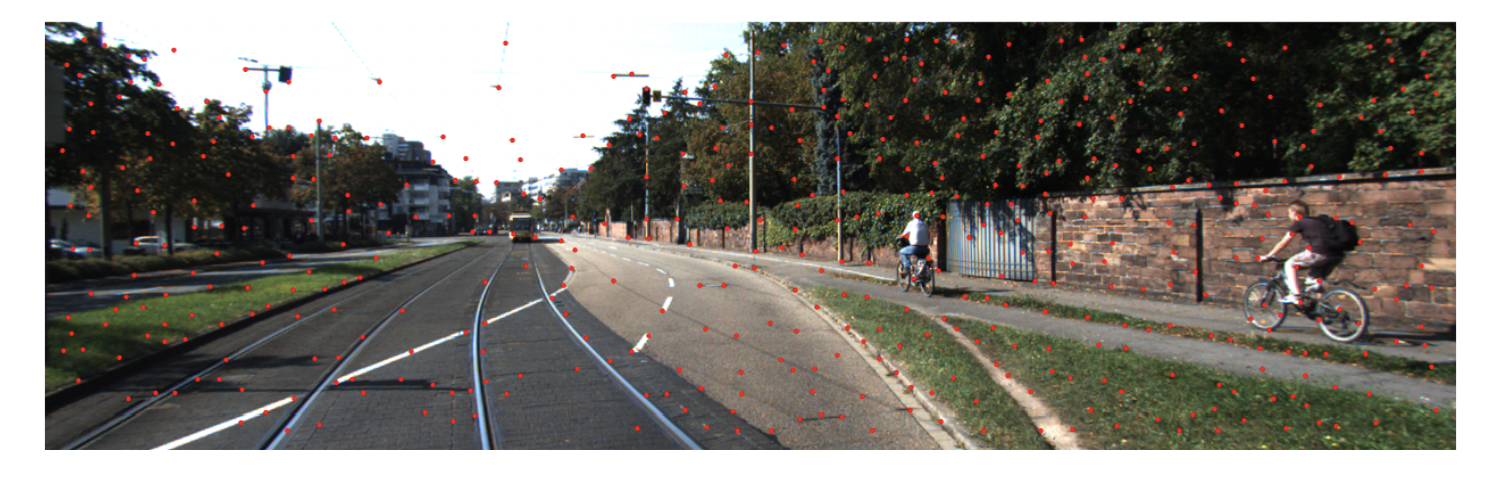
As we can see, points distribution is not uniform over the image. I use Adaptive Non-Maximal Suppression (ANMS) strategy to further refine these points as shown below. The basic idea is that points are suppressed based on the corner strength and only those that are a maximum in a neighborhood of a certain radius are retained. The first point in the list is global maximum. When the suppression radius decreases from infinity, more points are added to the list. Once a point has been added it will remain there. The iteration time depends on the desired number of points wanted. Points with undefined disparity are discarded.
After determining the positions of interest points, feature descriptors will be extracted. A local parch centered at detected interest points with size 40×40 is low-frequency passed first and then resized to 8×8. The normalized parch with zero mean and standard deviation 1 is taken as the feature descriptor for the following feature matching process.
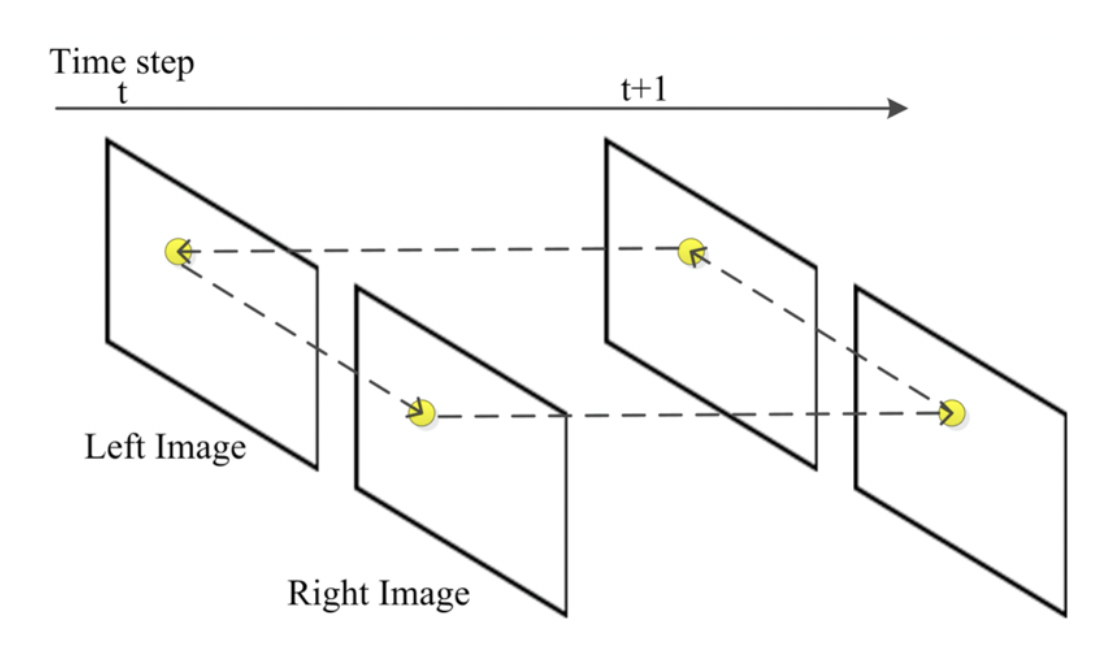
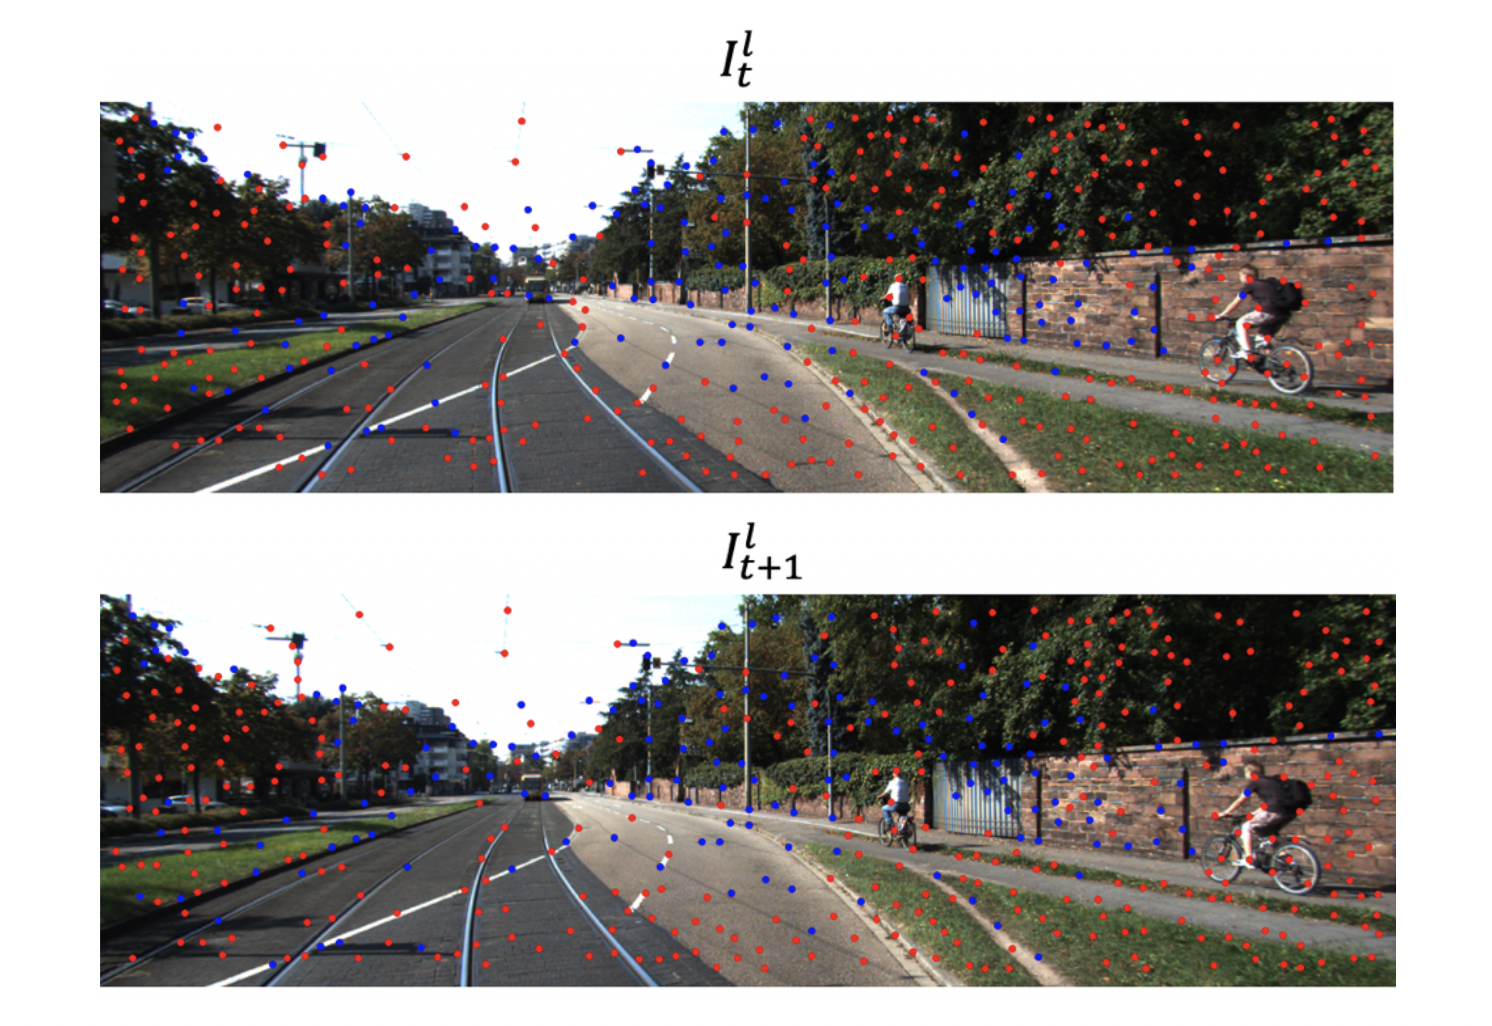
Circle matching is implemented to reject outliers. I_t^l is first matched to I_(t+1)^l, I_(t+1)^r and I_t^r sequentially. If the circle is closed, the feature is matched. Otherwise, the feature will be discarded. An example of matched feature is shown below with blue dot representing matched feature points.
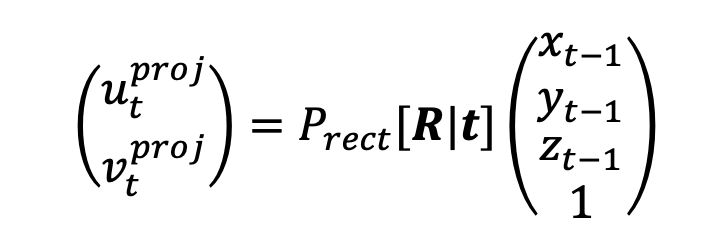
The motion of camera from t-1 to t is given by rotation matrix R and translation vector t. As we have discussed, a 3D feature point can be projected to the image plane by applying the projection matrix P_rect. Thus, the projected feature points from I_(t-1) onto I_t are given by:
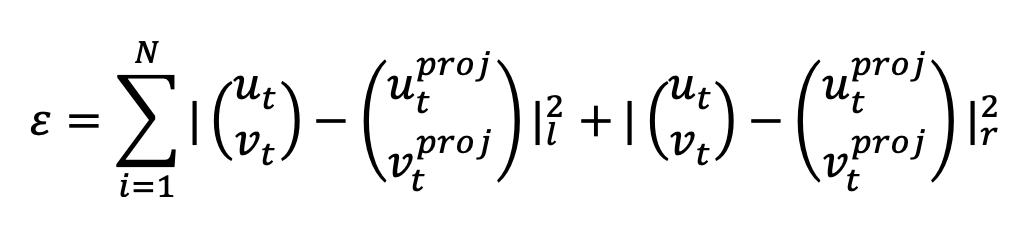
The image reprojection error is given by:
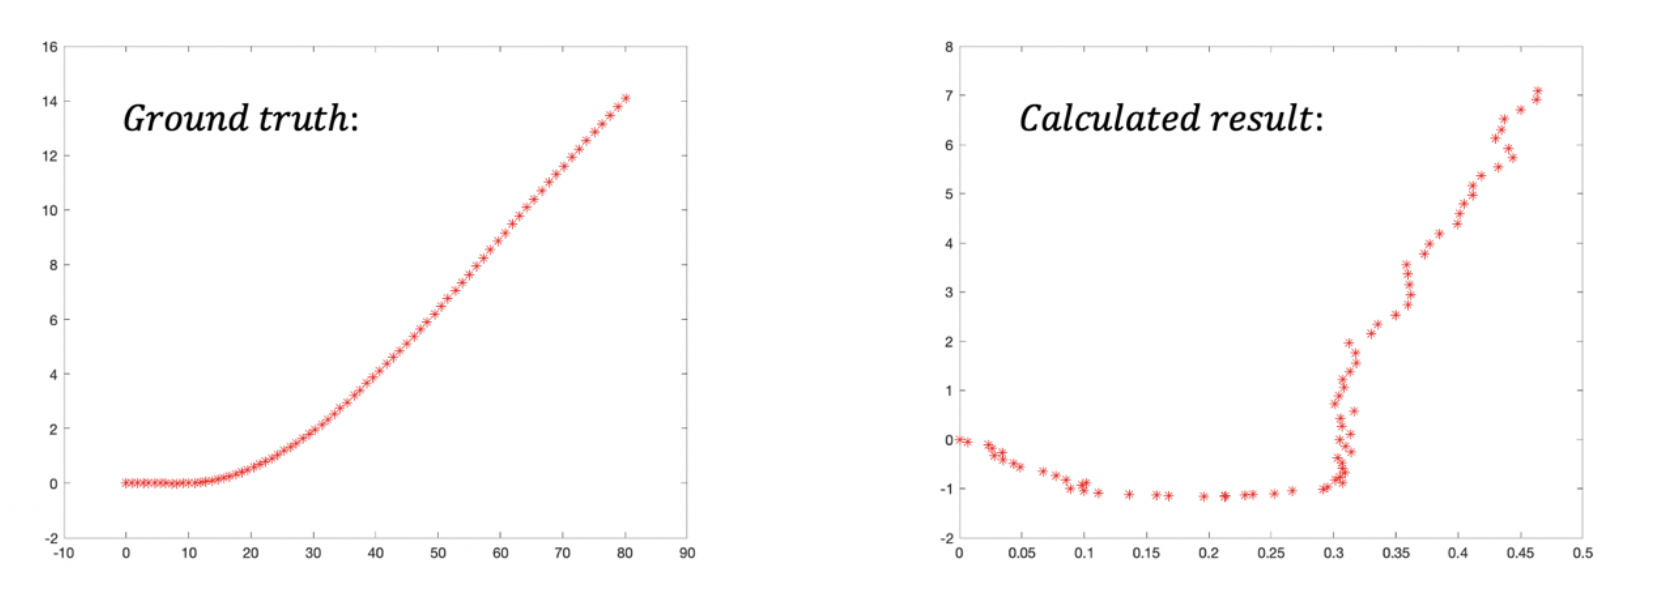
The optimization problem is solved using Levenberg-Marquardt least-squares in Matlab. The result and ground-truth from GPS for a short video with 76 frames are shown below:
In this project, disparity map and visual odometry are calculated for a small set of KITTI data. The main components in both tasks is to find correspondences or matched features. Future work in how to choose initial feature points such as those from Lidar data can further overcome the problem like occlusions in stereo-camera images.
[1] M. Brown, R. Szeliski and S. Winder, "Multi-image matching using multi-scale oriented patches," 2005 IEEE Computer Society Conference on Computer Vision and Pattern Recognition (CVPR'05), San Diego, CA, USA, 2005, pp. 510-517 vol. 1, doi: 10.1109/CVPR.2005.235.
[2] A. Howard, "Real-time stereo visual odometry for autonomous ground vehicles," 2008 IEEE/RSJ International Conference on Intelligent Robots and Systems, Nice, 2008, pp. 3946-3952, doi: 10.1109/IROS.2008.4651147.
[3] Liu Y., Gu Y., Li J., Zhang X. Robust stereo visual odometry using improved RANSAC-based methods for mobile robot localization. Sensors. 2017,17:2339. doi: 10.3390/s17102339.