Senate Voting Analysis and Visualization
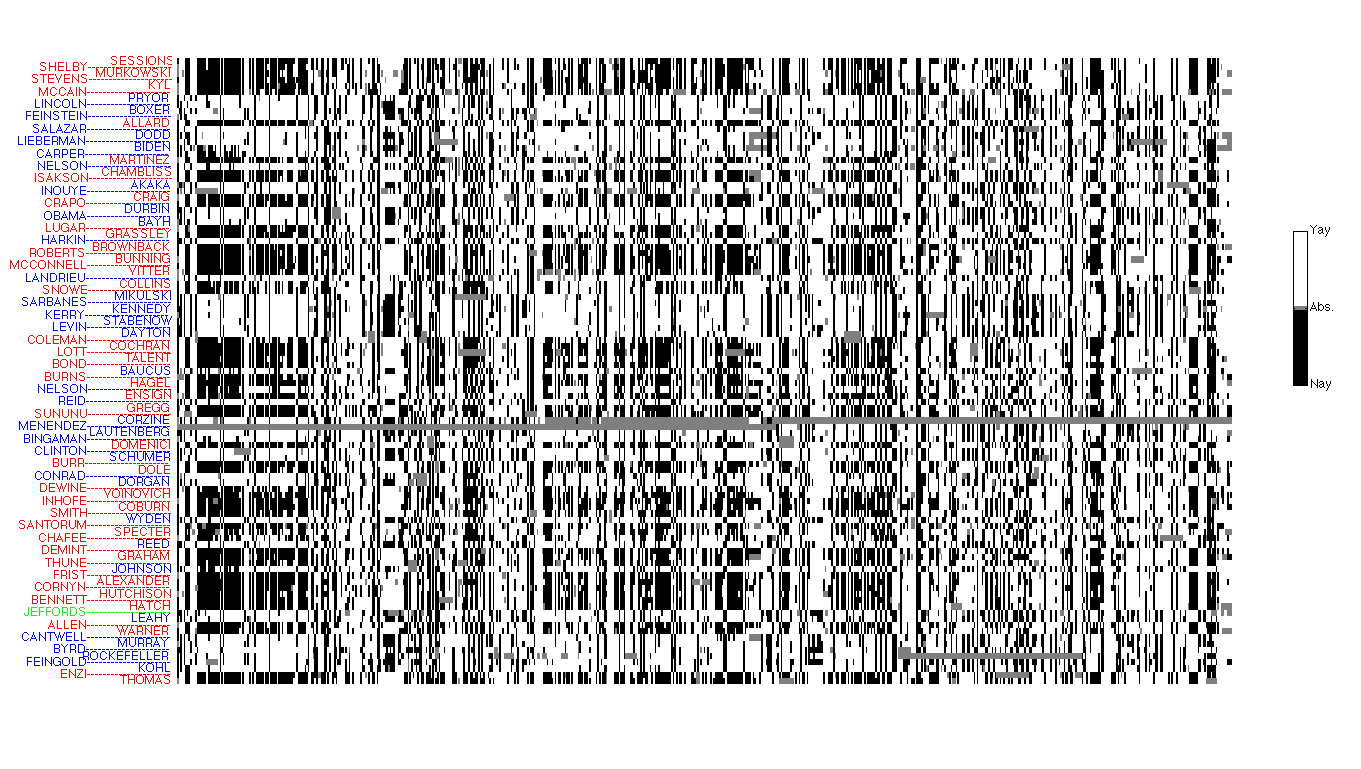 |
In this case study, we take data from the votes on bills in the US Senate (2004-2006), shown as a table on the left, and explore how we can visualize the data by projecting it, first on a line then on a plane. We investigate how we can choose the line or plane in a way that maximizes the variance in the result, via a principal component analysis method. Finally we examine how a variation on PCA that encourages sparsity of the projection directions allows to understand which bills are most responsible for the variance in the data. Source: VoteWorld. |