| Allegro CL version 6.2 Unrevised from 6.1 | |||||||||
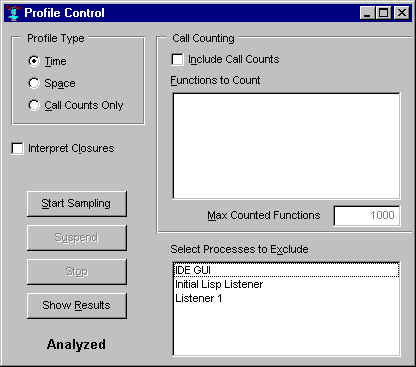
This dialog is displayed with the Run | Profile Control Dialog command.
This dialog has buttons for starting, suspending, and stopping the collection of profile data, and also has controls for specifying the type of data to be collected. Profile data are useful for determining which functions in your application are using a lot of time or are using a lot of memory to create lisp objects. See profiling.htm for a full description of the profiler in Allegro CL.
The radio-buttons at the upper left indicate the basic type of profile data to be collected, depending on whether you are interested in what code is taking most of the time (a Time profile), what code is doing most of the consing of new objects (a Space profile), or which functions are getting called frequently (Call Counts Only).
The Interpret Closures check-box indicates whether separate nodes will be created in the profile statistics for closures (when checked, they will, when unchecked, they will not).
The controls at the upper right determine whether function calls are counted, what particular functions should definitely be counted, and the maximum number of functions that will be counted. Once you have checked that call counts are to be included, you may then enter function names into the "Functions to Count" text widget (one per line is suggested, though you need only include spaces between function names) and/or enter how many functions should be counted.
The item-list at the lower right allows you to exclude particular processes from the profile. Just single-click the names of any processes that are not of interest, and dark highlighting will indicate that they are being excluded. Single-click them again to return them to the processes being profiled. If not all of the current processes are shown in the list, invoking the Run | Profile Control Dialog command again will refresh the list to reflect all current processes. You may want to exclude the IDE GUI thread, for example, since code running there is usually running the IDE itself rather than the application that you are developing in the IDE.
When you click the Start Sampling button, start-profiler is called to begin collecting profile data, passing arguments that correspond to the information that you have specified in the various other controls on the dialog.
While sampling is occurring, you may press either the Suspend button to discontinue sampling temporarily (if you may want to add more samples to the same dataset a bit later; see stop-sampling) or click the Stop button when you are ready to analyze the data (see stop-profiler).
You may also go ahead and stop while suspended. While in the suspended state, the title of the Start Sampling button changes to say Resume, and will call start-sampling (rather than start-profiler) to continue sampling using the parameters that were in place when the profile was first started.
The Show Results button may be pressed after the profile has been stopped. It displays the Profile Results dialog and (programmatically) presses its Update button (if it is available) to display the results of the new profile in that dialog.
Note that the Start / Resume, Suspend, and Stop buttons have global keyboard accelerators so that you may start and stop a profile, for example, while a Run | Run Project application window is selected. This lets you avoid switching to or from the IDE while sampling may be occurring. The global keyboard shortcuts are shown in the IDE status-bar when the mouse cursor is held over the buttons, and are also shown in the Profile Control submenu of the Run menu on the IDE menu-bar.
Also, when profiling is started from the Start Profiling command in the Run | Profile Control submenu, the parameters that are currently selected in the Profile Control Dialog (if it has been invoked in this IDE session) are still used. This is true even if the dialog has been "closed", since the IDE actually just hides this dialog when a close gesture is made on it.
The static-text control at the lower left indicates the current state of the profiler, as returned by profiler-status. When the state is Sampling, it is shown in red to help you avoid collecting a huge sample by inadvertently remaining in this state for a long time.
Copyright (c) 1998-2002, Franz Inc. Oakland, CA., USA. All rights reserved.
Documentation for Allegro CL version 6.2. This page was not revised from the 6.1 page.
Created 2002.2.26.
| Allegro CL version 6.2 Unrevised from 6.1 | |||||||||