| Allegro CL version 6.2 Unrevised from 6.1 | |||||||||
This dialog displays profile statistics. A profile is a collection of data about which functions were being called and where most of the time was being spent or where the most memory was being used by the creation of new lisp objects.
To start collecting profiling data, either invoke the Run | Profile Control | Start/Resume Profiler command or display the Profile Control dialog (by invoking the Run | Profile Control Dialog command) and press its Start Sampling button. When you feel enough data has been collected, stop profiling either with Run | Profile Control | Stop Profiler command or the Stop button on the Profile Control dialog. Now you are ready to analyze the data using this dialog. (Alternately, you can call start-profiler, stop-profiler, and related commands programmatically, and then display the results on this dialog.)
When the dialog is first displayed by the Run | Profile Results Dialog command, no information is displayed, and so you need to press the Update button to analyze the current profile data and display it here. Similarly, if a subsequent profile is performed, invoking this dialog with the Run | Profile Results Dialog command will continue to show the currently-analyzed profile until you again press the Update button to analyze the newer profile. (On the other hand, pressing the Show Results button on the Profile Control dialog will automatically update this dialog to show the new profile.)
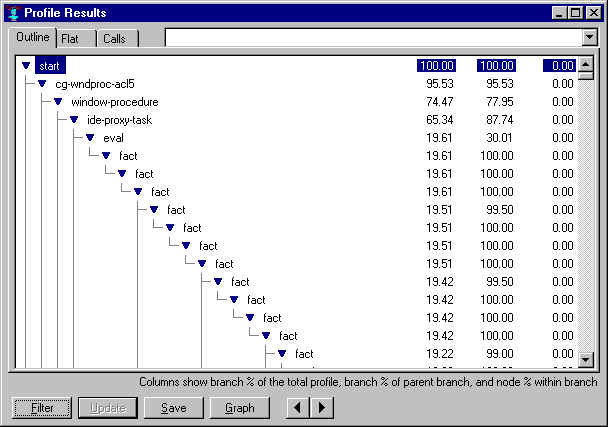
The three tabs summarize the collected data in up to three ways. Illustrated above is the Outline presentation, which corresponds to the output from show-call-graph.
The second tab is the Flat presentation, which corresponds to the output from show-flat-profile.
The third tab is the Call Counts presentation, which corresponds to the output from show-call-counts.
Nodes in the outline presentation indicate functions or methods called, as do the entries in the left column of the Flat and Call Counts displays. The Flat and Call Counts presentations may be sorted differently by clicking on the column headers. And (as usual in the IDE dialogs), the Search | Find command may be used to search for arbitrary strings in any of the presentations.
Clicking the Graph button presents the information from the Outline presentation as a tree graph. The blue bars on the left side of the graph nodes indicate the portion of the time spent (or space consed) in the node's branch as a fraction of the time spent in the parent node's branch. If the blue bar is as tall as the node itself, that indicates that 100% of the time in the parent branch was spent in this branch; a blue bar half as tall as the node indicates that 50% of the parent branch was spent in this branch. If there is a green bar, that indicates the portion of the entire profile time that was spent in this node's branch. The yellow bar on the right side of a node indicates the portion of that node's branch that was spent within that node itself, as opposed to its sub-nodes; in other words, the portion of hits that occurred within that function itself rather than in the functions that it called. The yellow bars are not drawn on the leaf nodes since they would always be the full node height on those nodes. Similarly, the blue bars are not drawn on "only child" nodes, since they would also always be the full node height.
Press this button to display a dialog showing various types of nodes to exclude from the profile outline or graph. This can be useful to prune a huge number of profile nodes down to a more manageable set. Press the Update button after modifying the filter to update the display to reflect the new filter.
Press this button to allow re-viewing this profile after further profiles have been performed (within this IDE session). You will be asked to enter a name for the profile, which will be added to the combo-box list at the top of the dialog. Selecting the name from this combo-box at some later time will once again display that profile in the dialog.
The right-button menu in the Outline view or in a profile graph contains special profile commands, rather than the usual selection of commands from the menu-bar as in most IDE dialogs.
When a number appears after a method or function name, either in the outline view or a profile graph, it is the number of times that that method or function was called. These numbers will be shown only when call counts were included in the profile, and only for the particular methods or functions that were counted). If the method or function appears in more than one branch of the profile, the number is for the whole profile rather than for that particular branch.
When the text in a node of a profile graph is dark blue rather than black, it indicates that there are additional nodes in the graph for that method or function, where it was called in other places. The commands "Print Statistics" and "Graph Combined Subtree" on the right-button menu may be particularly useful on these nodes, because they provide combined information on all of the branches that begin with that method or function.
Copyright (c) 1998-2002, Franz Inc. Oakland, CA., USA. All rights reserved.
Documentation for Allegro CL version 6.2. This page was not revised from the 6.1 page.
Created 2002.2.26.
| Allegro CL version 6.2 Unrevised from 6.1 | |||||||||