Testing
NOTE (4/17/22): We have pushed a change to the testing Makefile so that
the command make check will run your created tests in student_tests as
well as the ones in samples. Please run git fetch shared and git merge shared/proj3
-m "some message here") to get these new changes locally.
As usual, testing is part of the project. Be sure to provide
your own acceptance tests for each of the commands, covering all the specified
functionality. Also, feel free to add unit tests to UnitTest.java or other
testing classes it invokes in its main method. We don't provide any unit tests
for Gitlet since unit tests are very dependent on your implementation.
We have provided a testing program that makes it relatively easy to write
acceptance tests: testing/tester.py. As with Project #2, this interprets
testing files with an .in extension.
As with projects 0-2, the following commands will run your unit tests, acceptance
tests, or the entire testing suite respectively:
make unit
make acceptance
make check
Furthermore, we've added an additional Makefile target:
make docThis command will generate a group of files based on your current project code that
represents the "design" of your code. For instance, if you have some class A.java
in your project, one of the files that make doc generates will be a file that clearly
names all of the methods, variables, and constants that you have so far in A.java. This
file will be called allclasses-index.html, so try opening it in a web browser to see what
was generated!
If you'd like to run a single test, within the testing subdirectory, running
the commands (after first running make)
cd testing
python3 tester.py --verbose FILE.in ...
where FILE.in ... is a list of specific .in files you want to check, will
provide additional information such as what your program is outputting.
The command
python3 tester.py --verbose --keep FILE.inwill, in addition, keep around the directory that tester.py produces so
that you can examine its files at the point the tester script detected an
error.
We've provided some examples in the directory testing/samples. Don't
put your own tests in that subdirectory; place them somewhere distinct so you
don't get confused with our tests vs your tests (which may be buggy!). Put all
your .in files in another folder called student_tests within the testing
directory.
In effect, the tester implements a very simple domain-specific language (DSL) that contains commands to
- Set up or remove files from a testing directory;
- Run
java gitlet.Main; - Check the output of Gitlet against a specific output or a regular expression describing possible outputs;
- Check the presence, absence, and contents of files.
Running the command
python3 tester.py(with no operands, as shown) in the testing directory will provide a message documenting this language.
As usual, we will test your code on the the instructional machines, so do be sure it works there!
We've added a few things to the Makefile to adjust for differences in people's setups. If you are on Windows, you can still use our makefile unchanged by using
make PYTHON=python checkYou can pass additional flags to tester.py with, for example,
make TESTER_FLAGS="--show=all --keep"Lastly, we also have a way of using the IntelliJ debugger to debug Gitlet acceptance tests. This may seem impossible, since we run everything from the command line; however, IntelliJ provides a feature called “Remote JVM Debugging” that will allow you to add breakpoints that trigger during our acceptance tests.
A walk-through of the rest of these testing details can be found here. This video goes over all the steps listed here in the spec but for the Capers lab, so if you find yourself confused on the directions then check it out. The Capers lab was lab 6 in Spring 2021 when this video was made, but for us it is lab 12.
Without JUnit tests, you may be wondering how to debug your code. We'll walk you through how you will do that in Gitlet.
To debug an acceptance test, we first need to let IntelliJ know that
we want to debug remotely. Navigate to your IntelliJ and open your
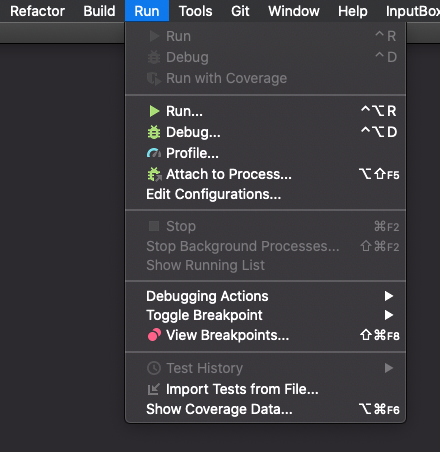
proj3 project if you don't have it open already. At the top, go to
"Run" -> "Run":
You'll get a box asking you to Edit Configurations that will look like the below:
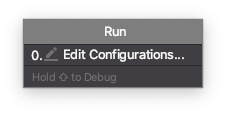
Yours might have more or less of those boxes with other names if you tried running a class within IntelliJ already. If that's the case, just click the one that says "Edit Configurations"
In this box, you'll want to hit the "+" button in the top left corner and select "Remote JVM Debug." It should now look like this:
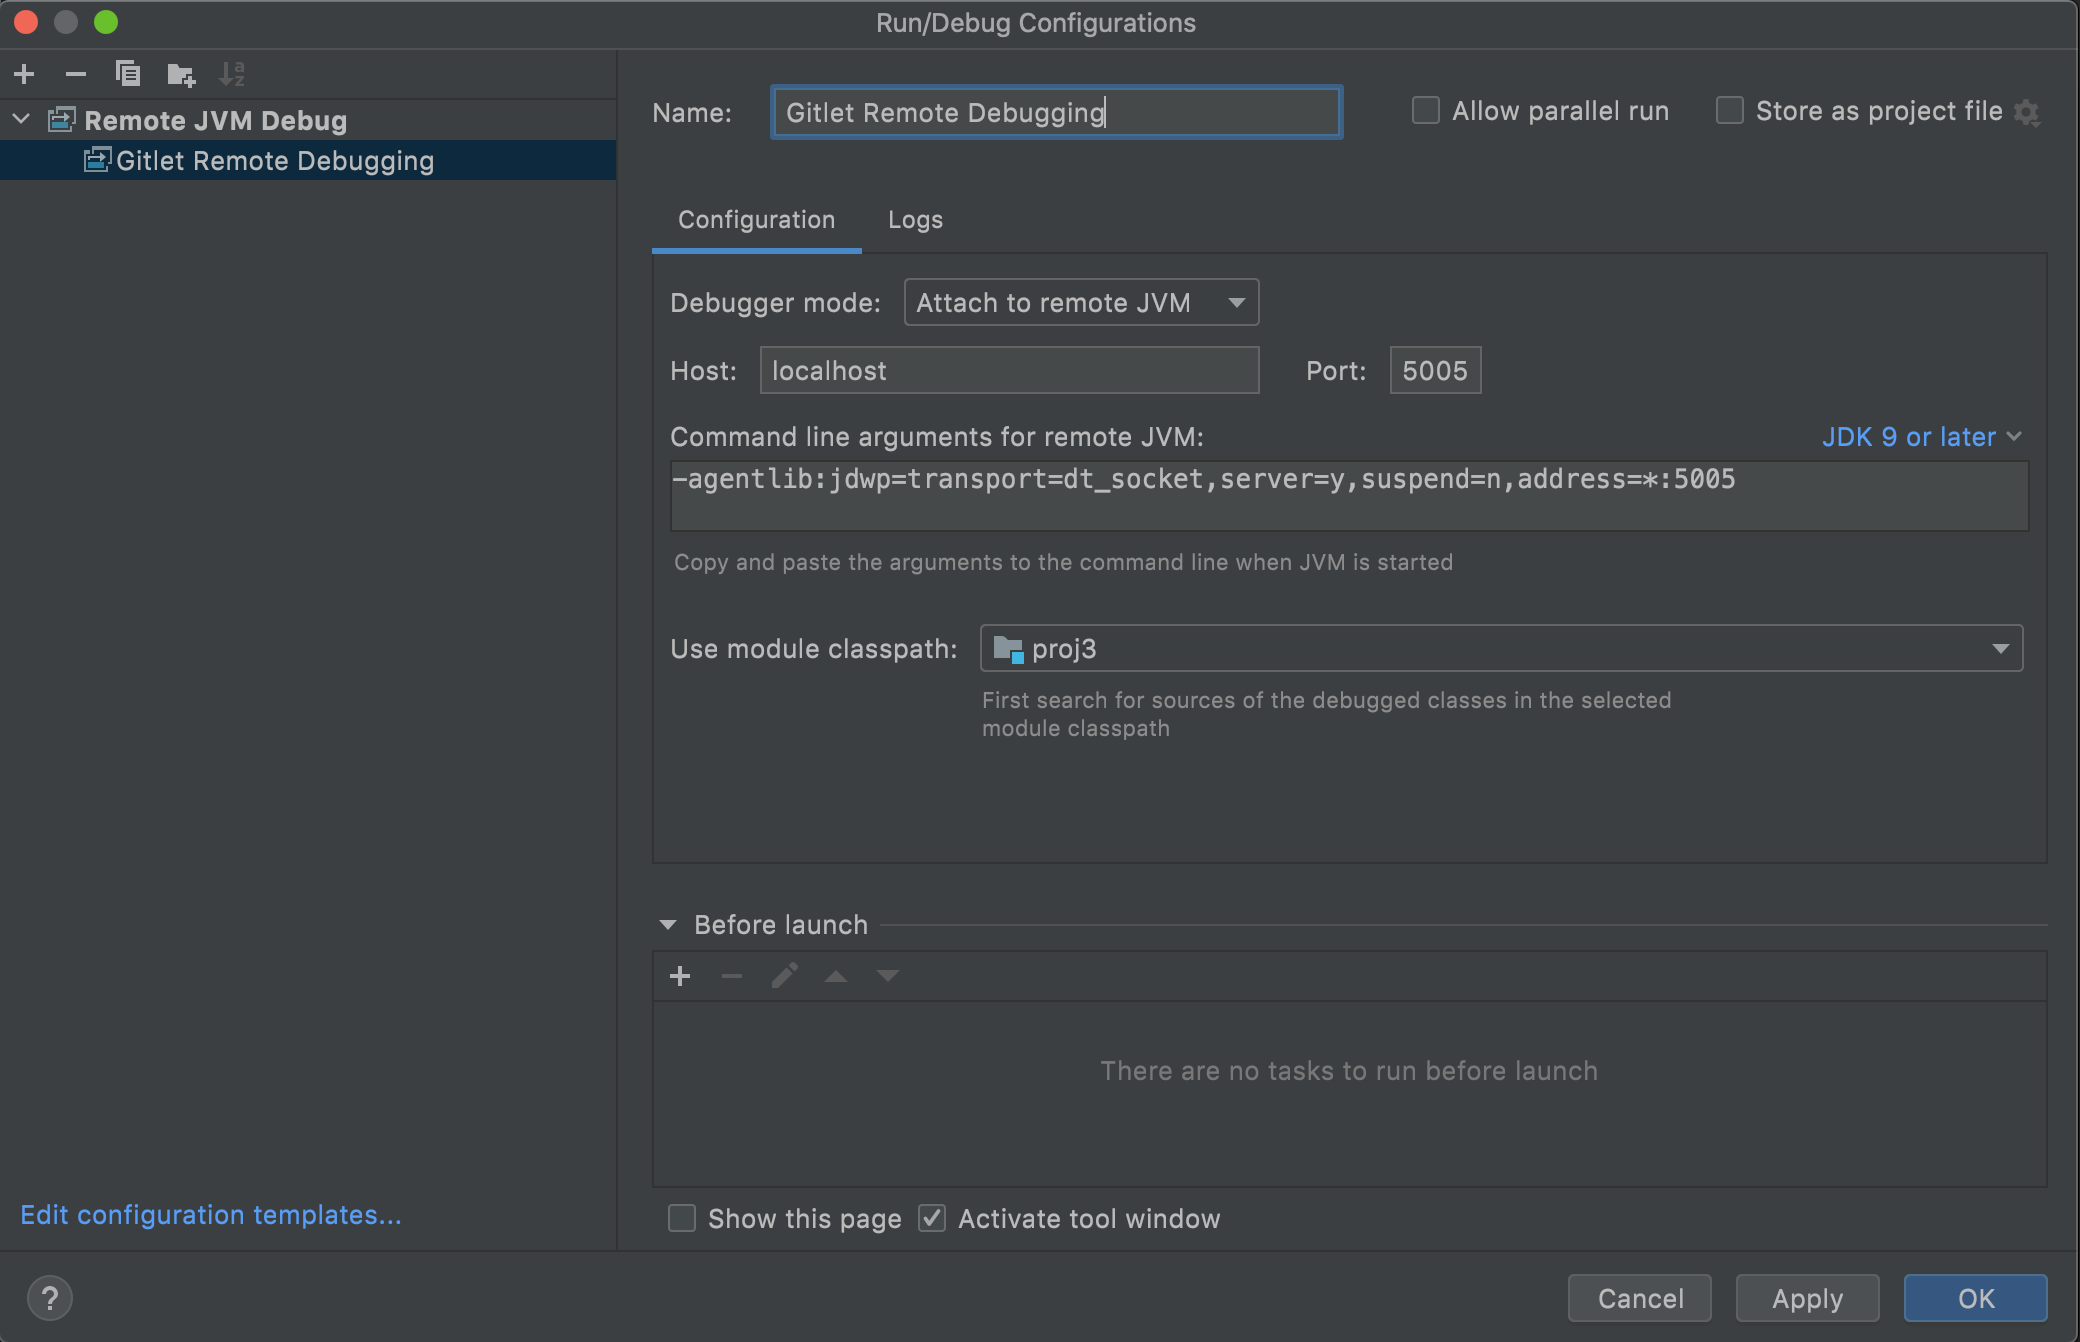
We just need the default settings. You should add a descriptive name in the top
box, perhaps "Gitlet Remote Debug". After you add a name, go ahead and hit
"Apply" and then exit from this screen. Before we leave IntelliJ, place a
breakpoint in the main method of the Main class, so we can actually debug.
Make sure this breakpoint will actually be reached; just put it on the first
line of the main method.
Now you'll navigate to the testing directory within your terminal.
The script that will connect to the IntelliJ JVM is tester.py with the
--debug flag: use the following command to launch the testing script:
python3 tester.py --debug samples/test01-init.inIf you wanted to run a different test, then simply put a different .in file.
If you'd like the .gitlet folder to stay after the test is completed to
investigate its contents, then use the --keep flag:
python3 tester.py --keep --debug samples/test01-init.inFor our example it doesn't matter what you do; we've just included it in case
you'd like to take a look around. By default, the .gitlet that is generated
is deleted.
If you see an error message, then it means you are probably not in the testing
directory. Check those two things, and if you're still confused then ask a TA.
Otherwise, you should be ready to debug! You'll see something like this:
test01-init: You are in debug mode.
    In this mode, you will be shown each command from the test case.
    If you would like to step into and debug the command, type 's'.
      Once you have done so, go back to IntelliJ and click the debug button.
    If you would like to move on to the next command, type 'n'.
[line 3]: gitlet init
>>>
The text above contains helpful tips. What we see next is the name of the .in
file we're debugging, then a series of lines that begin with [line #] and >.
Lines that begin with [line #] are the gitlet commands that will be run on your
Main class, i.e. a specific execution of your program. These correspond to the
commands we saw in the .in file on the right side of the >.
Lines that begin with >>> are for you to enter debug commands on. The 2
commands are listed above.
Remember that each input file will list multiple commands and therefore multiple executions of our program. We need to first figure out what command is the culprit.
Type in the single character "n" (short for "next") to execute this command without debugging it. You can think of it as bringing you to the next command.
One of these will error: either your code will produce a runtime error, or your output wasn't the same. For example:
> python3 testing/tester.py --debug --keep testing/samples/test01-init.in

test01-init: You are in debug mode.
    In this mode, you will be shown each command from the test case.
    If you would like to step into and debug the command, type 's'.
    Once you have done so, go back to IntelliJ and click the debug button.
    If you would like to move on to the next command, type 'n'.
[line 3]: gitlet init
>>> n
ERROR (file or directory .gitlet not present)

Ran 1 tests. 0 passed.
For us, it was our first command. Notice that we had the --keep flag
enabled, so we could now investigate the saved directory test01-
init_0 to see what happened. If we debugged again with the --keep
flag on the same test, we'll get a new directory test01-init_1 and
so on.
Once you've found the command that errors, do it all again except now you can
hit s (short for "step") to "step into" that command, so to speak. Really
what happens is the IntelliJ JVM waits for our script to start and then
attaches itself to that execution. So after you press s, you should hit the
"Debug" button in IntelliJ. Make sure in the top right the configuration is set
to the name of the remote JVM config you added earlier (this is why it is
helpful to give it a good name).
This will stop your program at wherever your breakpoint was as it's trying
to run that command you hit s on. Now you can use your normal debugging
techniques to step around and see if you're improperly reading/writing some
data or some other mistake.
You might get scenarios where the command you're debugging did everything it was supposed to: in these cases, it means you had a bug on a previous command with persistence. For example: let's say your second invocation looks like it is doing everything correctly, except when it tries to read the initial commit (that should have been persistently stored in a file) it receives a blank file (or maybe the file isn't even there). Then, even though the second execution of the program has output that doesn't match the expected, it was really the previous (first) execution that has the bug since it didn't properly persist the data.
These are very common since persistence is a new and initially tricky concept, so when debugging, your first priority is to find the execution that produced the bug. If you didn't, then you would be debugging the second (non-buggy) execution for hours to no avail, since the bug already happened.