Functions and Maps
Definitions: function, domain, map
Graph and epigraph
Level and sub-level sets
Definitions
Functions
In this course we define functions as objects which take an argument in  , and return a value in
  . We use the notation

to refer to a function with ‘‘input’’ space . The ‘‘output’’ space for functions is .
Example: The function  with values

gives the distance from the point  to a given point
  .
.
Domain
We allow functions to take infinity values. The domain of a function  , denoted
  , is defined as the set of points where the function is finite.
Example: Define the logarithm function as the function  , with values
  if
if  , and
, and  otherwise. The domain of the function is thus
  (the set of positive reals).
Two functions can differ not by their formal expression, but but because they have different domains.
Example: The functions  defined as

have the same formal expression inside their respective domains. However, they are not the same functions, since their domain is different. 
Maps
We reserve the term map to refer to vector-valued functions. That is, maps are functions which return more than a single value. We use the notation
to refer to a map with input space and output space  . The components of the map are the (scalar-valued) functions
  ,
,  .
.
Example: a map.
Graph and Epigraph
Consider a function  . We can define two sets relevant to : the graph and the epigraph. Both are subsets of
  .
.
Graph
The graph of is the set of input-output pairs that can attain, that is:

Epigraph
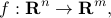
The epigraph, denoted  , describes the set of input-output pairs that can achieve, as well as ‘‘anything above’’ (epi in Greek means ‘‘above’’):

 |
The function |
 and value inside the domain
  . The graph corresponds to the points in blue, and the epigraph is in light blue. The epigraph extends to infinity above the graph. Points outside the domain are not shown.
Level and Sub-level Sets
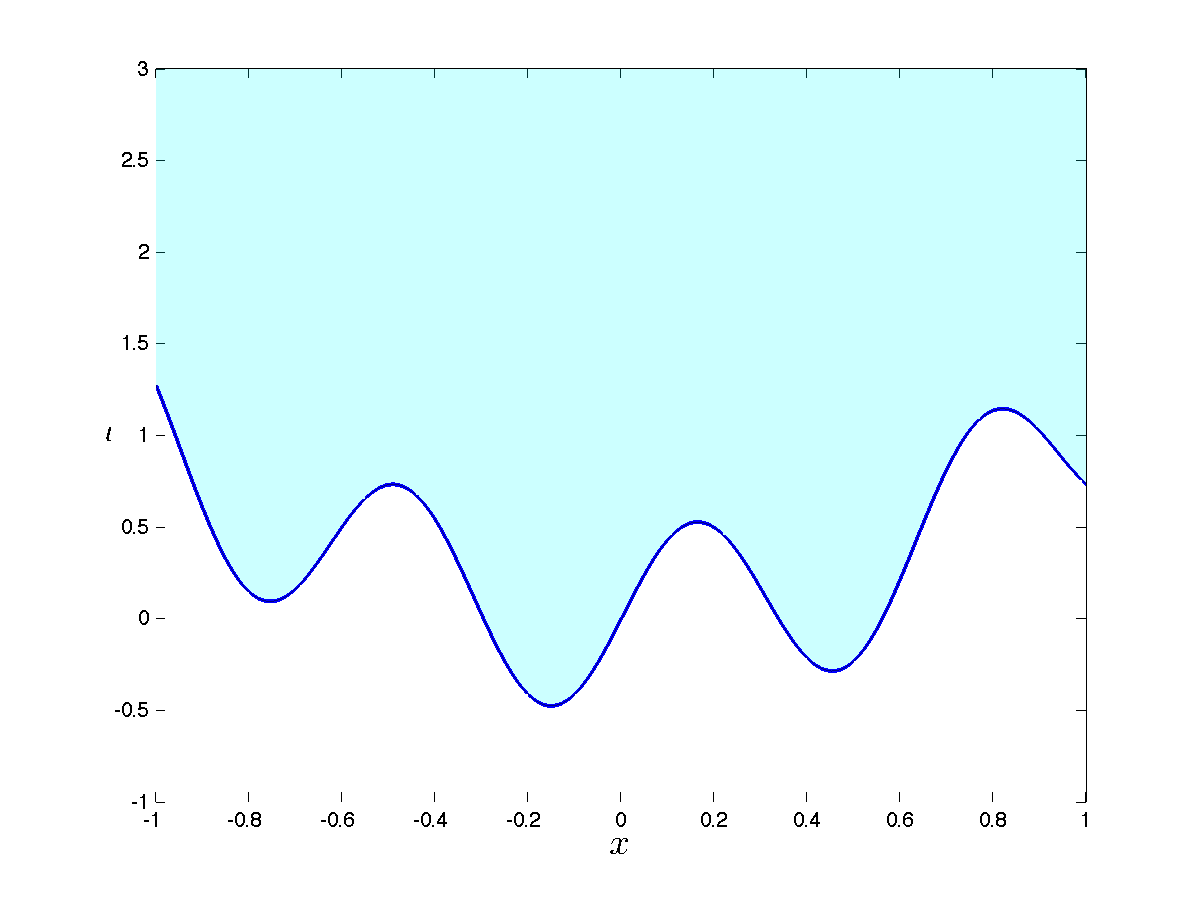
Level and sub-level sets correspond to the notion of contour of a function.
Both are indexed on some scalar value  .
.
Level sets
A level set is simply the set of points that achieve exactly some value for the function . For  , the -level set of the function is defined as

Sub-level sets
A related notion is that of sub-level set. This is now the set of points that achieve at most a certain value for , or below:

 |
Level and sub-level sets of a function 
|
 itself, and values on the domain given by