Senate Voting: Data and Visualization Problem
Data
Visualization problem
Data
The data consists of the votes of  Senators in the 2004-2006 US Senate (2004-2006), for a total of
  bills. “Yay” (“Yes”) votes are represented as
  's, “Nay” (“No”) as
  's, and the other votes are recorded as
  . (A number of complexities are ignored here, such as the possibility of pairing the votes.)
This data can represented here as a  ‘‘voting’’ matrix
 ![X = [x_1,ldots,x_n]](eqs/6993711612919051978-130.png) , with elements taken from
, with elements taken from  . Each column of the voting matrix
  ,
,  contains the votes of a single Senator for all the bills; each row contains the votes of all Senators on a particular bill.
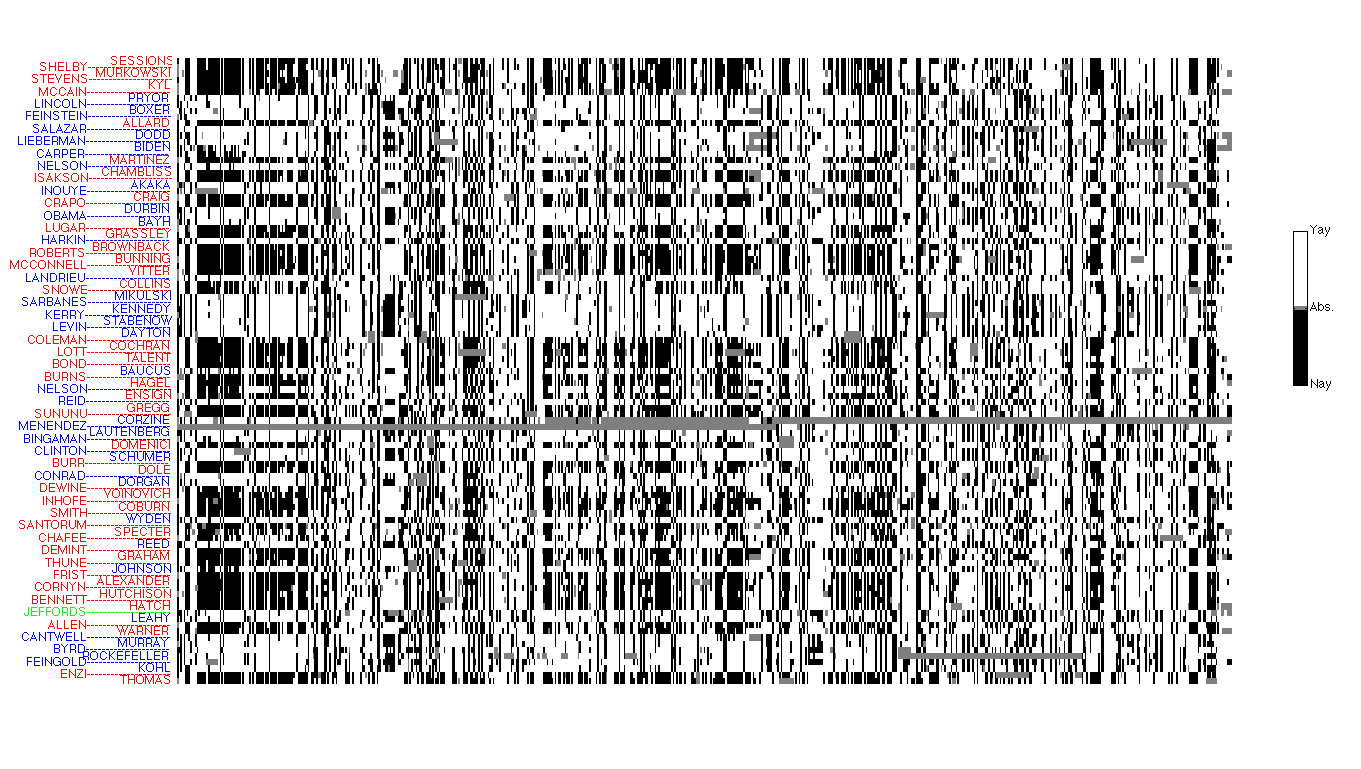 |
Senate voting matrix: “Nay” votes are in black, “Yay” ones in white, and the others in grey. The transpose voting matrix is shown. The picture becomes has many gray areas, as some Senators are replaced over time. Simply plotting the raw data matrix is often not very informative. Source: VoteWorld. |
Visualization Problem
We can try to visualize the data set, by projecting each data point (each row or column of the matrix) on (say) a 1D-, 2D- or 3D-space. Each ‘‘view’’ corresponds to a particular projection, that is, a particular one-, two- or three-dimensional subspace on which we choose to project the data. The visualization problem consists of choosing an appropriate projection.
There are many ways to formulate the visualization problem, and none dominates the others. Here,we focus on the basics of that problem.